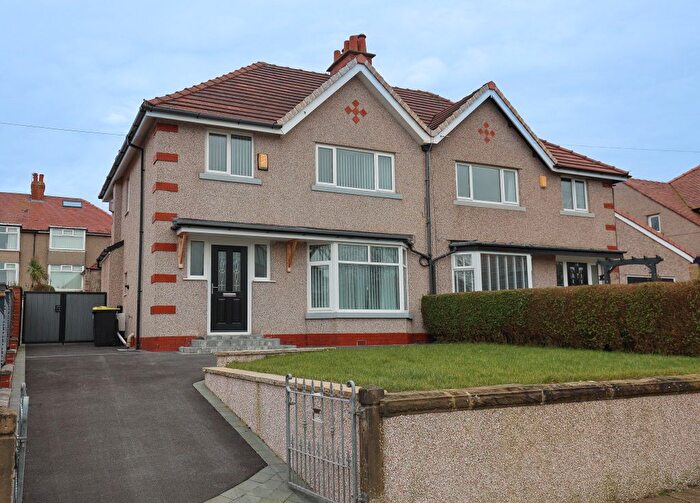
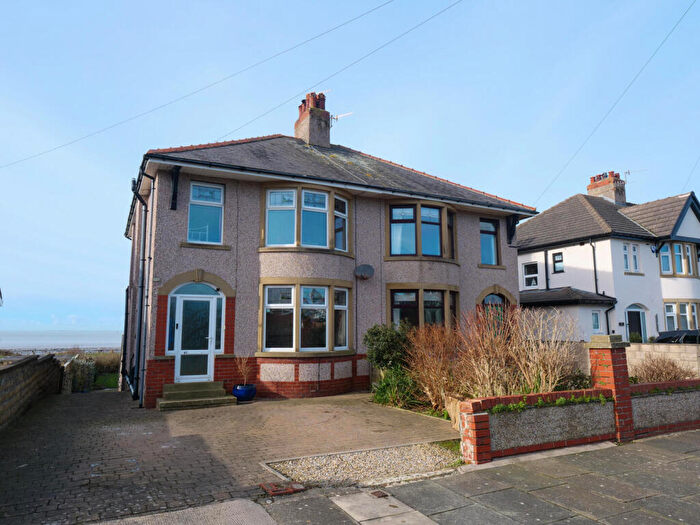
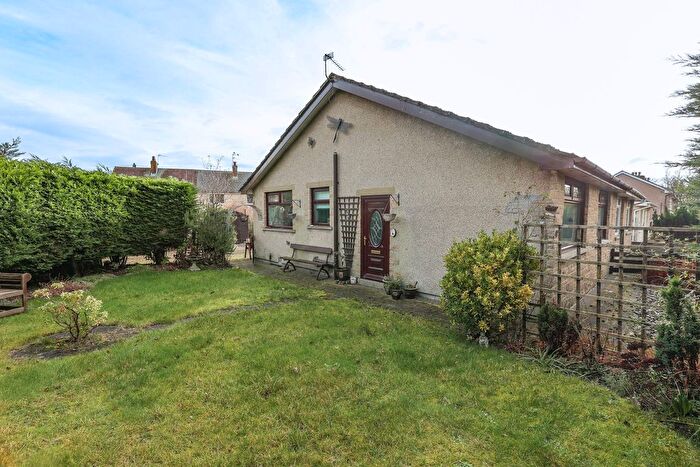
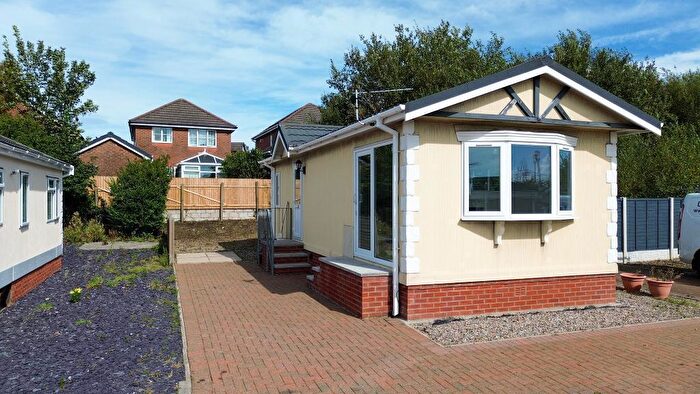
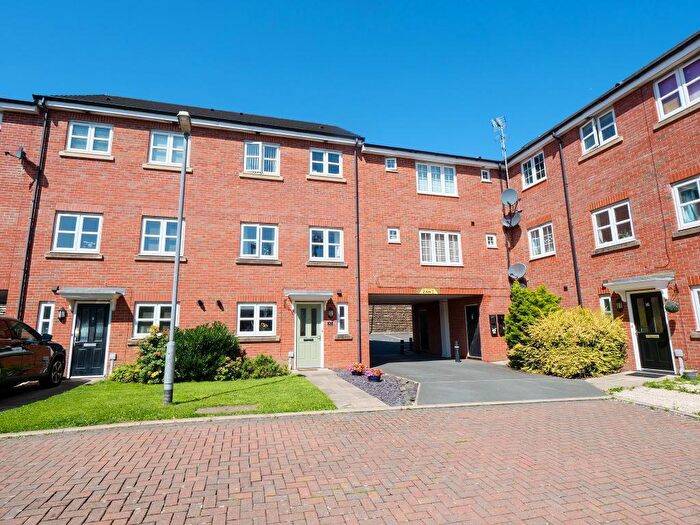
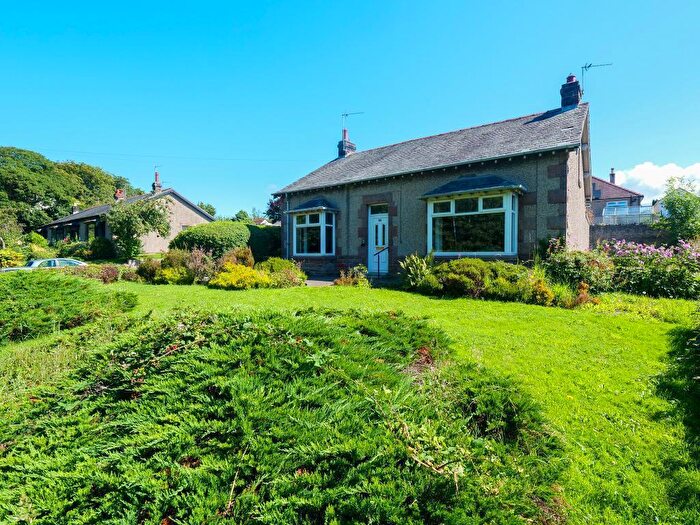
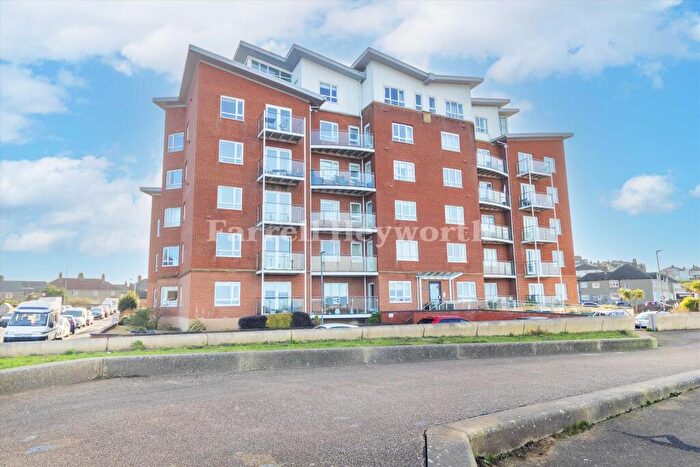
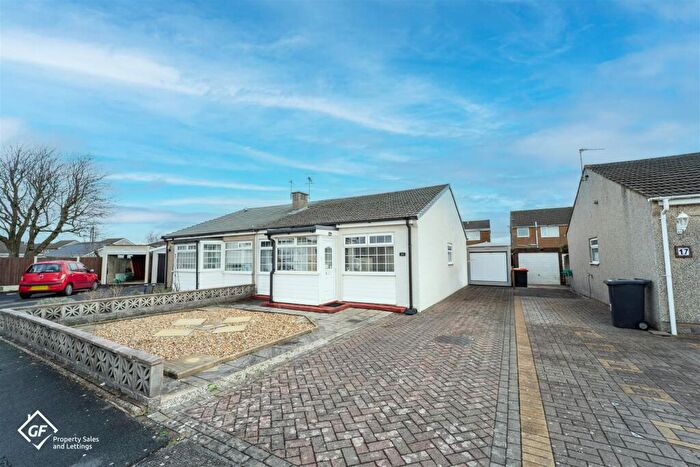
Houses for sale & to rent in Overton, Morecambe
House Prices in Overton
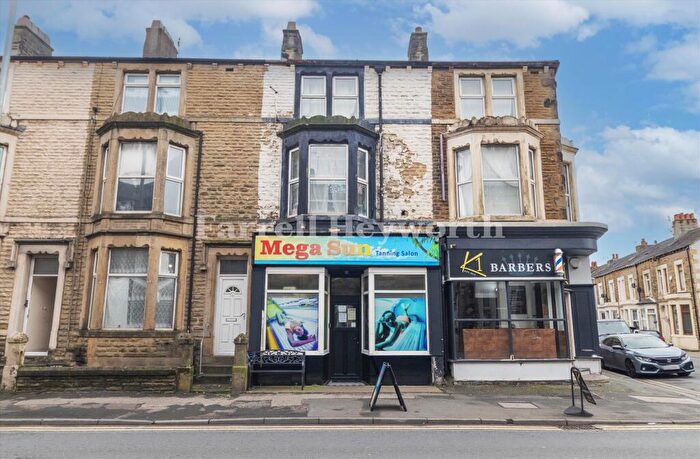
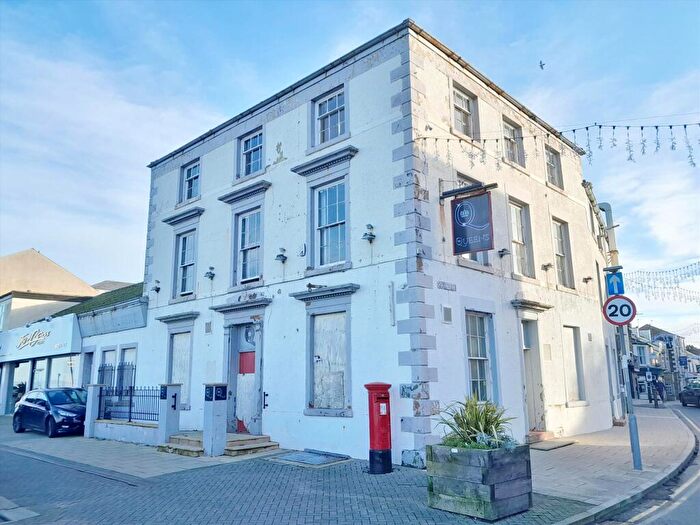
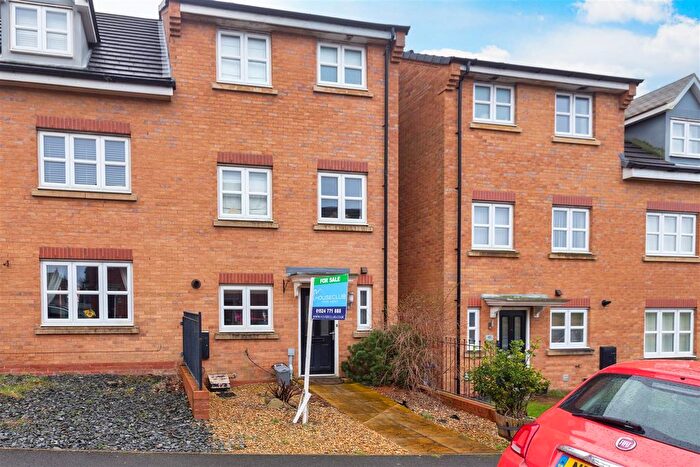
Properties in Overton have an average house price of £219,007.00 and had 93 Property Transactions within the last 3 years¹.
Overton is an area in Morecambe, Lancashire with 1,063 households², where the most expensive property was sold for £1,500,000.00.
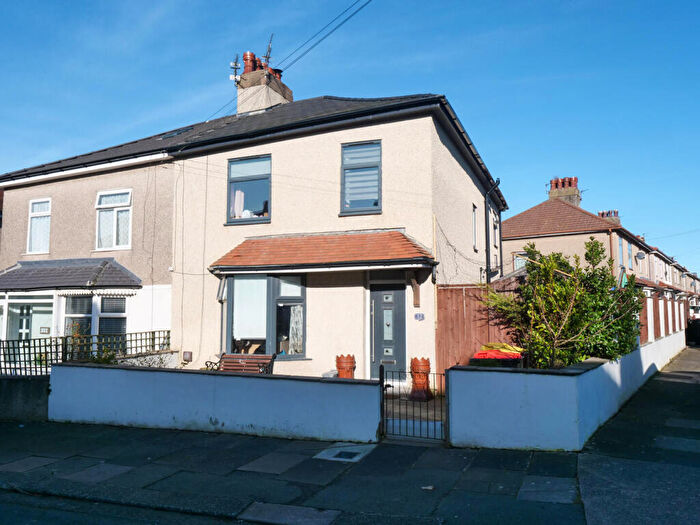
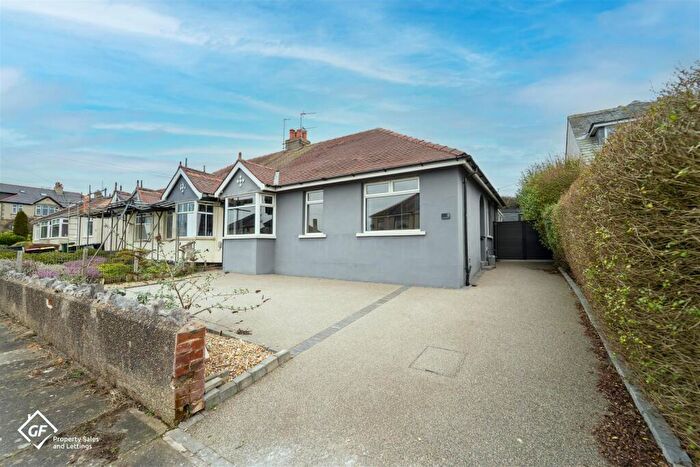
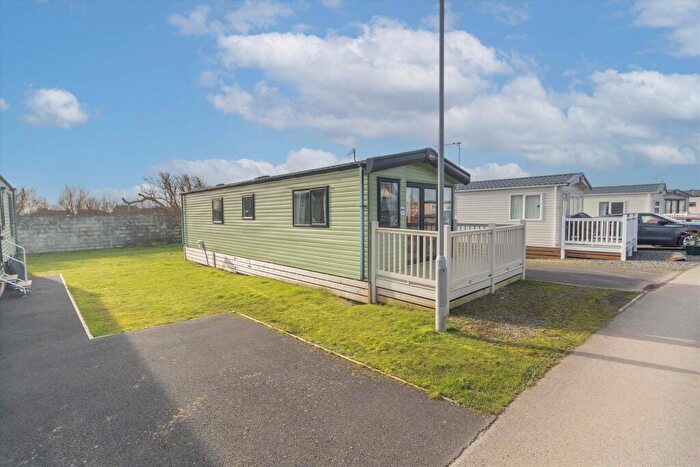
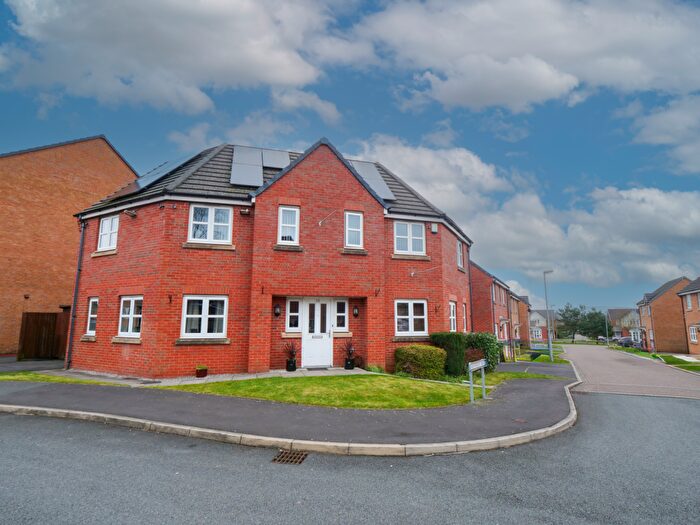
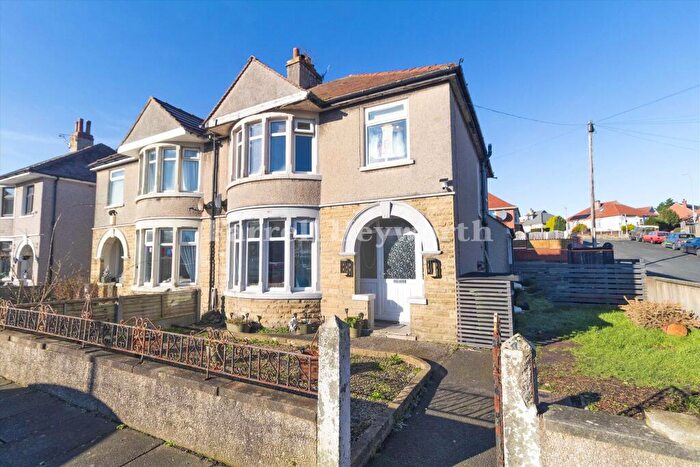
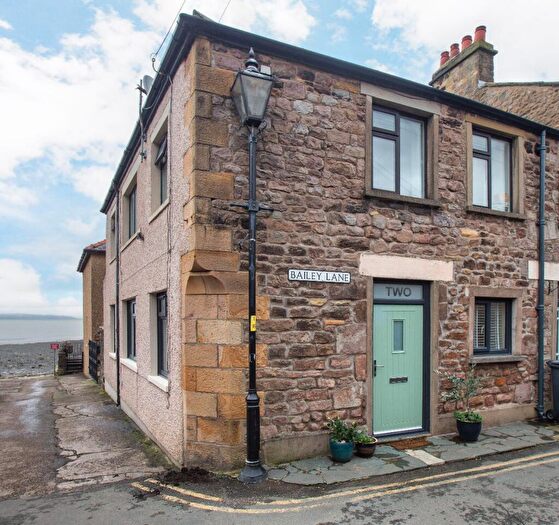
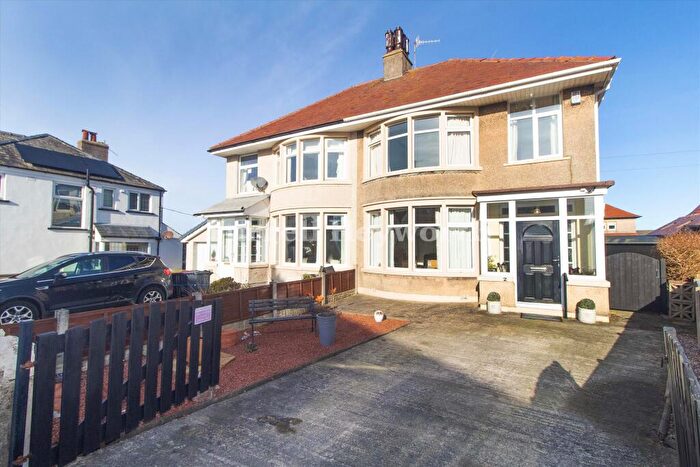
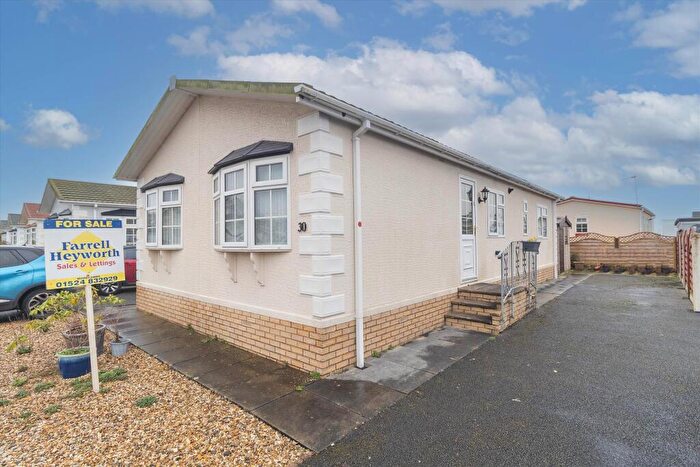
Properties for sale in Overton
Roads and Postcodes in Overton
Navigate through our locations to find the location of your next house in Overton, Morecambe for sale or to rent.
| Streets | Postcodes |
|---|---|
| Back Street | LA3 3HE |
| Badger Wood | LA3 3FJ LA3 3FN LA3 3FR |
| Bazil Grove | LA3 3JD |
| Bazil Lane | LA3 3JB LA3 3JE |
| Borrans Lane | LA3 3QP |
| Carr Lane | LA3 3JX LA3 3LA LA3 3LH LA3 3JQ LA3 3LL |
| Chapel Lane | LA3 3HU LA3 3JA |
| Chapel View | LA3 3EP |
| Church Grove | LA3 3HZ |
| Church Park | LA3 3RA |
| Connaught Road | LA3 2UU |
| First Terrace | LA3 3HR |
| Garden Terrace | LA3 3LQ |
| Hall Drive | LA3 3LE LA3 3LF |
| Hall Greaves Close | LA3 3JN |
| Hall Grove | LA3 3LD |
| Hallam Lane | LA3 3LB |
| Heaton Bottom Road | LA3 3EU |
| Heysham Business Park | LA3 3PP |
| Imperial Road | LA3 3RW |
| Kevin Grove | LA3 3HA |
| Lancaster Road | LA3 3EX LA3 3EZ LA3 3ER LA3 3EY |
| Lavender Way | LA3 3FL |
| Londonderry Road | LA3 2UT |
| Low Road | LA3 3JG LA3 3LG LA3 3PN |
| Main Close | LA3 3JP |
| Main Street | LA3 3HD LA3 3HF |
| Mcdonald Road | LA3 2UX |
| Mellishaw Lane | LA3 3FB |
| Middleton Business Park | LA3 3FH LA3 3PX |
| Middleton Road | LA3 2SB LA3 2SD LA3 2SF LA3 3HB LA3 3JJ LA3 3JS LA3 3JT LA3 3JU LA3 2SE LA3 3JH LA3 3JL LA3 3JW LA3 3NT LA3 3NU |
| Mill Hill Grove | LA3 3JZ |
| Moneyclose Grove | LA3 2XW |
| Moneyclose Lane | LA3 2UW LA3 2XA |
| Moss Road | LA3 3ES |
| Natterjack Lane | LA3 3FG |
| North Quay | LA3 2XF |
| Oakville Road | LA3 2TB |
| Pedder Avenue | LA3 3HH |
| Pedder Drive | LA3 3HJ |
| Pedder Grove | LA3 3HN |
| Pedder Road | LA3 3HL LA3 3HQ |
| Princess Alexandra Way | LA3 2DA |
| Rothesay Crescent | LA3 2XR |
| Rothesay Road | LA3 2UP LA3 2UR |
| Second Terrace | LA3 3HT |
| South Quay | LA3 2XE |
| St Helens Road | LA3 3HY |
| Stephens Grove | LA3 3HX |
| Sunderland Point | LA3 3JF LA3 3HP |
| Sunnycliff Retail Park | LA3 3FE |
| The Lane | LA3 3HS |
| The Orchards | LA3 3DQ |
| The Paddock | LA3 3EB |
| Trumacar Gardens | LA3 2BY |
| Trumacar Terrace | LA3 2SZ |
| Westbourne Road | LA3 3JY |
| Westmoor Grove | LA3 2TA |
| Yenham Lane | LA3 3FP |
| LA3 3ET LA3 2XH LA3 3HG LA3 3HW |
Transport near Overton
- FAQ
- Price Paid By Year
- Property Type Price
Frequently asked questions about Overton
What is the average price for a property for sale in Overton?
The average price for a property for sale in Overton is £219,007. This amount is 16% higher than the average price in Morecambe. There are 3,669 property listings for sale in Overton.
What streets have the most expensive properties for sale in Overton?
The streets with the most expensive properties for sale in Overton are Mellishaw Lane at an average of £1,500,000, The Paddock at an average of £520,000 and First Terrace at an average of £490,000.
What streets have the most affordable properties for sale in Overton?
The streets with the most affordable properties for sale in Overton are Rothesay Crescent at an average of £45,000, Moneyclose Grove at an average of £90,000 and Mcdonald Road at an average of £106,700.
Which train stations are available in or near Overton?
Some of the train stations available in or near Overton are Heysham Port, Morecambe and Lancaster.
Property Price Paid in Overton by Year
The average sold property price by year was:
| Year | Average Sold Price | Price Change |
Sold Properties
|
|---|---|---|---|
| 2025 | £198,322 | -28% |
27 Properties |
| 2024 | £253,224 | 18% |
29 Properties |
| 2023 | £207,283 | 12% |
37 Properties |
| 2022 | £183,269 | -10% |
39 Properties |
| 2021 | £200,866 | 16% |
55 Properties |
| 2020 | £168,042 | 1% |
33 Properties |
| 2019 | £165,568 | 13% |
36 Properties |
| 2018 | £144,823 | -4% |
46 Properties |
| 2017 | £150,166 | 11% |
46 Properties |
| 2016 | £133,600 | -13% |
44 Properties |
| 2015 | £151,030 | 8% |
31 Properties |
| 2014 | £139,231 | 0,3% |
30 Properties |
| 2013 | £138,788 | -9% |
26 Properties |
| 2012 | £151,571 | 2% |
21 Properties |
| 2011 | £148,005 | 8% |
20 Properties |
| 2010 | £136,419 | -6% |
21 Properties |
| 2009 | £144,830 | -9% |
18 Properties |
| 2008 | £157,763 | -7% |
33 Properties |
| 2007 | £168,613 | 21% |
81 Properties |
| 2006 | £132,896 | -2% |
55 Properties |
| 2005 | £135,824 | 27% |
46 Properties |
| 2004 | £98,623 | 10% |
59 Properties |
| 2003 | £88,350 | 18% |
65 Properties |
| 2002 | £72,541 | 11% |
63 Properties |
| 2001 | £64,319 | 6% |
68 Properties |
| 2000 | £60,461 | -29% |
56 Properties |
| 1999 | £78,106 | 33% |
36 Properties |
| 1998 | £52,020 | 22% |
40 Properties |
| 1997 | £40,425 | -17% |
31 Properties |
| 1996 | £47,364 | -4% |
25 Properties |
| 1995 | £49,224 | - |
33 Properties |
Property Price per Property Type in Overton
Here you can find historic sold price data in order to help with your property search.
The average Property Paid Price for specific property types in the last three years are:
| Property Type | Average Sold Price | Sold Properties |
|---|---|---|
| Semi Detached House | £175,481.00 | 43 Semi Detached Houses |
| Detached House | £358,759.00 | 27 Detached Houses |
| Terraced House | £143,275.00 | 20 Terraced Houses |
| Flat | £90,000.00 | 3 Flats |

