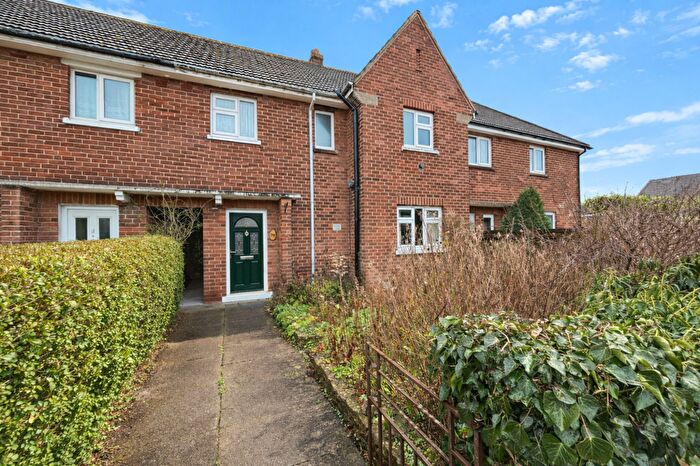
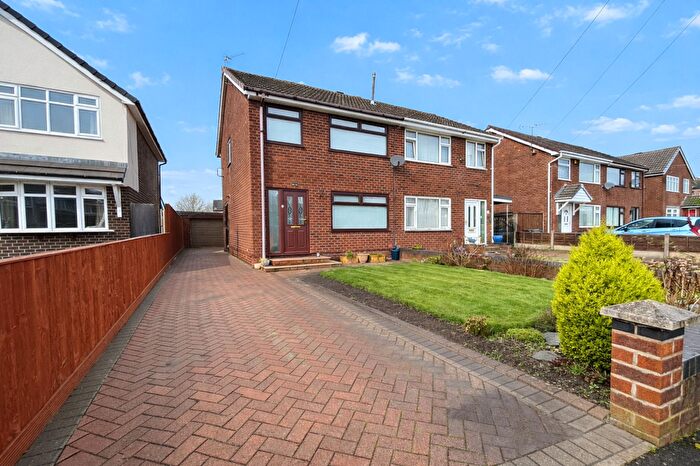
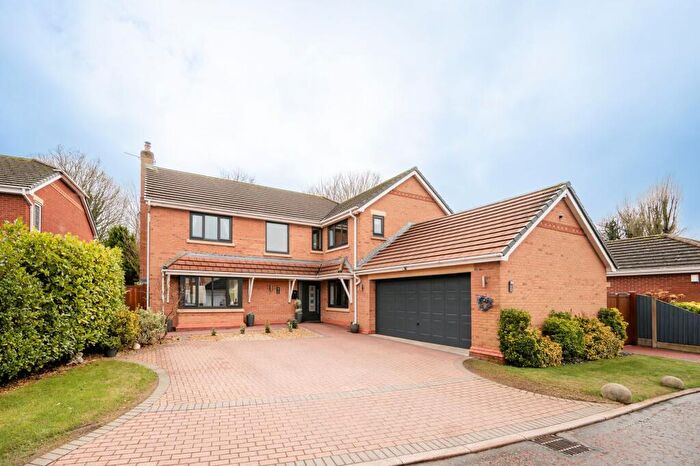
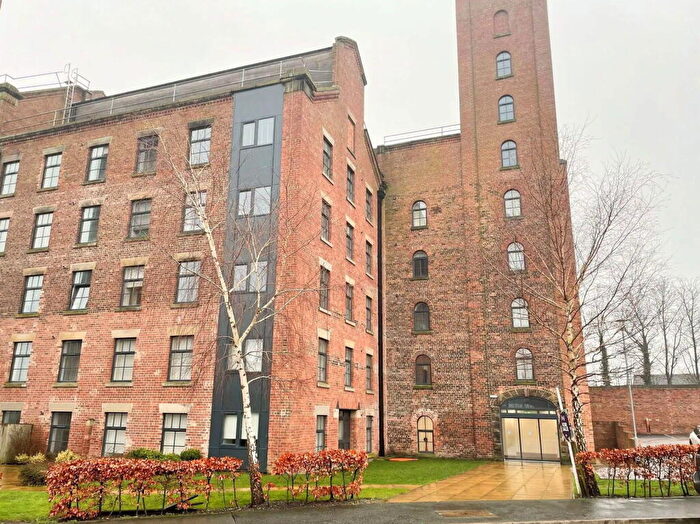
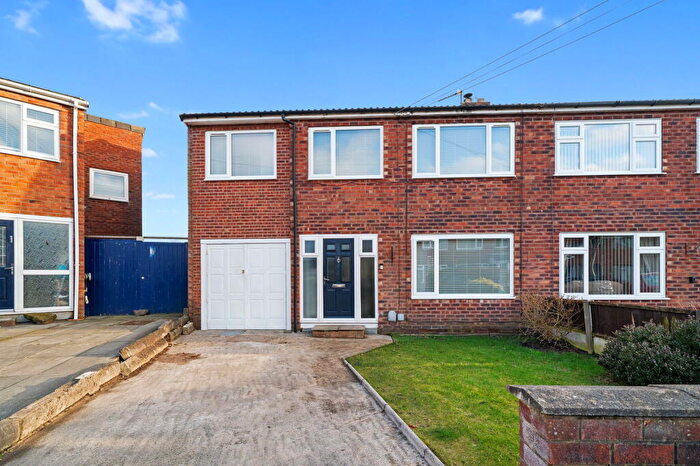
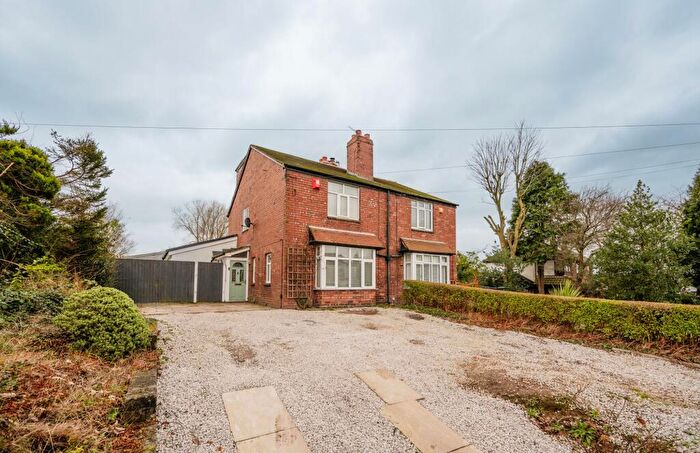
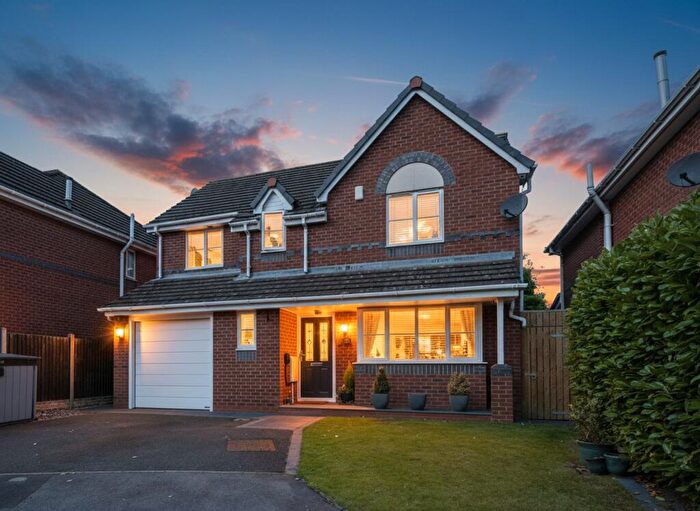
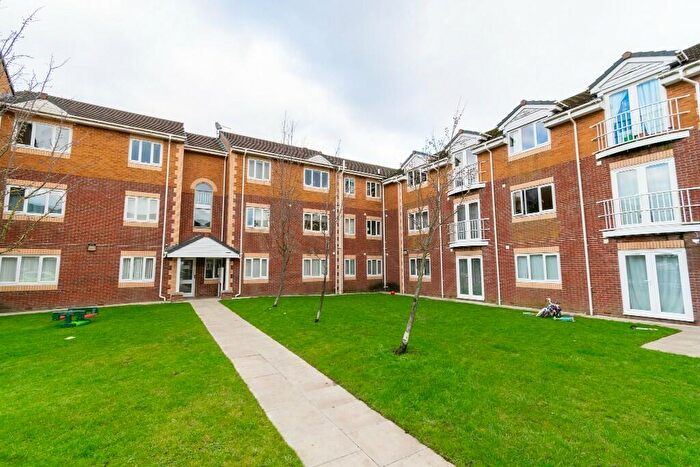
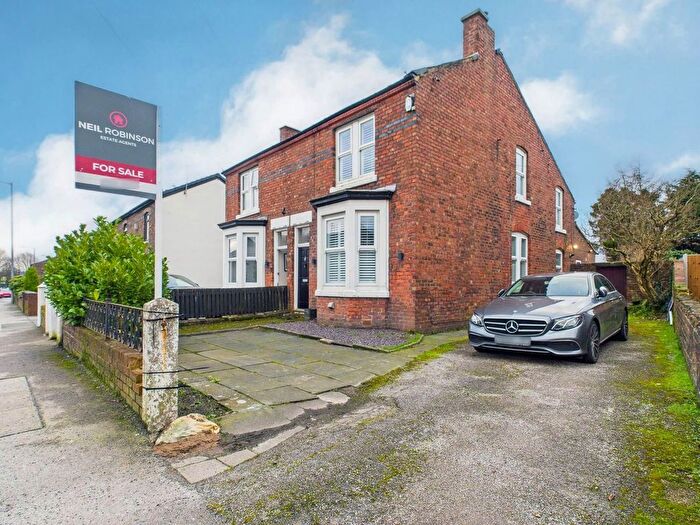
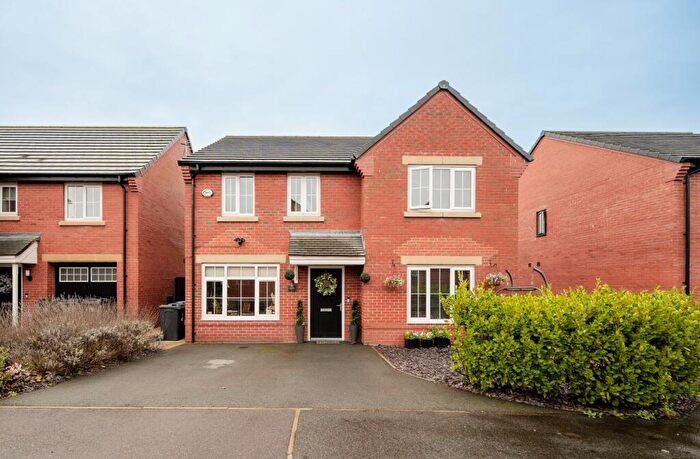
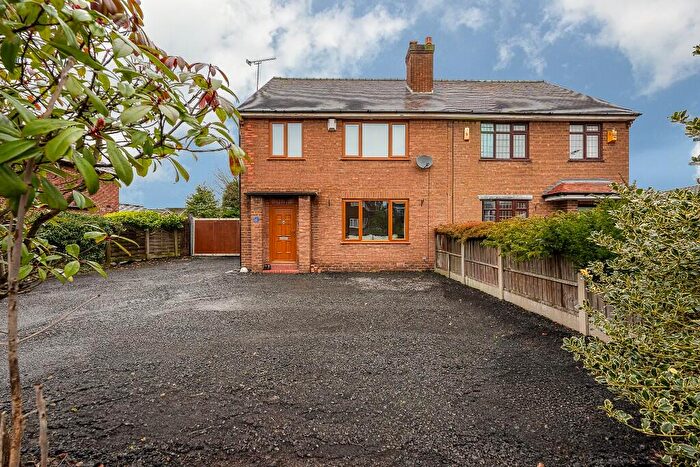
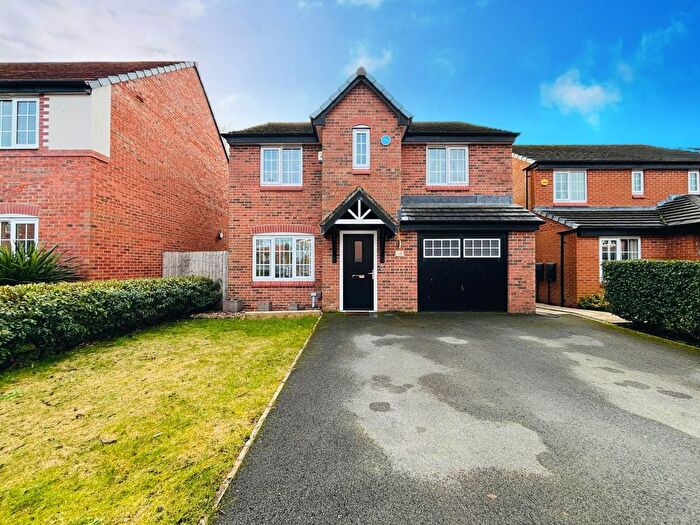
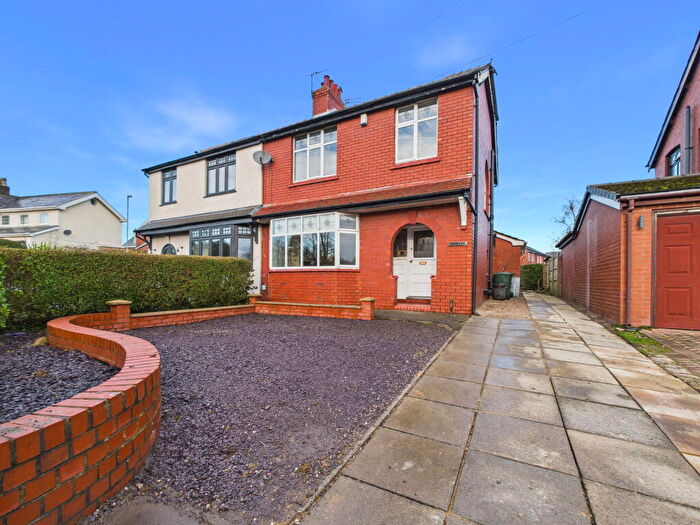
Houses for sale & to rent in Newburgh, Ormskirk
House Prices in Newburgh
Properties in Newburgh have an average house price of £360,074.00 and had 27 Property Transactions within the last 3 years¹.
Newburgh is an area in Ormskirk, Lancashire with 389 households², where the most expensive property was sold for £1,350,000.00.
Properties for sale in Newburgh
Roads and Postcodes in Newburgh
Navigate through our locations to find the location of your next house in Newburgh, Ormskirk for sale or to rent.
| Streets | Postcodes |
|---|---|
| Bleak Lane | L40 4BP |
| Blythe Lane | L40 5TY L40 5UA |
| Briars Brook | L40 5XD |
| Briars Lane | L40 5XE L40 5TH |
| Carr Lane | L40 4BT |
| Cranes Lane | L40 5UJ |
| Daisy Lane | L40 4BS |
| Deans Lane | L40 4BL |
| Frog Lane | L40 4BJ |
| Hall Lane | L40 5UE L40 5UG L40 5UN L40 5UQ L40 5UW L40 6JB |
| Hobcross Lane | L40 5UB |
| Holland Business Park | L40 6LN |
| Hollowford Lane | L40 4BH |
| Hoscar Moss Road | L40 4BG L40 4BQ |
| Lady Alices Drive | L40 5UD |
| Lathom Park | L40 5UP |
| Lowry Hill Lane | L40 5UL |
| Meadow Lane | L40 4BR |
| Moss Bridge Lane | L40 4BE |
| Pear Tree Mews | L40 5WD |
| Pilkington Technology Centre | L40 5UF |
| Ring O Bells Lane | L40 5TE L40 5TF |
| Sandy Lane | L40 5TU |
| Spa Fold | L40 6LH |
| Spa Lane | L40 6JG |
| Sutch Lane | L40 4BU |
| Three Oaks Close | L40 5UR |
| Wanes Blades Road | L40 4BN |
| Wheat Lane | L40 4BX |
| Wood Lane | L40 4BW |
Transport near Newburgh
-
Hoscar Station
-
Burscough Junction Station
-
Burscough Bridge Station
-
Parbold Station
-
New Lane Station
-
Ormskirk Station
- FAQ
- Price Paid By Year
- Property Type Price
Frequently asked questions about Newburgh
What is the average price for a property for sale in Newburgh?
The average price for a property for sale in Newburgh is £360,074. This amount is 14% higher than the average price in Ormskirk. There are 1,428 property listings for sale in Newburgh.
What streets have the most expensive properties for sale in Newburgh?
The streets with the most expensive properties for sale in Newburgh are Sandy Lane at an average of £900,000, Spa Lane at an average of £548,750 and Lathom Park at an average of £515,500.
What streets have the most affordable properties for sale in Newburgh?
The streets with the most affordable properties for sale in Newburgh are Moss Bridge Lane at an average of £180,000, Deans Lane at an average of £201,000 and Ring O Bells Lane at an average of £223,750.
Which train stations are available in or near Newburgh?
Some of the train stations available in or near Newburgh are Hoscar, Burscough Junction and Burscough Bridge.
Property Price Paid in Newburgh by Year
The average sold property price by year was:
| Year | Average Sold Price | Price Change |
Sold Properties
|
|---|---|---|---|
| 2025 | £335,500 | -44% |
10 Properties |
| 2024 | £482,812 | 42% |
8 Properties |
| 2023 | £278,277 | -24% |
9 Properties |
| 2022 | £344,645 | 10% |
10 Properties |
| 2021 | £309,614 | -24% |
12 Properties |
| 2020 | £384,727 | -2% |
11 Properties |
| 2019 | £390,714 | 13% |
7 Properties |
| 2018 | £340,902 | 36% |
21 Properties |
| 2017 | £217,923 | -33% |
13 Properties |
| 2016 | £288,833 | -5% |
6 Properties |
| 2015 | £303,750 | 23% |
16 Properties |
| 2014 | £232,466 | -3% |
15 Properties |
| 2013 | £238,409 | -25% |
11 Properties |
| 2012 | £298,500 | -7% |
7 Properties |
| 2011 | £319,055 | 28% |
9 Properties |
| 2010 | £229,400 | -9% |
5 Properties |
| 2009 | £249,625 | -42% |
8 Properties |
| 2008 | £355,707 | -2% |
7 Properties |
| 2007 | £363,007 | 15% |
17 Properties |
| 2006 | £308,327 | 4% |
9 Properties |
| 2005 | £297,142 | 7% |
7 Properties |
| 2004 | £277,637 | 33% |
17 Properties |
| 2003 | £186,080 | 6% |
18 Properties |
| 2002 | £174,273 | 6% |
19 Properties |
| 2001 | £163,445 | 28% |
10 Properties |
| 2000 | £118,187 | 24% |
8 Properties |
| 1999 | £90,067 | -9% |
14 Properties |
| 1998 | £97,796 | -22% |
13 Properties |
| 1997 | £119,324 | 33% |
11 Properties |
| 1996 | £80,486 | 2% |
15 Properties |
| 1995 | £78,611 | - |
9 Properties |
Property Price per Property Type in Newburgh
Here you can find historic sold price data in order to help with your property search.
The average Property Paid Price for specific property types in the last three years are:
| Property Type | Average Sold Price | Sold Properties |
|---|---|---|
| Semi Detached House | £260,642.00 | 7 Semi Detached Houses |
| Detached House | £609,062.00 | 8 Detached Houses |
| Terraced House | £243,333.00 | 9 Terraced Houses |
| Flat | £278,333.00 | 3 Flats |

