Houses for sale & to rent in Singleton And Greenhalgh, Poulton-le-fylde
House Prices in Singleton And Greenhalgh
Properties in Singleton And Greenhalgh have an average house price of £452,985.00 and had 38 Property Transactions within the last 3 years¹.
Singleton And Greenhalgh is an area in Poulton-le-fylde, Lancashire with 378 households², where the most expensive property was sold for £1,000,000.00.
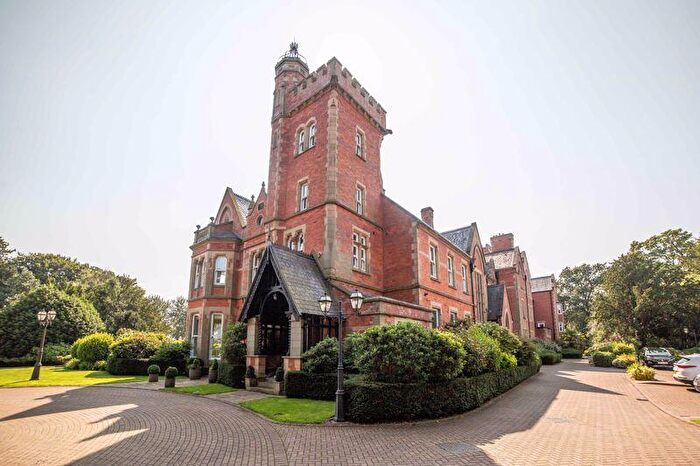
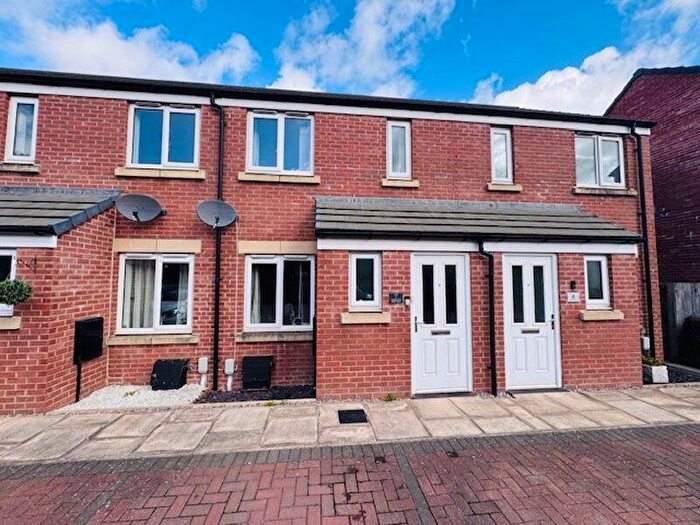
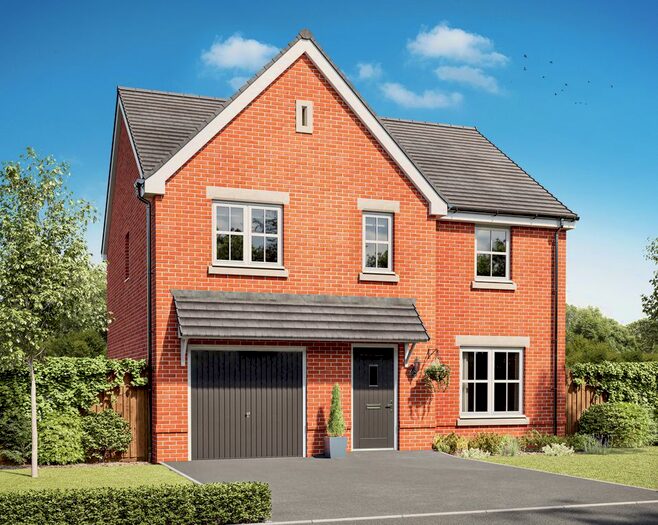
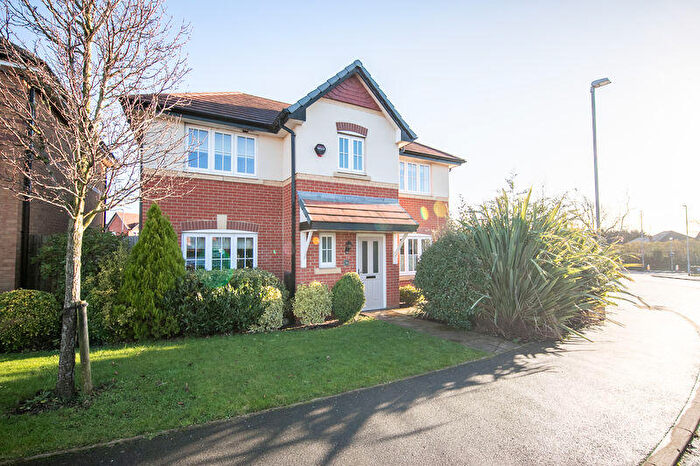
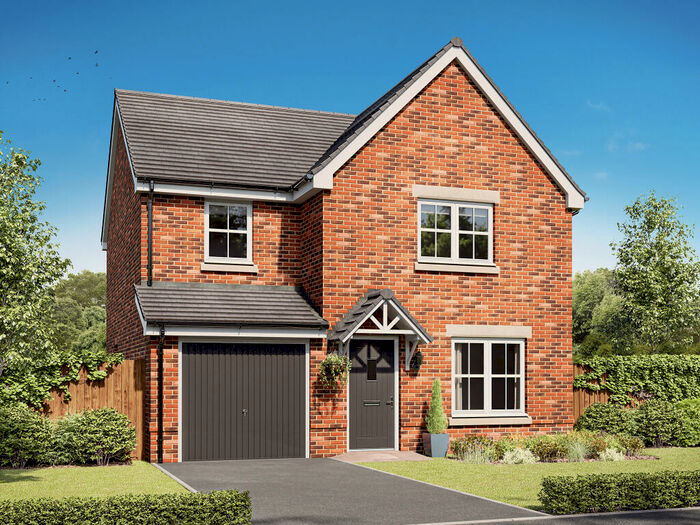
Properties for sale in Singleton And Greenhalgh
Roads and Postcodes in Singleton And Greenhalgh
Navigate through our locations to find the location of your next house in Singleton And Greenhalgh, Poulton-le-fylde for sale or to rent.
| Streets | Postcodes |
|---|---|
| Barnfield Manor | FY6 8LJ |
| Church Road | FY6 8LN |
| Garstang New Road | FY6 8NR |
| Garstang Road | FY6 8LX |
| Garstang Road East | FY6 7SX |
| Grange Road | FY6 8LP |
| Honeypot Lane | FY6 8JZ |
| Larbreck Road | FY6 8NF |
| Lodge Lane | FY6 8LS FY6 8LT |
| Mains Lane | FY6 7LB FY6 7LD FY6 7LF FY6 7LJ FY6 7LE |
| Mile Road | FY6 8NG |
| Miller Crescent | FY6 8LW |
| Occupation Lane | FY6 7LQ |
| Old Mains Lane | FY6 7LA |
| Poolfoot Lane | FY6 8LY FY6 8LZ |
| Riverside Chalet Park | FY6 7RA |
| Shard Road | FY6 9BU |
| Station Road | FY6 8LG FY6 8LQ FY6 8NL |
| The Village | FY6 8LL |
| Weeton Road | FY6 8NQ |
| Windy Harbour Road | FY6 8NB |
| Wyre Chalet Park | FY6 7LH |
| Wyre Grange | FY6 8NP |
Transport near Singleton And Greenhalgh
- FAQ
- Price Paid By Year
- Property Type Price
Frequently asked questions about Singleton And Greenhalgh
What is the average price for a property for sale in Singleton And Greenhalgh?
The average price for a property for sale in Singleton And Greenhalgh is £452,985. This amount is 91% higher than the average price in Poulton-le-fylde. There are 464 property listings for sale in Singleton And Greenhalgh.
What streets have the most expensive properties for sale in Singleton And Greenhalgh?
The streets with the most expensive properties for sale in Singleton And Greenhalgh are Weeton Road at an average of £507,500, Garstang Road East at an average of £506,248 and Mains Lane at an average of £501,650.
What streets have the most affordable properties for sale in Singleton And Greenhalgh?
The streets with the most affordable properties for sale in Singleton And Greenhalgh are Garstang Road at an average of £243,500, Occupation Lane at an average of £255,666 and Barnfield Manor at an average of £494,895.
Which train stations are available in or near Singleton And Greenhalgh?
Some of the train stations available in or near Singleton And Greenhalgh are Poulton-Le-Fylde, Layton and Blackpool North.
Property Price Paid in Singleton And Greenhalgh by Year
The average sold property price by year was:
| Year | Average Sold Price | Price Change |
Sold Properties
|
|---|---|---|---|
| 2025 | £650,000 | 29% |
3 Properties |
| 2024 | £462,485 | 18% |
7 Properties |
| 2023 | £377,730 | -26% |
13 Properties |
| 2022 | £474,369 | 13% |
15 Properties |
| 2021 | £410,519 | -7% |
19 Properties |
| 2020 | £437,852 | 20% |
17 Properties |
| 2019 | £350,470 | -3% |
17 Properties |
| 2018 | £362,100 | 2% |
15 Properties |
| 2017 | £353,555 | -1% |
9 Properties |
| 2016 | £355,800 | 23% |
10 Properties |
| 2015 | £274,438 | -81% |
5 Properties |
| 2014 | £497,500 | 17% |
4 Properties |
| 2013 | £414,362 | -2% |
4 Properties |
| 2012 | £424,500 | 17% |
6 Properties |
| 2011 | £353,388 | 34% |
9 Properties |
| 2010 | £231,590 | -45% |
5 Properties |
| 2009 | £334,672 | -16% |
11 Properties |
| 2008 | £387,375 | -1% |
8 Properties |
| 2007 | £389,538 | -9% |
11 Properties |
| 2006 | £425,524 | 25% |
20 Properties |
| 2005 | £317,479 | 5% |
12 Properties |
| 2004 | £300,658 | 15% |
6 Properties |
| 2003 | £255,444 | 30% |
18 Properties |
| 2002 | £180,017 | 27% |
15 Properties |
| 2001 | £131,105 | -20% |
9 Properties |
| 2000 | £156,954 | 14% |
12 Properties |
| 1999 | £135,500 | -18% |
9 Properties |
| 1998 | £160,250 | 10% |
13 Properties |
| 1997 | £144,104 | -7% |
12 Properties |
| 1996 | £154,490 | 42% |
10 Properties |
| 1995 | £89,093 | - |
8 Properties |
Property Price per Property Type in Singleton And Greenhalgh
Here you can find historic sold price data in order to help with your property search.
The average Property Paid Price for specific property types in the last three years are:
| Property Type | Average Sold Price | Sold Properties |
|---|---|---|
| Semi Detached House | £284,300.00 | 10 Semi Detached Houses |
| Flat | £307,142.00 | 7 Flats |
| Terraced House | £394,947.00 | 2 Terraced Houses |
| Detached House | £601,607.00 | 19 Detached Houses |

