
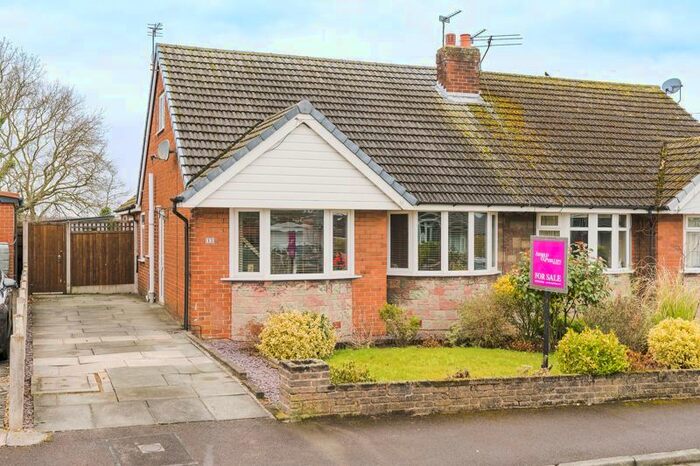
Houses for sale & to rent in WN8 7NA, Ranleigh Drive, Newburgh, Wigan
House Prices in WN8 7NA, Ranleigh Drive, Newburgh
Properties in WN8 7NA have no sales history available within the last 3 years. WN8 7NA is a postcode in Ranleigh Drive located in Newburgh, an area in Wigan, Lancashire, with 9 households².
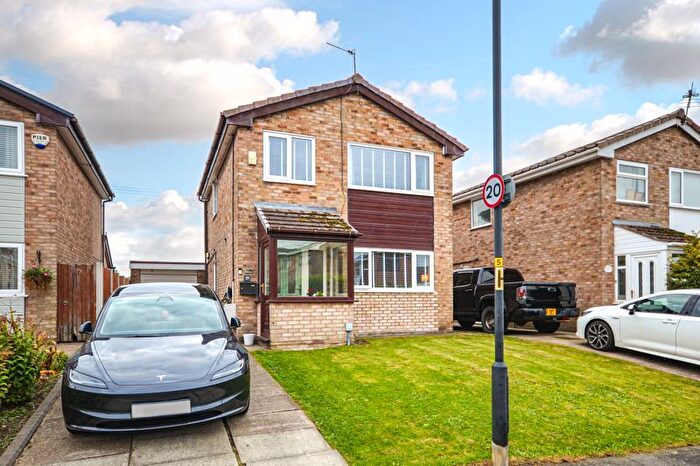
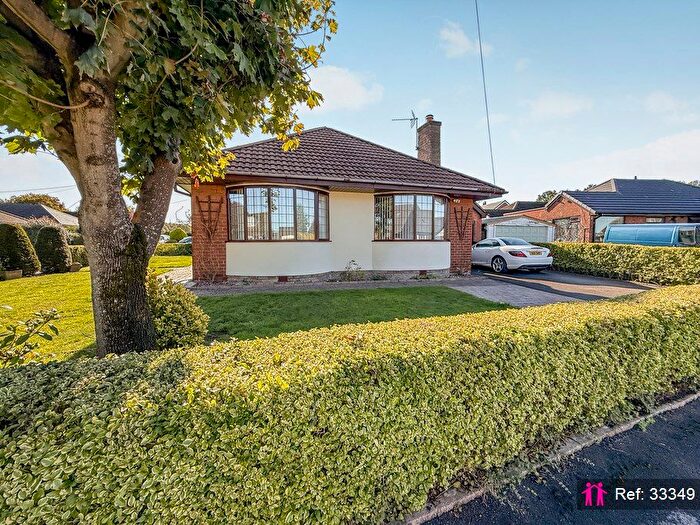
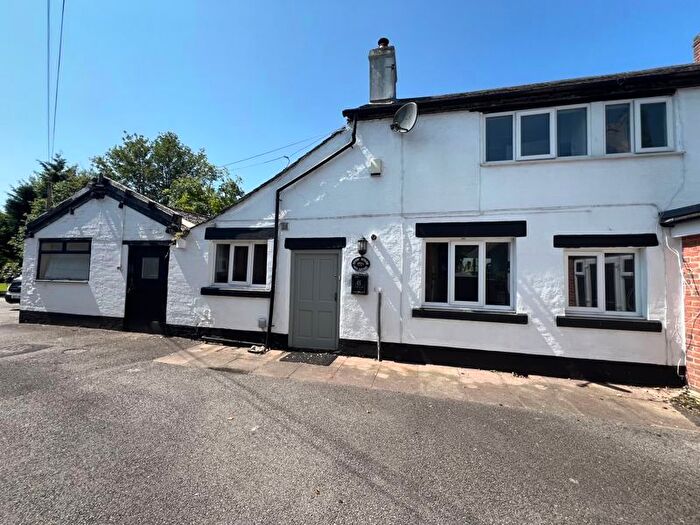
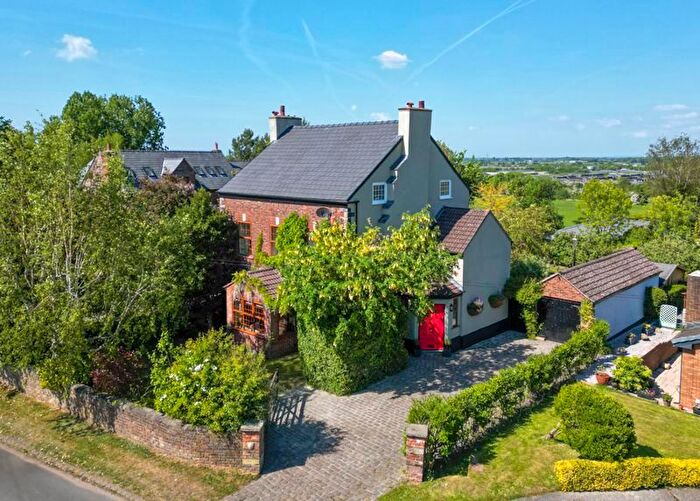
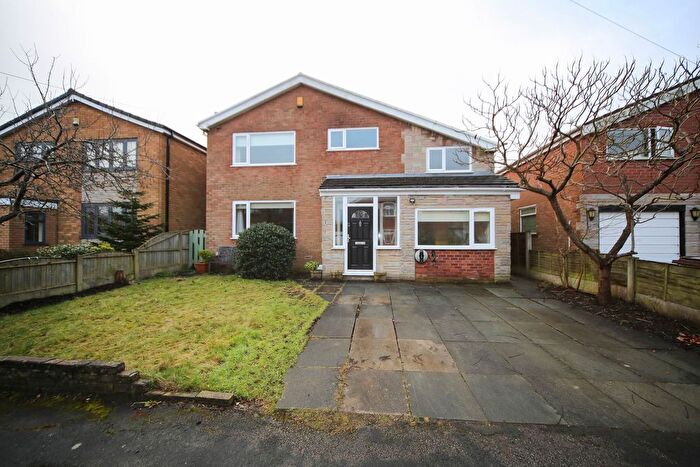
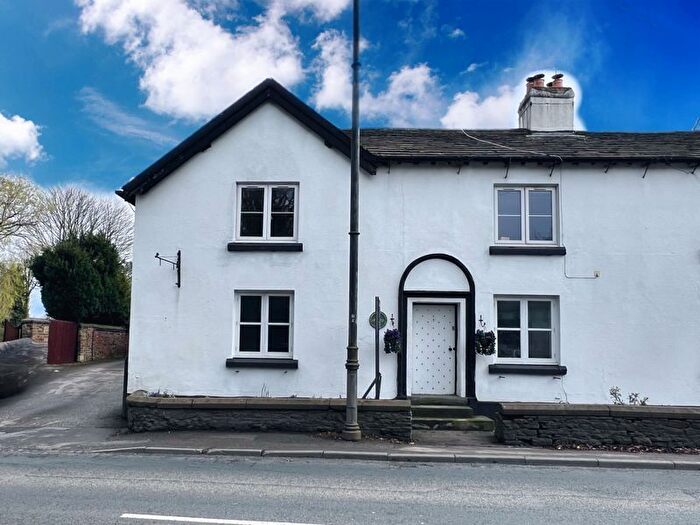
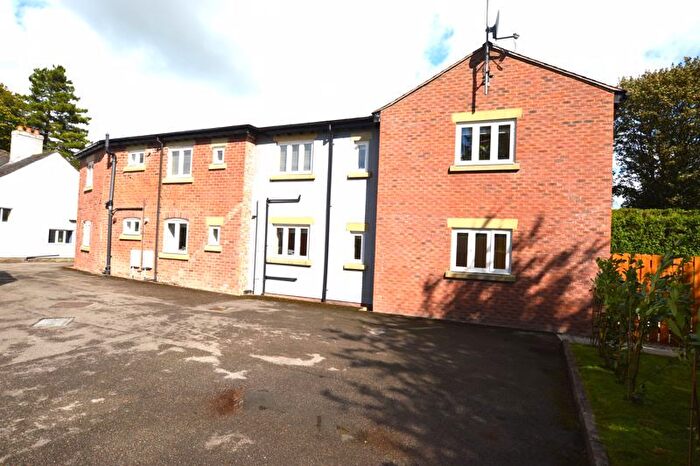
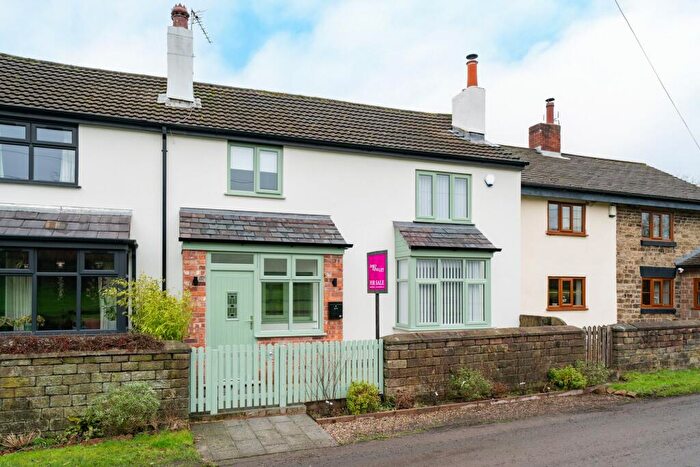
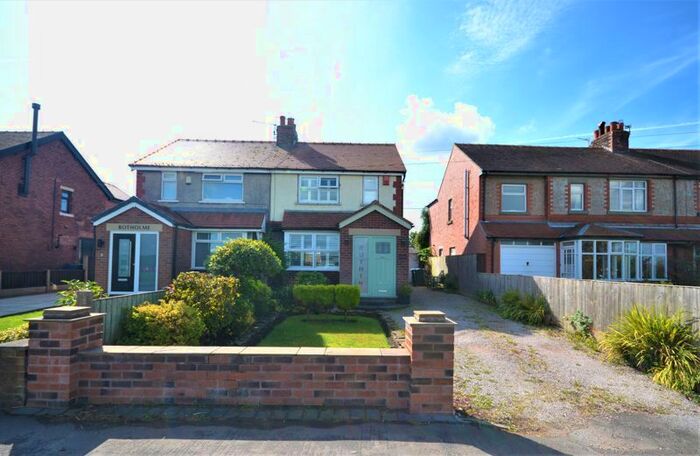
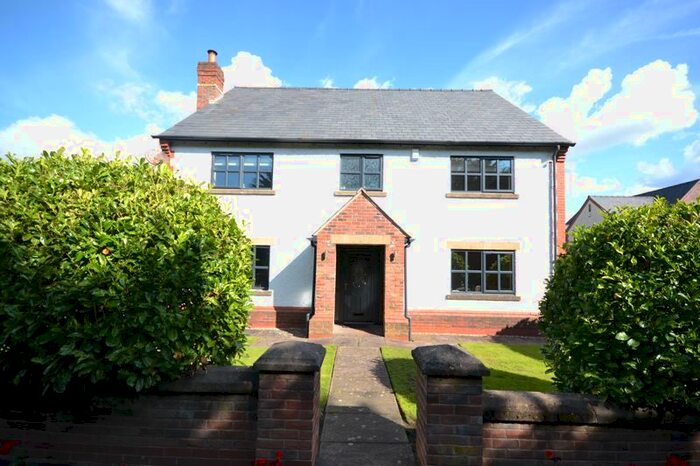
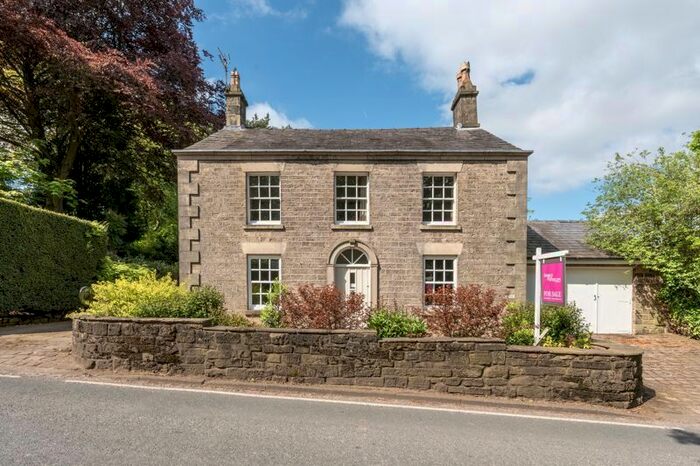
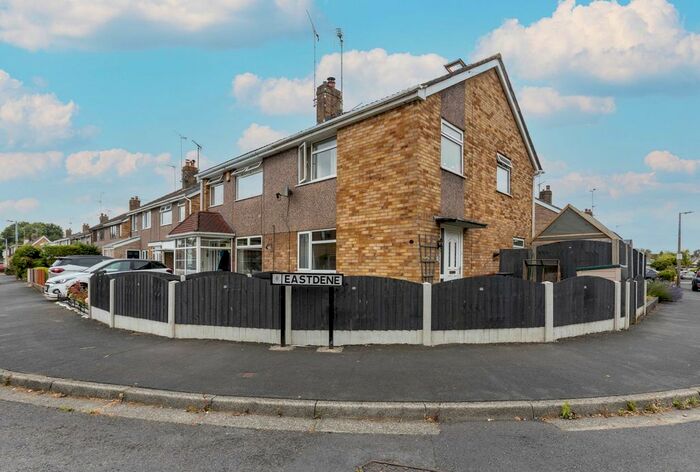
Previously listed properties near WN8 7NA, Ranleigh Drive
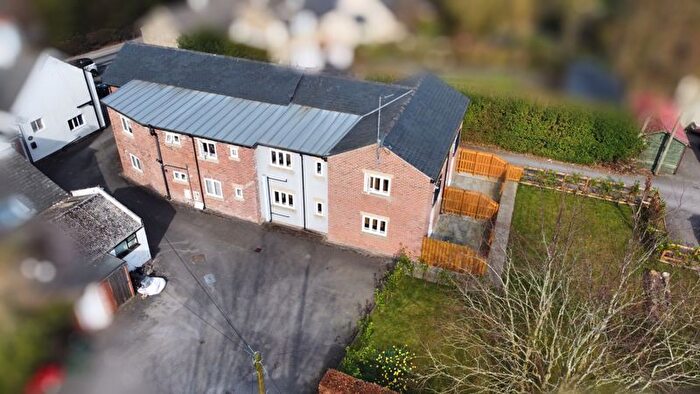
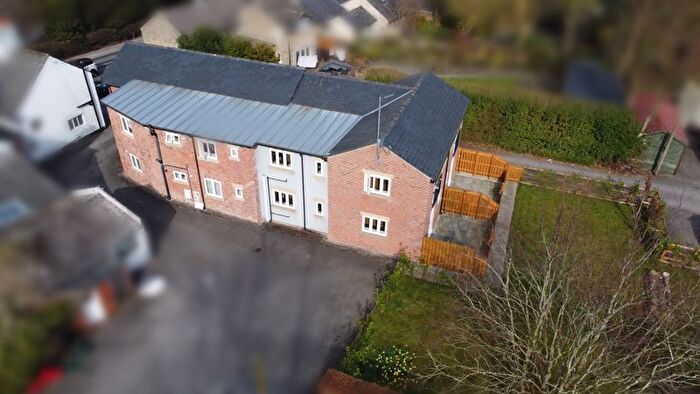
![]()
If you are looking to sell your house, let it out, or receive a property valuation, an expert can help you.
Click the button below to get started.


Price Paid in Ranleigh Drive, WN8 7NA, Newburgh
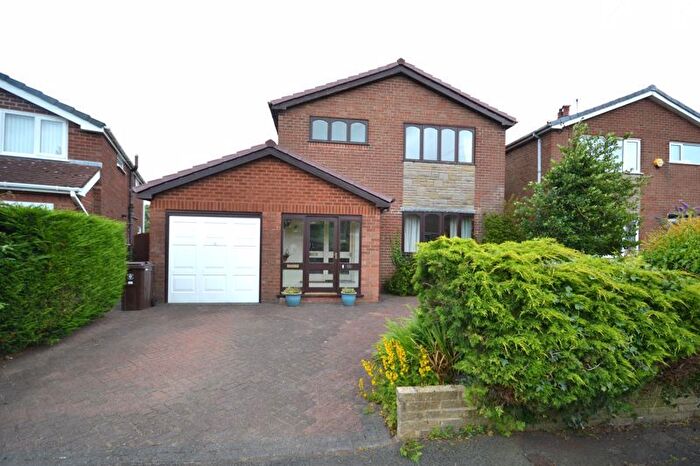
10 Ranleigh Drive, WN8 7NA, Newburgh Wigan
Property 10 has been sold 2 times. The last time it was sold was in 24/02/2020 and the sold price was £315,000.00.
This detached house, sold as a freehold on 24/02/2020, is a 93 sqm detached bungalow with an EPC rating of D.
| Date | Price | Property Type | Tenure | Classification |
|---|---|---|---|---|
| 24/02/2020 | £315,000.00 | Detached House | freehold | Established Building |
| 08/02/2013 | £180,000.00 | Detached House | freehold | Established Building |
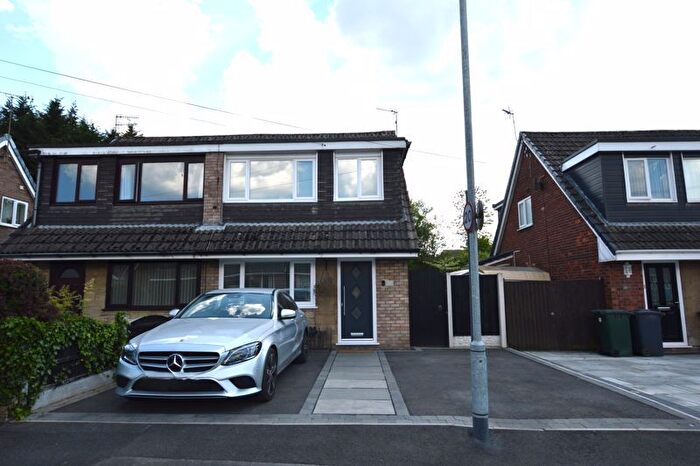
8 Ranleigh Drive, WN8 7NA, Newburgh Wigan
Property 8 has been sold 1 time. The last time it was sold was in 26/11/2018 and the sold price was £250,000.00.
This detached house, sold as a leasehold on 26/11/2018, is a 75 sqm detached bungalow with an EPC rating of D.
| Date | Price | Property Type | Tenure | Classification |
|---|---|---|---|---|
| 26/11/2018 | £250,000.00 | Detached House | leasehold | Established Building |
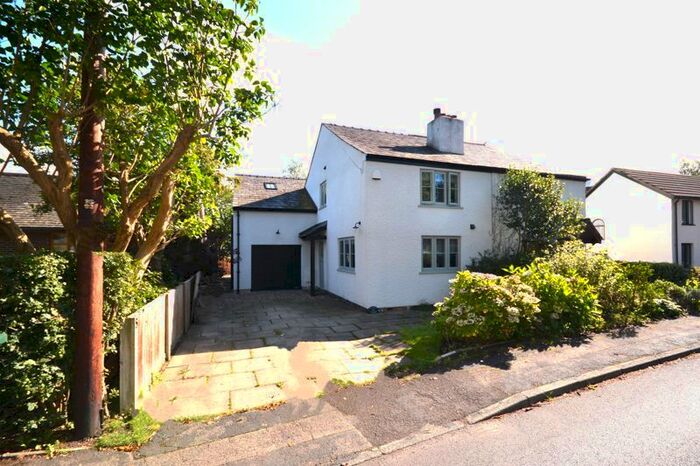
6 Ranleigh Drive, WN8 7NA, Newburgh Wigan
Property 6 has been sold 2 times. The last time it was sold was in 15/11/2017 and the sold price was £270,000.00.
This detached house, sold as a leasehold on 15/11/2017, is a 93 sqm detached bungalow with an EPC rating of D.
| Date | Price | Property Type | Tenure | Classification |
|---|---|---|---|---|
| 15/11/2017 | £270,000.00 | Detached House | leasehold | Established Building |
| 15/12/2011 | £240,000.00 | Detached House | leasehold | Established Building |
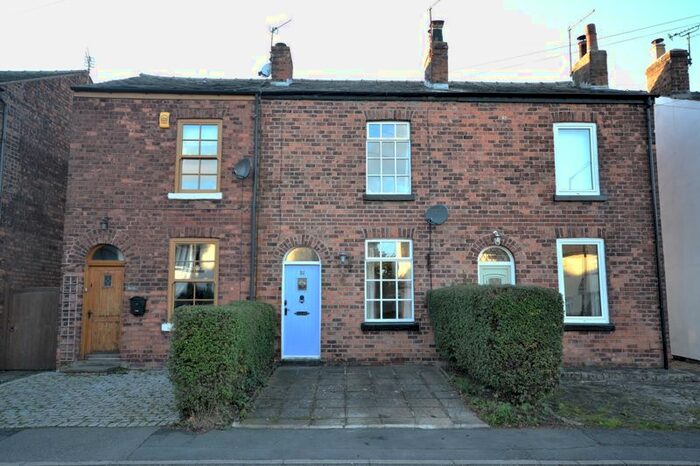
5 Ranleigh Drive, WN8 7NA, Newburgh Wigan
Property 5 has been sold 3 times. The last time it was sold was in 30/03/2017 and the sold price was £235,000.00.
This semi detached house, sold as a freehold on 30/03/2017, is a 75 sqm semi-detached bungalow with an EPC rating of C.
| Date | Price | Property Type | Tenure | Classification |
|---|---|---|---|---|
| 30/03/2017 | £235,000.00 | Semi Detached House | freehold | Established Building |
| 26/07/2010 | £170,000.00 | Semi Detached House | freehold | Established Building |
| 10/03/2006 | £165,000.00 | Semi Detached House | freehold | Established Building |
2 Ranleigh Drive, WN8 7NA, Newburgh Wigan
Property 2 has been sold 2 times. The last time it was sold was in 24/03/2006 and the sold price was £185,000.00.
This is a Detached House which was sold as a leasehold in 24/03/2006
| Date | Price | Property Type | Tenure | Classification |
|---|---|---|---|---|
| 24/03/2006 | £185,000.00 | Detached House | leasehold | Established Building |
| 27/10/1995 | £80,000.00 | Detached House | leasehold | Established Building |
3 Ranleigh Drive, WN8 7NA, Newburgh Wigan
Property 3 has been sold 1 time. The last time it was sold was in 05/08/2002 and the sold price was £114,950.00.
This is a Semi Detached House which was sold as a freehold in 05/08/2002
| Date | Price | Property Type | Tenure | Classification |
|---|---|---|---|---|
| 05/08/2002 | £114,950.00 | Semi Detached House | freehold | Established Building |
4 Ranleigh Drive, WN8 7NA, Newburgh Wigan
Property 4 has been sold 1 time. The last time it was sold was in 13/07/1998 and the sold price was £69,500.00.
This is a Detached House which was sold as a freehold in 13/07/1998
| Date | Price | Property Type | Tenure | Classification |
|---|---|---|---|---|
| 13/07/1998 | £69,500.00 | Detached House | freehold | Established Building |
Transport near WN8 7NA, Ranleigh Drive
-
 Parbold Station
 -
Hoscar Station
-
Burscough Junction Station
-
Appley Bridge Station
-
Burscough Bridge Station
House price paid reports for WN8 7NA, Ranleigh Drive
Click on the buttons below to see price paid reports by year or property price:
- Price Paid By Year
Property Price Paid in WN8 7NA, Ranleigh Drive by Year
The average sold property price by year was:
| Year | Average Sold Price | Price Change |
Sold Properties
|
|---|---|---|---|
| 2020 | £315,000 | 21% |
1 Property |
| 2018 | £250,000 | -1% |
1 Property |
| 2017 | £252,500 | 29% |
2 Properties |
| 2013 | £180,000 | -33% |
1 Property |
| 2011 | £240,000 | 29% |
1 Property |
| 2010 | £170,000 | -3% |
1 Property |
| 2006 | £175,000 | 34% |
2 Properties |
| 2002 | £114,950 | 40% |
1 Property |
| 1998 | £69,500 | -15% |
1 Property |
| 1995 | £80,000 | - |
1 Property |