Houses for sale & to rent in Belgrave, Leicester
House Prices in Belgrave
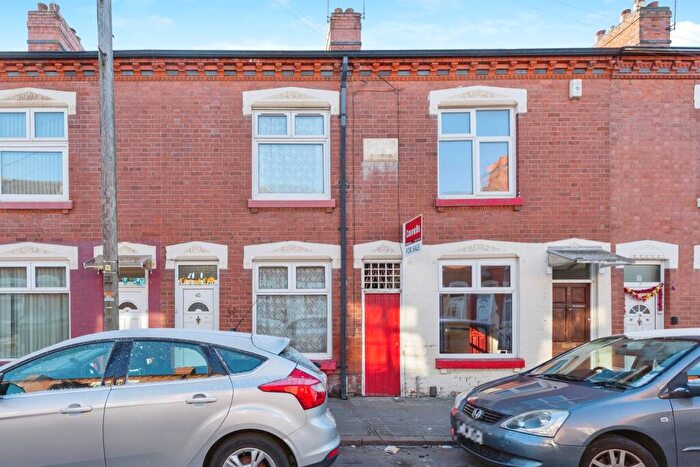
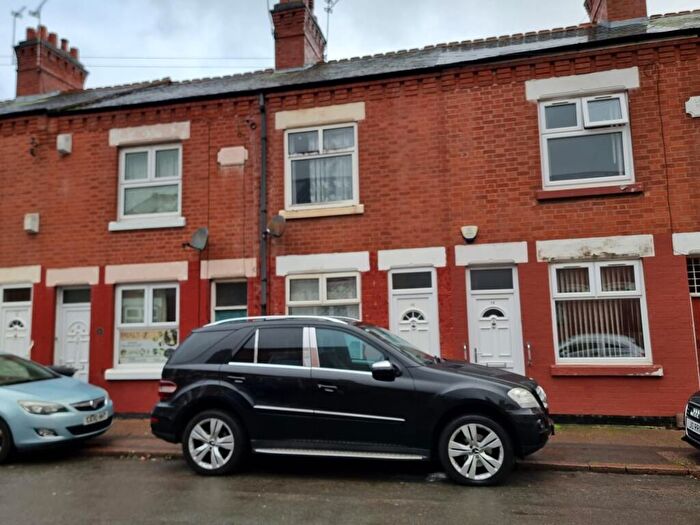
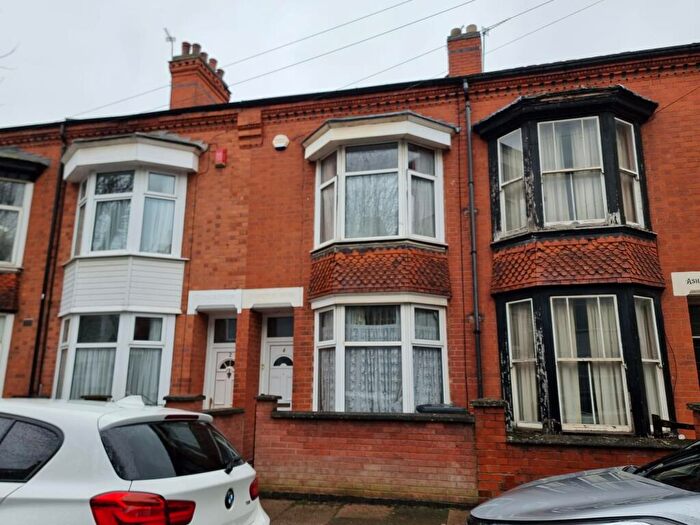
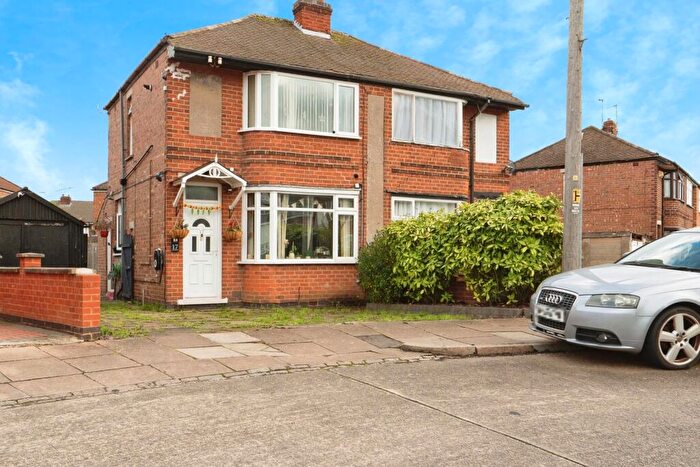
Properties in Belgrave have an average house price of £254,712.00 and had 207 Property Transactions within the last 3 years¹.
Belgrave is an area in Leicester, City of Leicester with 3,579 households², where the most expensive property was sold for £875,000.00.
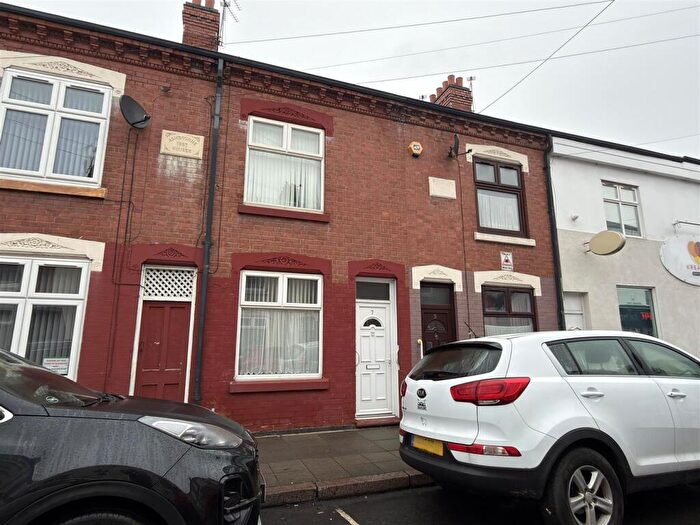
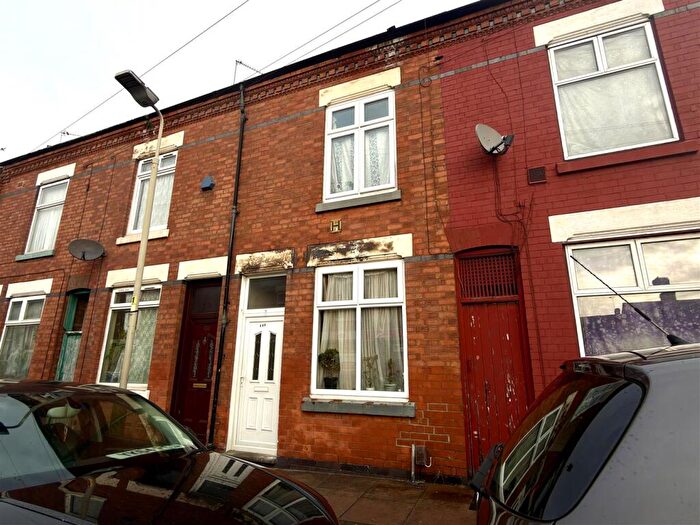
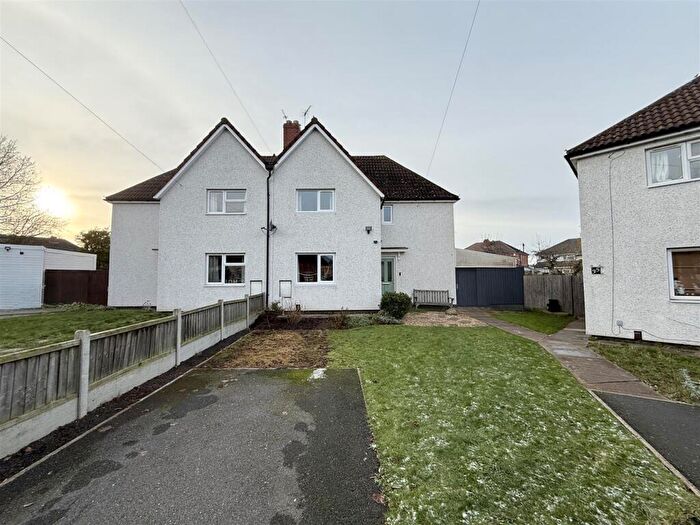
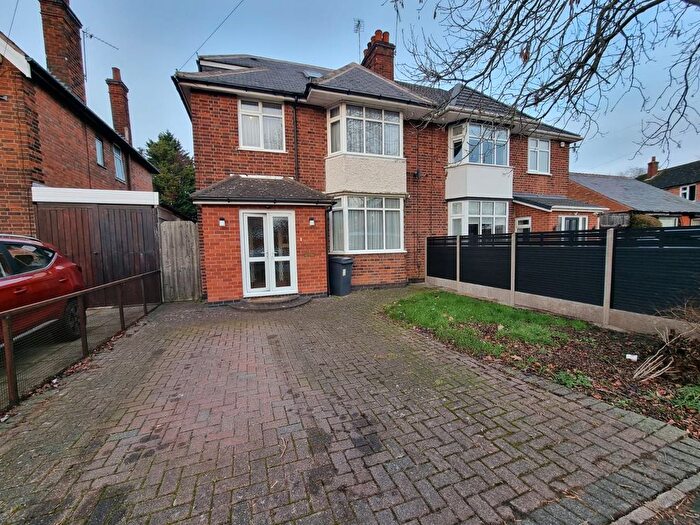
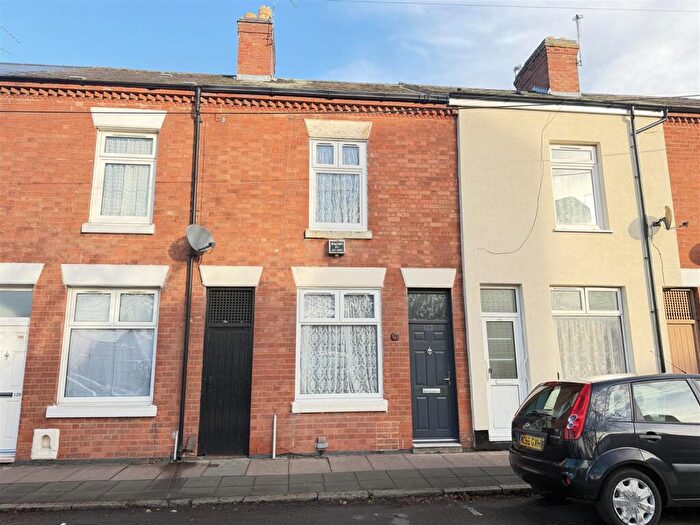
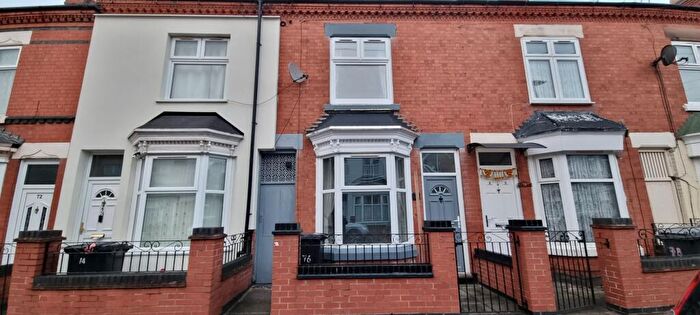
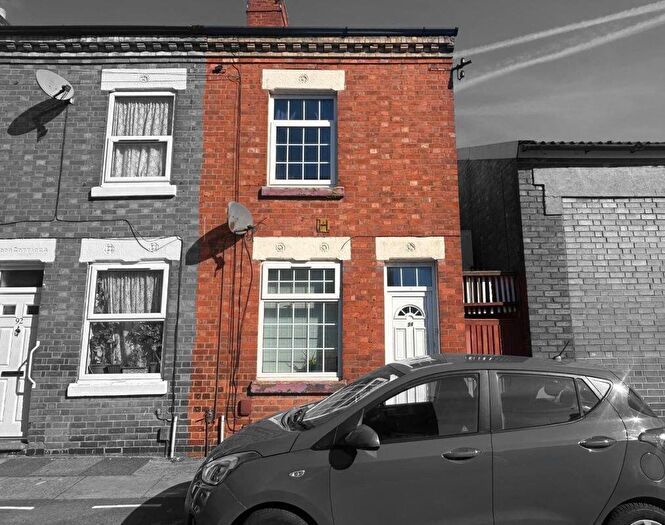
Properties for sale in Belgrave
Roads and Postcodes in Belgrave
Navigate through our locations to find the location of your next house in Belgrave, Leicester for sale or to rent.
| Streets | Postcodes |
|---|---|
| Acorn Street | LE4 6NA LE4 6NB |
| Agar Street | LE4 6ND LE4 6NE |
| Arbour Road | LE4 6QA LE4 6QB |
| Ascot Road | LE4 5DA |
| Bath Street | LE4 7QD |
| Belgrave Avenue | LE4 5PA LE4 5PB |
| Bellholme Close | LE4 7QR |
| Berridge Lane | LE4 7QB |
| Broadhurst Street | LE4 6NF |
| Cameron Avenue | LE4 7QL |
| Canon Street | LE4 6GH LE4 6NG LE4 6NL |
| Catherine Street | LE4 6GD LE4 6GE LE4 6GG |
| Checketts Close | LE4 5EU |
| Checketts Road | LE4 5EQ LE4 5ER LE4 5ES |
| Claremont Street | LE4 7QH |
| Clement Avenue | LE4 7QJ |
| Collin Place | LE4 6RA |
| Day Street | LE4 5PS |
| Elmdale Street | LE4 5JA LE4 5JB |
| Epsom Road | LE4 5DB |
| Flax Road | LE4 6QD LE4 6QE |
| Gipsy Lane | LE4 6RB LE4 6RD LE4 6RE LE4 6RF LE4 6RH |
| Gipsy Road | LE4 6QH LE4 6QJ |
| Glen Street | LE4 6NN |
| Harrison Road | LE4 6NP LE4 6QL LE4 6QN LE4 7AB LE4 7AD |
| Herbert Avenue | LE4 5DW |
| Holden Street | LE4 5JF |
| Jeremy Close | LE4 5DX |
| Jermyn Street | LE4 6NR LE4 6NS |
| Lancashire Street | LE4 7AE LE4 7AF |
| Leire Street | LE4 6NT LE4 6NU |
| Lexham Street | LE4 5DD |
| Linford Street | LE4 7QY |
| Loughborough Road | LE4 5LF LE4 5LH LE4 5LJ LE4 5LL LE4 5LN LE4 5LR LE4 5PH LE4 5PJ LE4 5PL |
| Marfitt Street | LE4 6RN LE4 6RP |
| Melton Road | LE4 5EA LE4 5EB LE4 5ED LE4 5EE LE4 6QS LE4 6QT LE4 7AN LE4 7PG |
| Moores Road | LE4 6QQ LE4 6QR |
| Mortoft Road | LE4 7QQ |
| Newington Street | LE4 5DG LE4 5DH |
| Newington Walk | LE4 5DN |
| Norbury Avenue | LE4 6NW |
| Northumberland Avenue | LE4 6RQ |
| Overing Close | LE4 7QS |
| Palmer Street | LE4 5PT |
| Payne Street | LE4 7RD |
| Penrith Road | LE4 6NX LE4 6NY |
| Portman Street | LE4 6NZ |
| Portsmouth Road | LE4 5DJ |
| Purley Road | LE4 6PA LE4 6PB |
| Quemby Close | LE4 5DE |
| Queniborough Road | LE4 6GT LE4 6GU LE4 6GW LE4 6GX |
| Ragdale Road | LE4 6GY |
| Ratcliffe Street | LE4 5DL |
| Rearsby Road | LE4 6GZ |
| Redcar Road | LE4 6PD LE4 6PE |
| Rotherby Avenue | LE4 6HA LE4 6HB |
| Royal Road | LE4 5DP |
| Scarborough Road | LE4 6PF LE4 6PG |
| Shaftesbury Avenue | LE4 5DQ LE4 5DR |
| Shetland Road | LE4 6RR LE4 6RS |
| Shirley Street | LE4 5JS LE4 5JT |
| St Bernards Avenue | LE4 5EW |
| St Michaels Avenue | LE4 7AG LE4 7AH |
| Stafford Street | LE4 7AJ LE4 7AL |
| Sutton Avenue | LE4 6RW |
| Thurcaston Road | LE4 5PG |
| Tiverton Avenue | LE4 6SE |
| Vann Walk | LE4 5JX |
| Vicarage Lane | LE4 5PD |
| Victoria Road North | LE4 5EX |
| Watson Road | LE4 6RY LE4 6RZ LE4 6SA |
| Westmorland Avenue | LE4 6SB |
| Windsor Avenue | LE4 5DT LE4 5DU |
| Wingfield Street | LE4 5DS |
| Yorkshire Road | LE4 6PH LE4 6PJ LE4 6PL |
Transport near Belgrave
-
Leicester Station
-
Syston Station
-
South Wigston Station
-
Sileby Station
-
Barrow-Upon-Soar Station
-
Narborough Station
-
Loughborough Station
- FAQ
- Price Paid By Year
- Property Type Price
Frequently asked questions about Belgrave
What is the average price for a property for sale in Belgrave?
The average price for a property for sale in Belgrave is £254,712. This amount is 6% higher than the average price in Leicester. There are 708 property listings for sale in Belgrave.
What streets have the most expensive properties for sale in Belgrave?
The streets with the most expensive properties for sale in Belgrave are Yorkshire Road at an average of £380,333, Newington Walk at an average of £350,000 and Thurcaston Road at an average of £344,250.
What streets have the most affordable properties for sale in Belgrave?
The streets with the most affordable properties for sale in Belgrave are Elmdale Street at an average of £176,000, Moores Road at an average of £194,500 and Harrison Road at an average of £202,625.
Which train stations are available in or near Belgrave?
Some of the train stations available in or near Belgrave are Leicester, Syston and South Wigston.
Property Price Paid in Belgrave by Year
The average sold property price by year was:
| Year | Average Sold Price | Price Change |
Sold Properties
|
|---|---|---|---|
| 2025 | £247,546 | -10% |
43 Properties |
| 2024 | £272,927 | 5% |
48 Properties |
| 2023 | £260,159 | 8% |
59 Properties |
| 2022 | £239,140 | 5% |
57 Properties |
| 2021 | £227,565 | 7% |
68 Properties |
| 2020 | £210,785 | 14% |
35 Properties |
| 2019 | £181,045 | -2% |
59 Properties |
| 2018 | £183,945 | 14% |
61 Properties |
| 2017 | £158,504 | 4% |
56 Properties |
| 2016 | £151,513 | 9% |
64 Properties |
| 2015 | £138,121 | 5% |
94 Properties |
| 2014 | £131,841 | 6% |
77 Properties |
| 2013 | £124,208 | 1% |
48 Properties |
| 2012 | £123,550 | 1% |
46 Properties |
| 2011 | £122,844 | -1% |
50 Properties |
| 2010 | £124,159 | 4% |
65 Properties |
| 2009 | £119,469 | -11% |
48 Properties |
| 2008 | £132,824 | 2% |
86 Properties |
| 2007 | £130,817 | 7% |
142 Properties |
| 2006 | £121,776 | 4% |
131 Properties |
| 2005 | £116,774 | 5% |
108 Properties |
| 2004 | £110,713 | 19% |
147 Properties |
| 2003 | £89,886 | 26% |
138 Properties |
| 2002 | £66,774 | 23% |
164 Properties |
| 2001 | £51,503 | 18% |
138 Properties |
| 2000 | £42,342 | 9% |
149 Properties |
| 1999 | £38,497 | -4% |
139 Properties |
| 1998 | £39,880 | 10% |
110 Properties |
| 1997 | £36,009 | -2% |
101 Properties |
| 1996 | £36,636 | 8% |
104 Properties |
| 1995 | £33,688 | - |
98 Properties |
Property Price per Property Type in Belgrave
Here you can find historic sold price data in order to help with your property search.
The average Property Paid Price for specific property types in the last three years are:
| Property Type | Average Sold Price | Sold Properties |
|---|---|---|
| Semi Detached House | £285,216.00 | 60 Semi Detached Houses |
| Terraced House | £252,242.00 | 132 Terraced Houses |
| Flat | £99,840.00 | 10 Flats |
| Detached House | £263,600.00 | 5 Detached Houses |

