
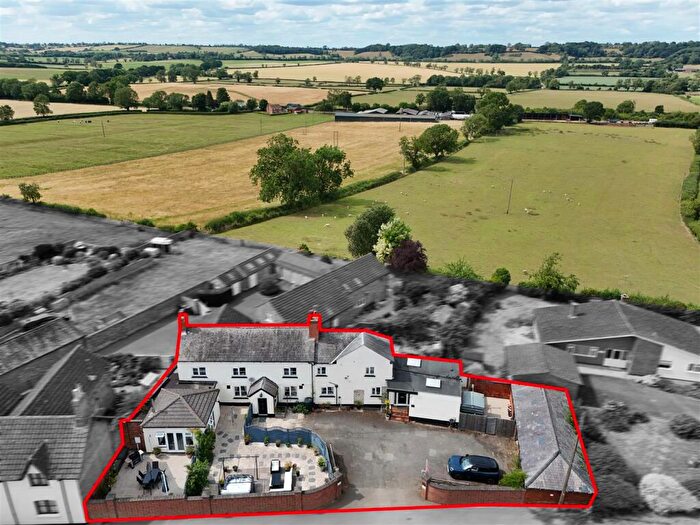
Houses for sale in Lubenham, Lutterworth
House Prices in Lubenham
Properties in Lubenham have an average house price of £459k and had 10 Property Transactions within the last 3 years¹.
Lubenham is an area in Lutterworth, Leicestershire with 145 households², where the most expensive property was sold for £1.48M.
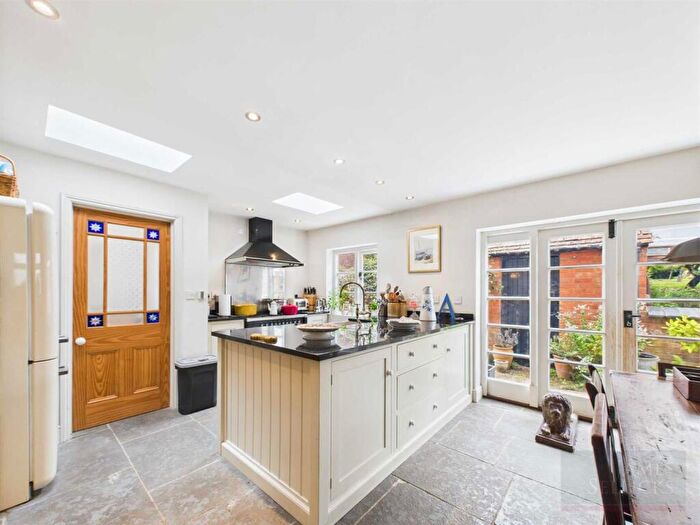
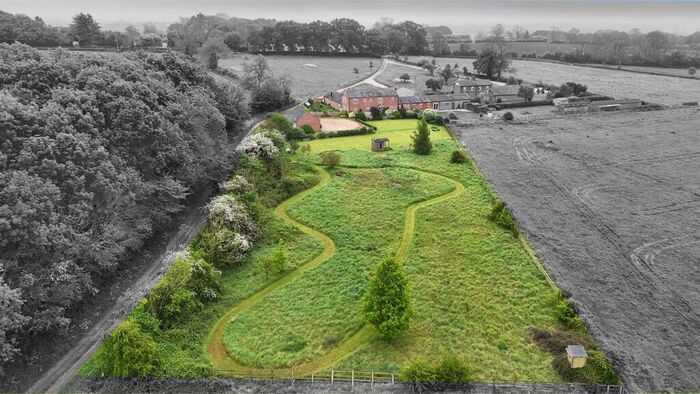
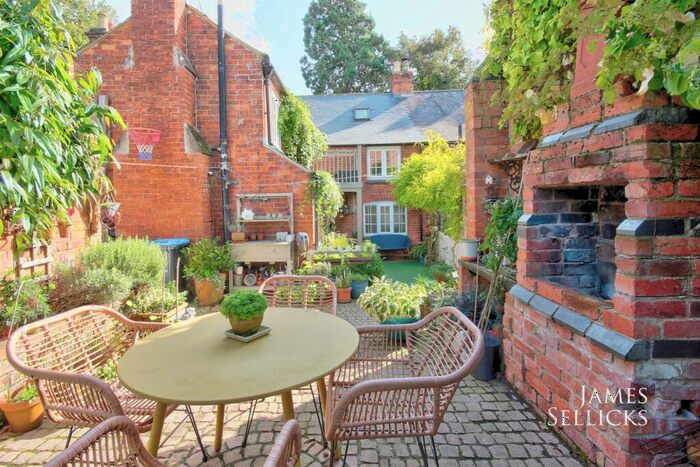
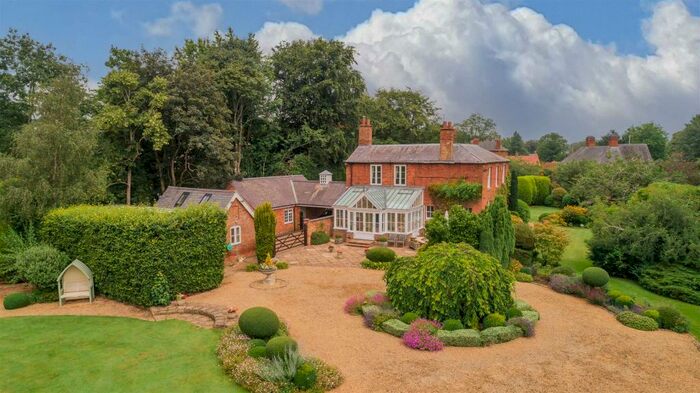
Properties for sale in Lubenham
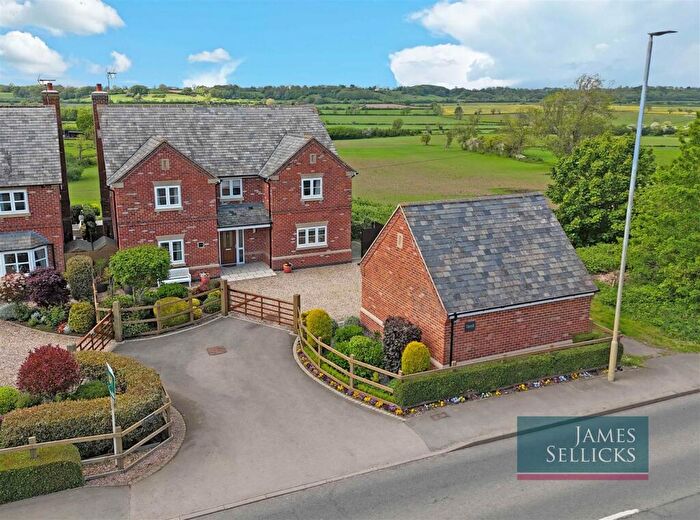
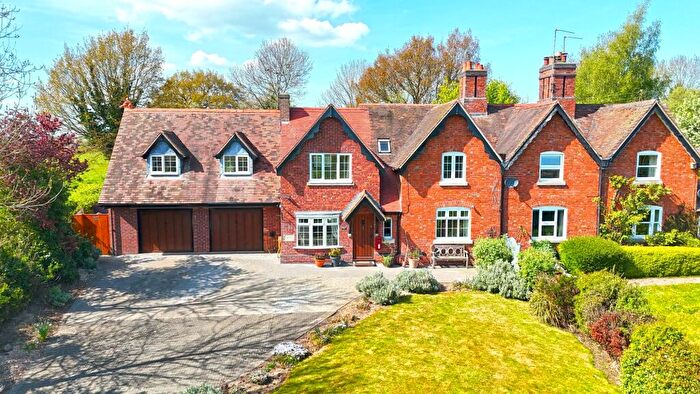
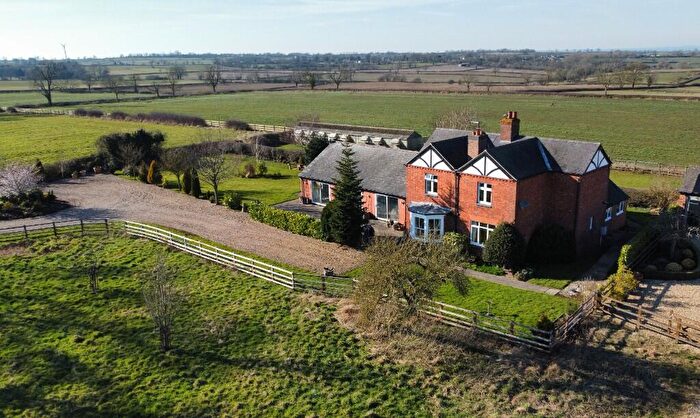
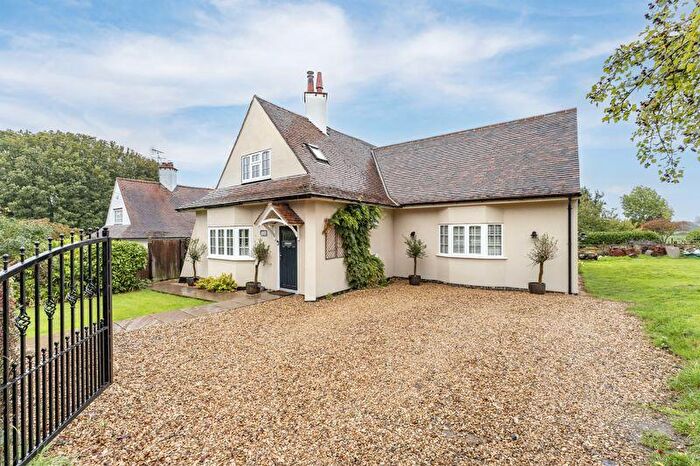
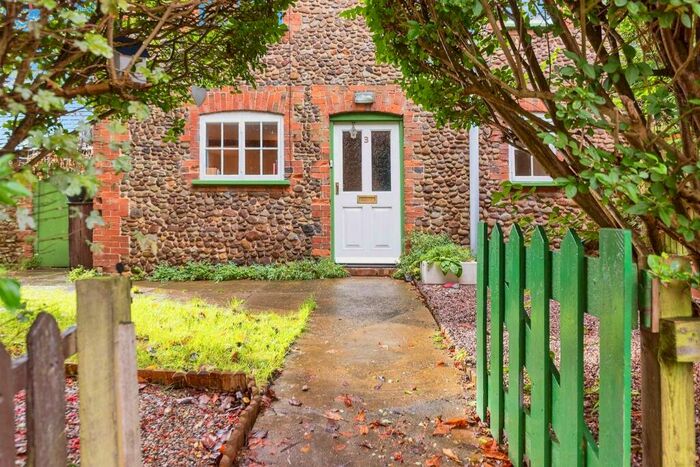
Previously listed properties in Lubenham
![]()
If you are looking to sell your house, let it out, or receive a property valuation, an expert can help you.
Click the button below to get started.
Roads and Postcodes in Lubenham
Navigate through our locations to find the location of your next house in Lubenham, Lutterworth for sale or to rent.
| Streets | Postcodes |
|---|---|
| Bosworth Road | LE17 6QN LE17 6QW |
| Follet Close | LE17 6QF |
| Gumley Road | LE17 6QB LE17 6QJ |
| Laughton Road | LE17 6QG |
| Lubenham Road | LE17 6QQ |
| Main Street | LE17 6QD LE17 6QP LE17 6QR LE17 6QY LE17 6QZ |
| Mowsley Road | LE17 6PY |
| Pebble Cottages | LE17 6QT |
| Station Road | LE17 6QS LE17 6QU |
| Taylors Lane | LE17 6FF |
| Toms Close | LE17 6QH |
| LE17 6NJ LE17 6QA LE17 6QE LE17 6QL |
Property price trends in Lubenham
According to the latest Land Registry data, the average home in Lubenham sold for £302,000 in 2025. That figure comes from 149 sales logged over the past 30 years.
Prices have fallen back over the last three years. Compared with 2022, when the typical sale came in around £553,333, that's a fall of roughly 45.4%.
Looking back five years, average prices are down about 67.2% since 2020, a drop of around £619,466 in cash terms.
Zoom out to the past decade for the fuller picture. Back in 2015, homes here averaged £218,416, so the typical sold price has climbed about 38.3% since then, roughly 3.3% a year. Stretch the view to fifteen years and that annual pace eases back to about 0.9%.
Frequently asked questions about Lubenham
What is the average price for a property for sale in Lubenham?
The average price for a property for sale in Lubenham is £458,900. This amount is 19% higher than the average price in Lutterworth. There are 10 property listings for sale in Lubenham.
What streets have the most expensive properties for sale in Lubenham?
The street with the most expensive properties for sale in Lubenham is Main Street at an average of £602,000.
What streets have the most affordable properties for sale in Lubenham?
The street with the most affordable properties for sale in Lubenham is Pebble Cottages at an average of £278,666.
Which train stations are available in or near Lubenham?
Some of the train stations available in or near Lubenham are Market Harborough, South Wigston and Narborough.
Property Price Paid in Lubenham by Year
The average sold property price by year was:
| Year | Average Sold Price | Price Change |
Sold Properties
|
|---|---|---|---|
| 2025 | £302,000 | -22% |
3 Properties |
| 2024 | £368,000 | -301% |
6 Properties |
| 2023 | £1,475,000 | 62% |
1 Property |
| 2022 | £553,333 | 41% |
3 Properties |
| 2021 | £326,875 | -182% |
4 Properties |
| 2020 | £921,466 | 72% |
3 Properties |
| 2019 | £255,000 | -212% |
2 Properties |
| 2018 | £796,666 | 56% |
3 Properties |
| 2017 | £351,500 | 1% |
2 Properties |
| 2016 | £348,990 | 37% |
5 Properties |
Property Price per Property Type in Lubenham
Here you can find historic sold price data in order to help with your property search.
The average Property Paid Price for specific property types in the last three years are:
| Property Type | Average Sold Price | Sold Properties |
|---|---|---|
| Semi Detached House | £339,000.00 | 2 Semi Detached Houses |
| Terraced House | £296,833.00 | 6 Terraced Houses |
| Detached House | £1,065,000.00 | 2 Detached Houses |
