
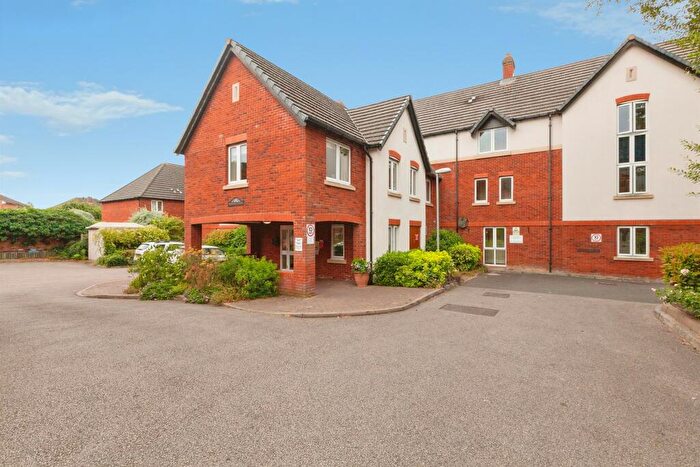
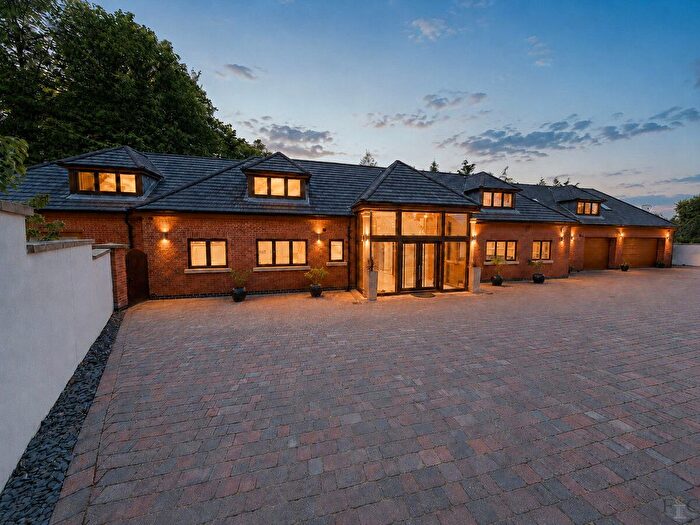
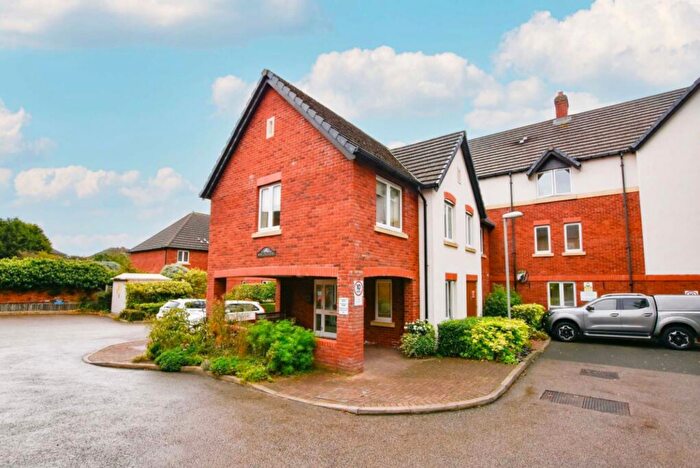
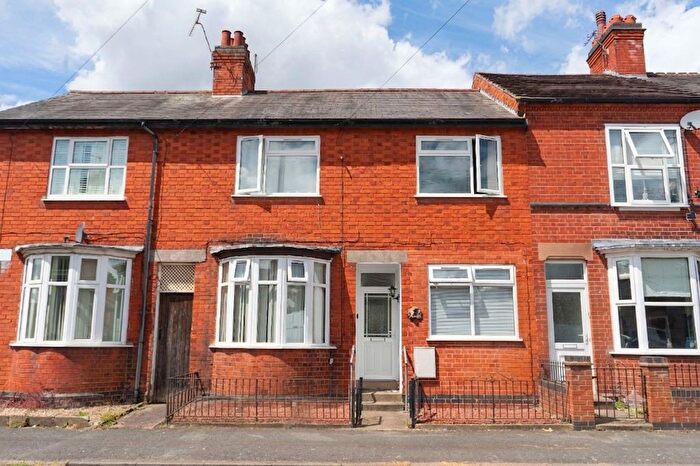
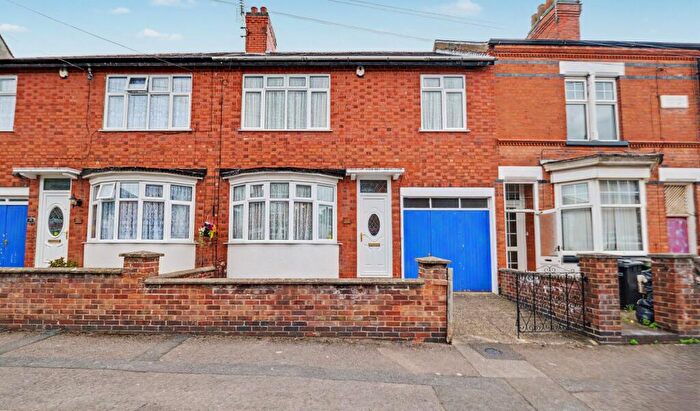
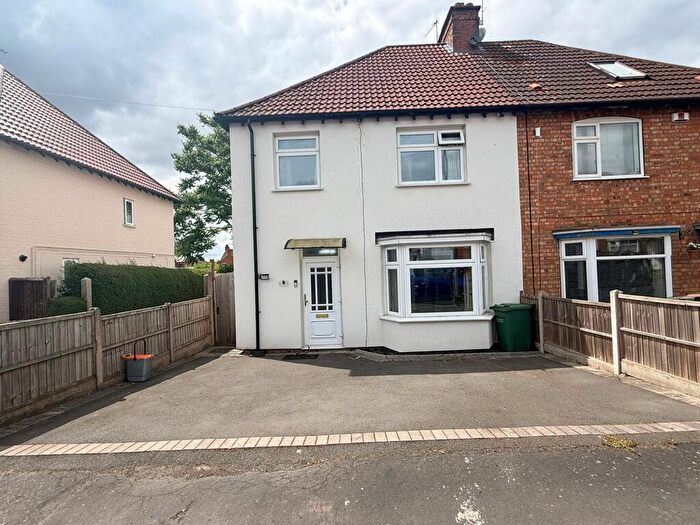
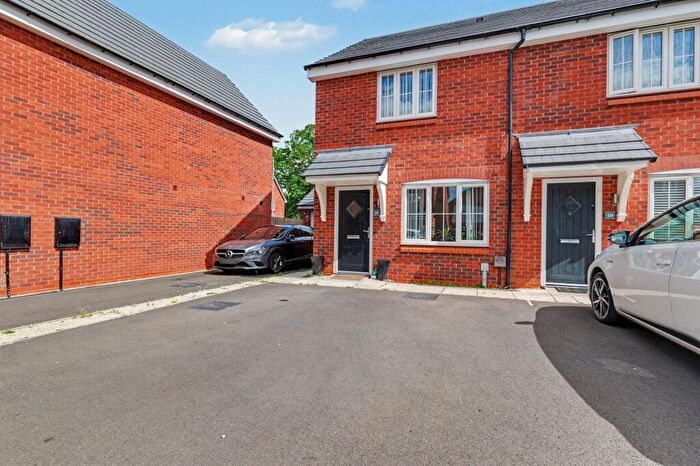
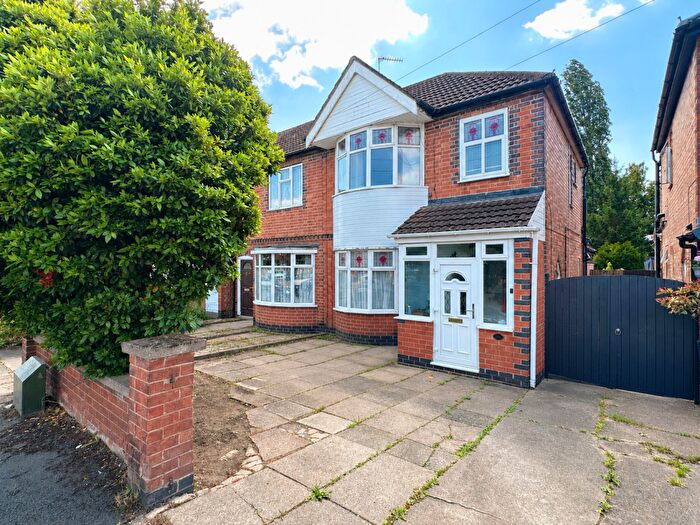
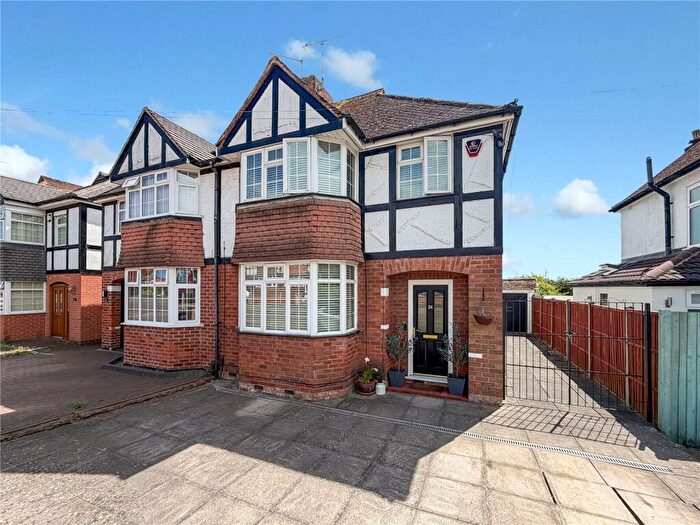
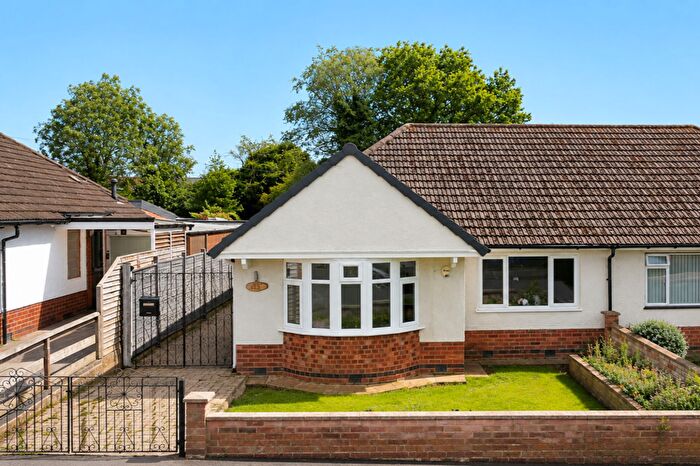
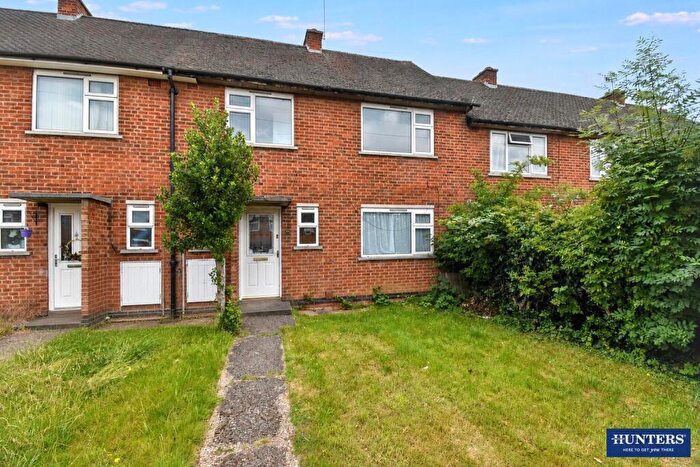
Houses for sale in Oadby Grange, Leicester
House Prices in Oadby Grange
Properties in Oadby Grange have an average house price of £568k and had 118 Property Transactions within the last 3 years¹.
Oadby Grange is an area in Leicester, Leicestershire with 1,597 households², where the most expensive property was sold for £1.66M.
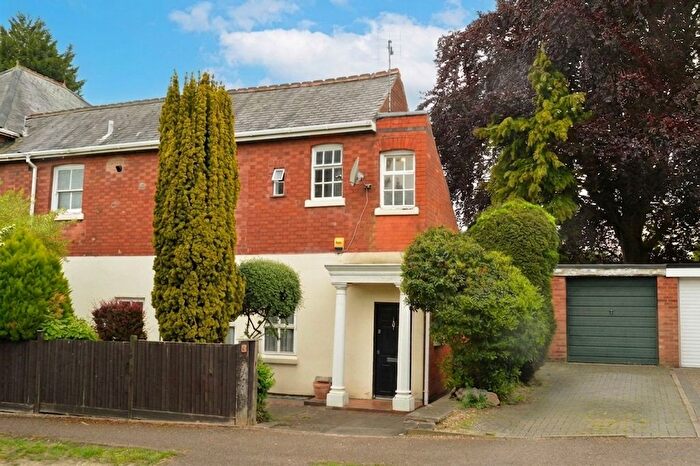
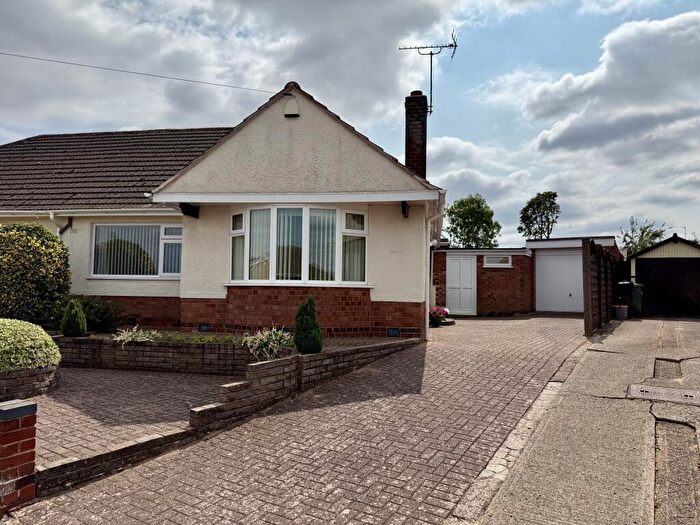
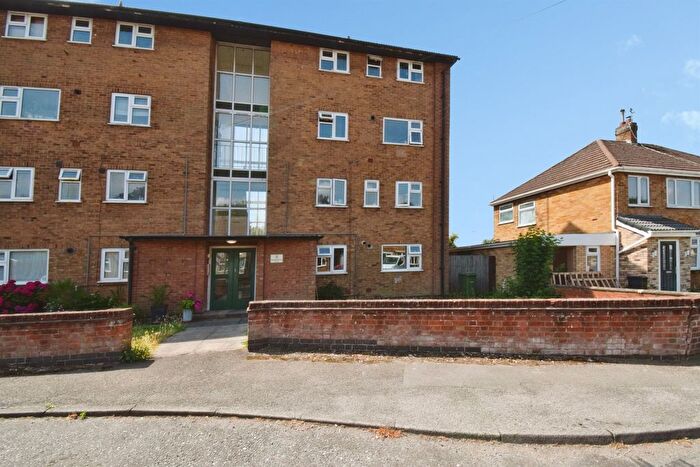
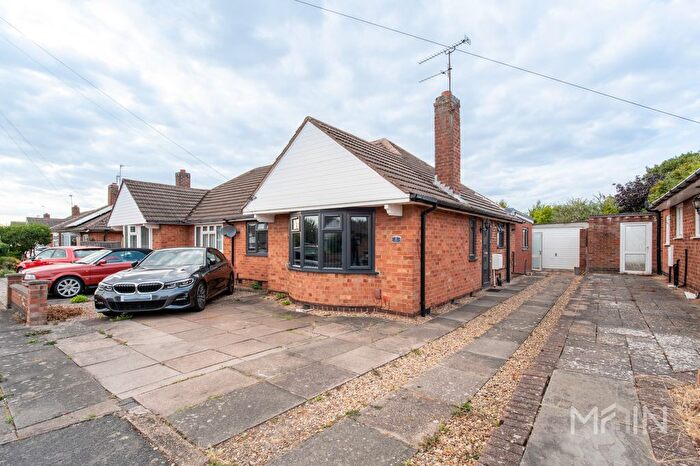
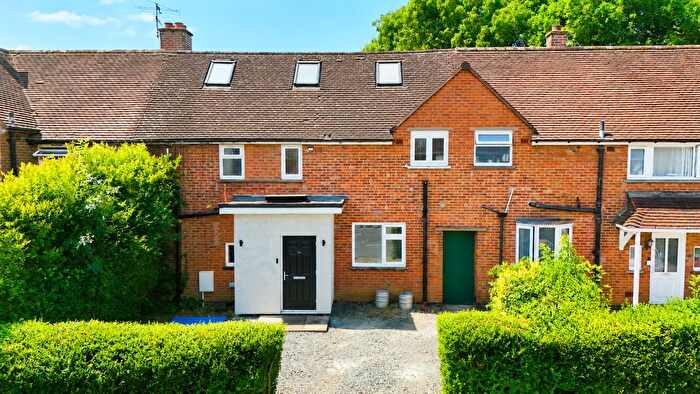
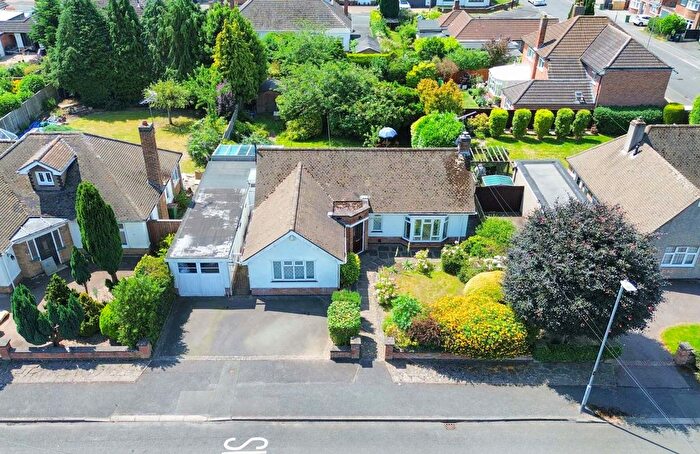
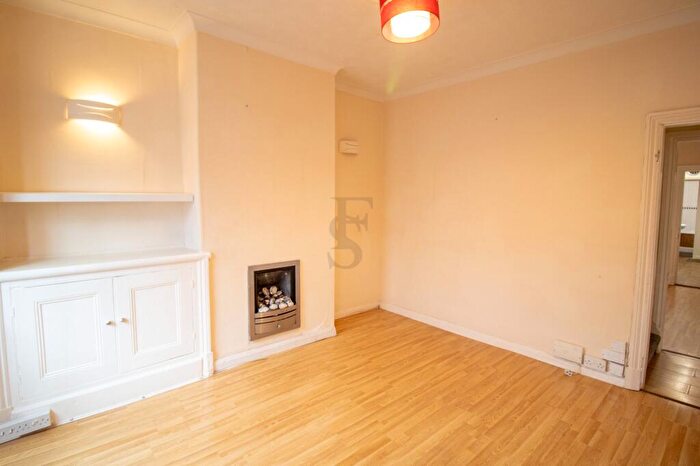
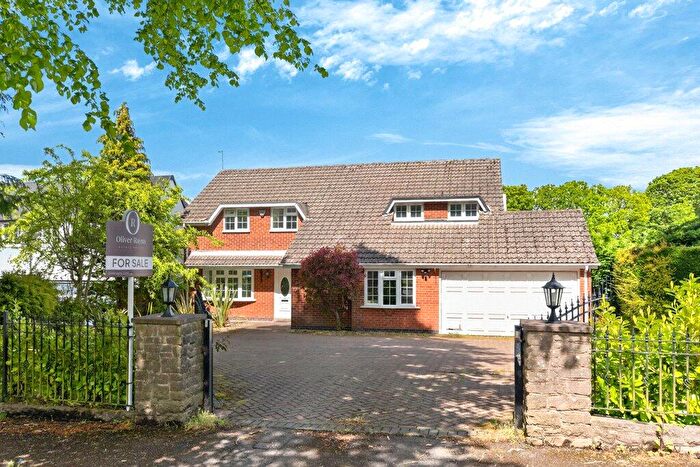
Properties for sale in Oadby Grange
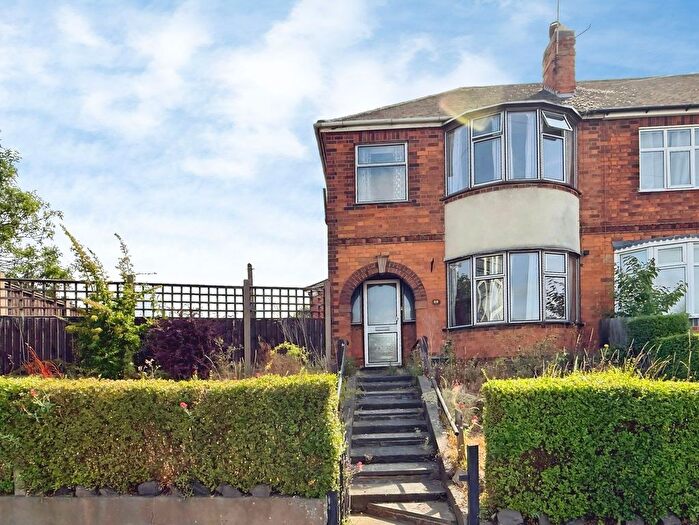

![]()
If you are looking to sell your house, let it out, or receive a property valuation, an expert can help you.
Click the button below to get started.


Roads and Postcodes in Oadby Grange
Navigate through our locations to find the location of your next house in Oadby Grange, Leicester for sale or to rent.
| Streets | Postcodes |
|---|---|
| Abbots Drive | LE2 2GL |
| Bankart Avenue | LE2 2DB LE2 2DD |
| Beaumont Street | LE2 4DA LE2 4DB |
| Blackthorn Lane | LE2 4FA |
| Bossu Drive | LE2 2GR |
| Bushby Road | LE2 2GH |
| Covert Close | LE2 4HB |
| Cranborne Gardens | LE2 4EZ |
| Cross Street | LE2 4DD |
| Dogwood Court | LE2 4EB |
| Eglantine Close | LE2 4EG |
| Eynsford Close | LE2 2LN |
| Farnham Close | LE2 2GS |
| Framework Knitters Cottages | LE2 4EX |
| Gartree Road | LE2 2FA LE2 2FB LE2 2FD LE2 2FE LE2 2FF |
| Glebe Close | LE2 2LA |
| Glebe Gardens | LE2 2LQ |
| Glebe Road | LE2 2LD |
| Hall Drive | LE2 4HE |
| Harborough Road | LE2 4LE LE2 4LF |
| Harvard Close | LE2 5EG |
| Hawthorn Grove | LE2 4ED |
| Holly Court | LE2 4EH |
| Holme Drive | LE2 4HF |
| Hornbeam Close | LE2 4EQ |
| Knighton Grange Road | LE2 2LE LE2 2LF |
| Knighton Rise | LE2 2RE LE2 2RF |
| Launde Road | LE2 4HG |
| Leicester Road | LE2 4AH LE2 4AA LE2 4AF LE2 4AG |
| Leycester Close | LE2 2GQ |
| Leys Close | LE2 4HJ |
| Manor Close | LE2 4FE |
| Manor Road | LE2 2LG LE2 2LH LE2 2LJ LE2 2LL LE2 2SA LE2 2SB |
| Manor Road Extension | LE2 4FF LE2 4FG |
| Meadowcourt Road | LE2 2PB LE2 2PD |
| New Street | LE2 4LJ |
| Oaks Way | LE2 2HR |
| Parkland Drive | LE2 4DG LE2 4DH |
| Pelham Street | LE2 4DJ |
| Penny Lane | LE2 2GN |
| Powys Avenue | LE2 2DP LE2 2DQ |
| Powys Gardens | LE2 2DS |
| Quickthorns | LE2 4EE |
| Regent Street | LE2 4DL LE2 4DN |
| Ringers Close | LE2 2HQ |
| Ringers Spinney | LE2 2HA LE2 2HB |
| Sheppard Drive | LE2 2GP |
| Southmeads Close | LE2 2LT |
| Southmeads Road | LE2 2LR LE2 2LS |
| Spencer Street | LE2 4DP LE2 4DQ |
| St Andrews Drive | LE2 2RG |
| St Davids Crescent | LE2 2RL |
| Stoughton Close | LE2 4DT |
| Stoughton Drive South | LE2 2NA LE2 2NB LE2 2ND LE2 2NE LE2 2NF LE2 2NG LE2 2RH LE2 2RJ |
| Stoughton Road | LE2 4DS LE2 4FL LE2 4FN LE2 4FP LE2 4FQ LE2 4FR LE2 4FS |
| Sycamore Close | LE2 2RN |
| The Broadway | LE2 2HD LE2 2HE LE2 2HF LE2 2HG |
| The Fairway | LE2 2HH LE2 2HJ LE2 2HL LE2 2HN LE2 2HP |
| The Yews | LE2 5EF |
| Wade Close | LE2 2GJ |
| Whitebeam Road | LE2 4EA |
| Woodfield Road | LE2 4HP LE2 4HQ |
| Wych Elm Road | LE2 4EF |
| Wyndham Close | LE2 4HR |
Property price trends in Oadby Grange
According to the latest Land Registry data, the average home in Oadby Grange sold for £443,333 in 2026. That figure comes from 2,035 sales logged over the past 31 years.
Prices have fallen back over the last three years. Compared with 2023, when the typical sale came in around £574,731, that's a fall of roughly 22.9%.
Looking back five years, average prices are down about 18.5% since 2021, a drop of around £100,756 in cash terms.
Zoom out to the past decade for the fuller picture. Back in 2016, homes here averaged £354,254, so the typical sold price has climbed about 25.1% since then, roughly 2.3% a year. Stretch the view to fifteen years and that annual pace eases back to about 1.6%.
Frequently asked questions about Oadby Grange
What is the average price for a property for sale in Oadby Grange?
The average price for a property for sale in Oadby Grange is £567,626. This amount is 81% higher than the average price in Leicester. There are 986 property listings for sale in Oadby Grange.
What streets have the most expensive properties for sale in Oadby Grange?
The streets with the most expensive properties for sale in Oadby Grange are Southmeads Road at an average of £1,541,250, Knighton Grange Road at an average of £1,250,000 and Knighton Rise at an average of £1,206,250.
What streets have the most affordable properties for sale in Oadby Grange?
The streets with the most affordable properties for sale in Oadby Grange are Harborough Road at an average of £119,500, Leicester Road at an average of £130,500 and Regent Street at an average of £230,000.
Which train stations are available in or near Oadby Grange?
Some of the train stations available in or near Oadby Grange are Leicester, South Wigston and Narborough.
Property Price Paid in Oadby Grange by Year
The average sold property price by year was:
| Year | Average Sold Price | Price Change |
Sold Properties
|
|---|---|---|---|
| 2026 | £443,333 | -40% |
3 Properties |
| 2025 | £621,921 | 18% |
38 Properties |
| 2024 | £508,926 | -13% |
34 Properties |
| 2023 | £574,731 | 15% |
43 Properties |
| 2022 | £489,824 | -11% |
47 Properties |
| 2021 | £544,089 | 11% |
59 Properties |
| 2020 | £484,952 | -3% |
38 Properties |
| 2019 | £498,831 | 28% |
49 Properties |
| 2018 | £357,782 | -11% |
49 Properties |
| 2017 | £398,826 | 11% |
55 Properties |
Property Price per Property Type in Oadby Grange
Here you can find historic sold price data in order to help with your property search.
The average Property Paid Price for specific property types in the last three years are:
| Property Type | Average Sold Price | Sold Properties |
|---|---|---|
| Semi Detached House | £339,956.00 | 23 Semi Detached Houses |
| Detached House | £721,992.00 | 77 Detached Houses |
| Terraced House | £226,769.00 | 13 Terraced Houses |
| Flat | £123,900.00 | 5 Flats |
