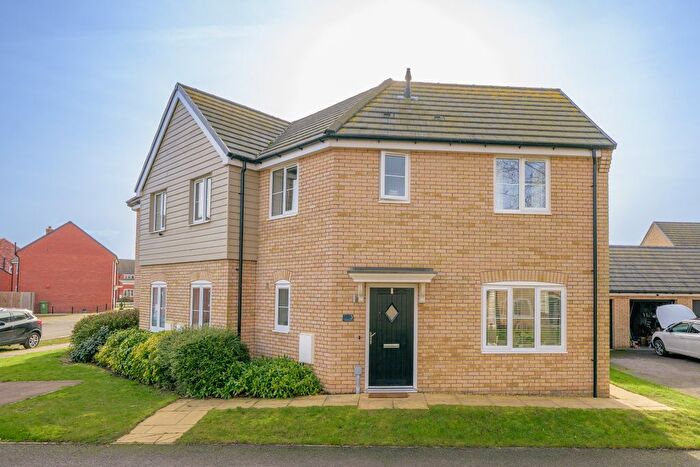
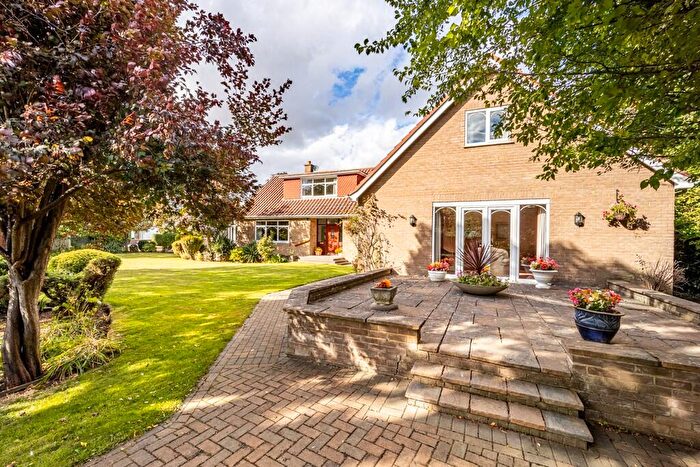
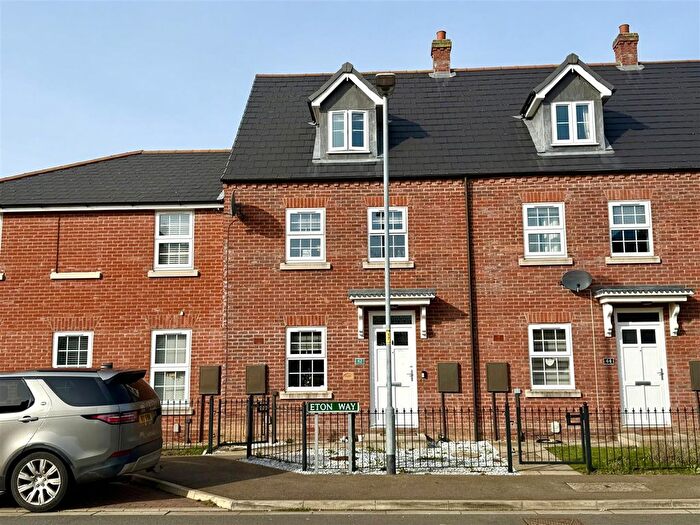
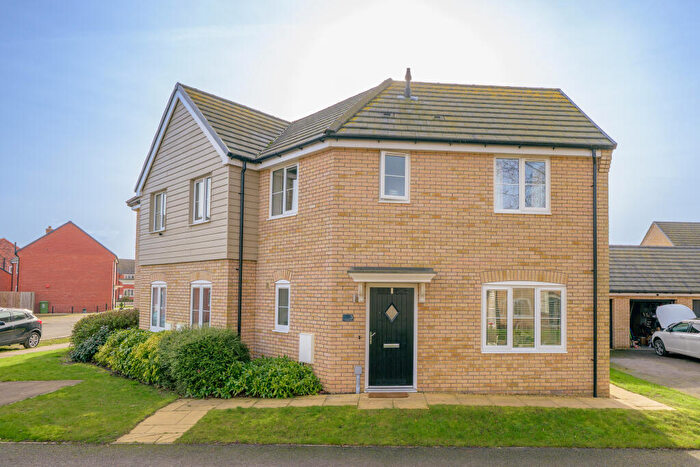
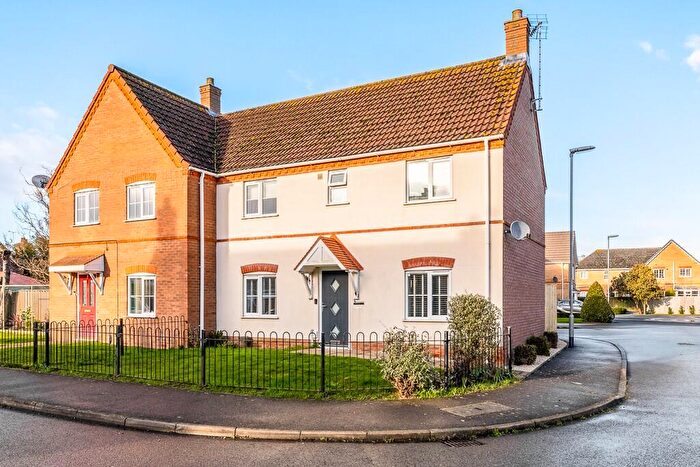
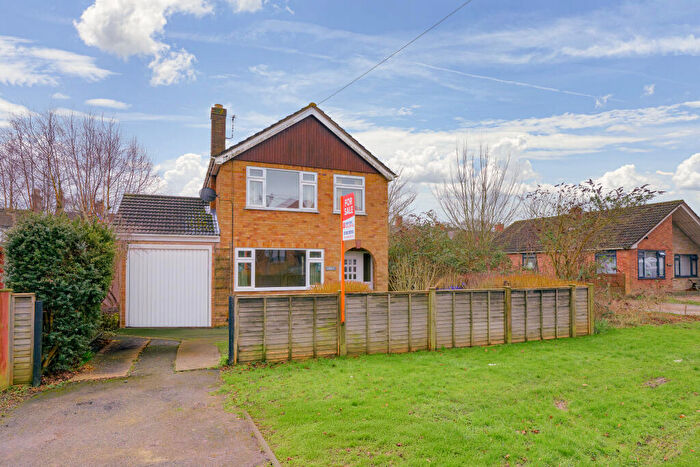
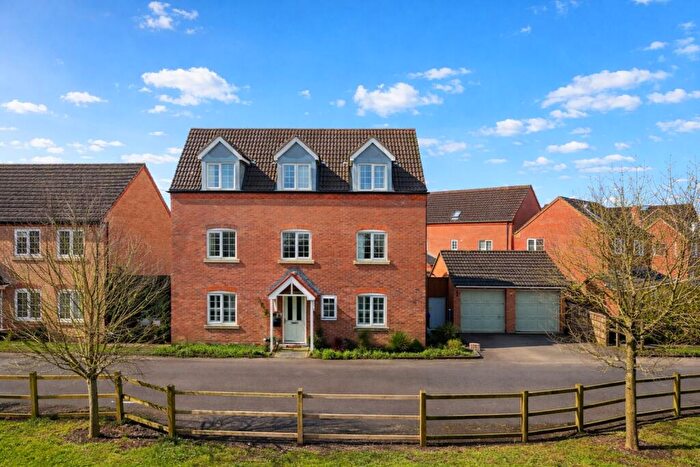
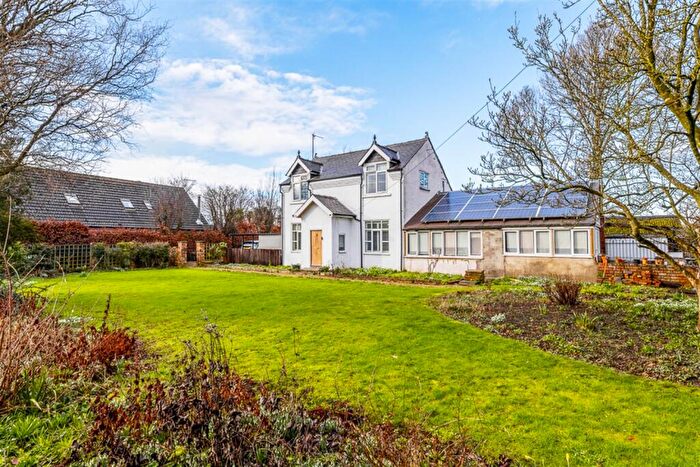
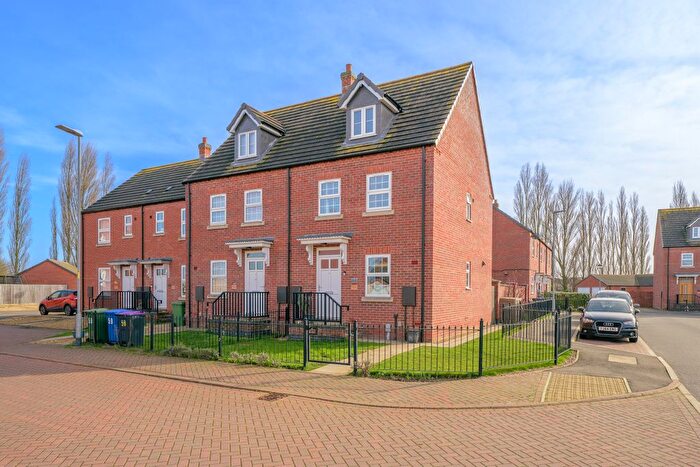
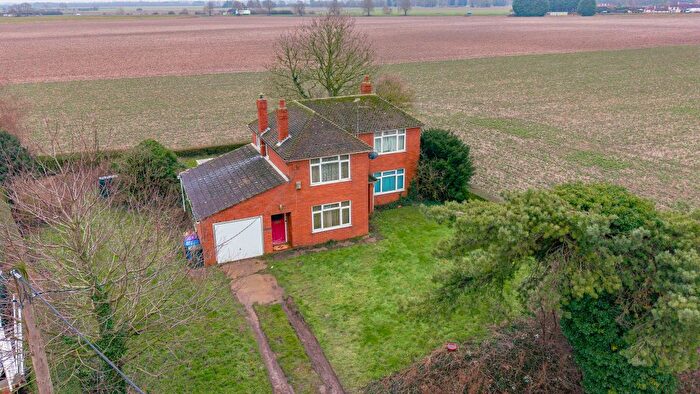
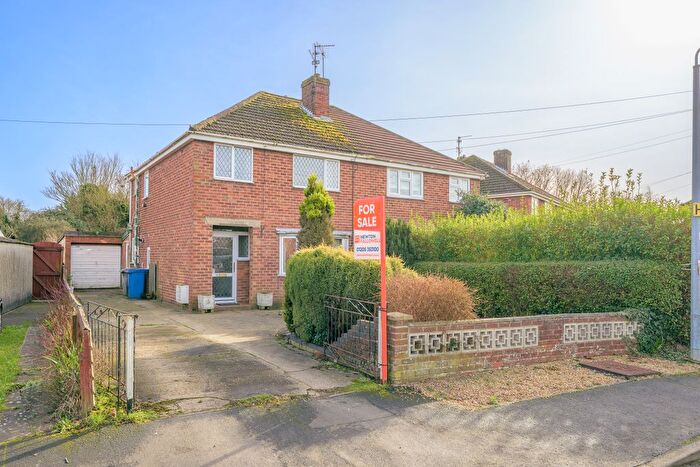
Houses for sale & to rent in Frampton And Holme, Boston
House Prices in Frampton And Holme
Properties in Frampton And Holme have an average house price of £317,381.00 and had 56 Property Transactions within the last 3 years¹.
Frampton And Holme is an area in Boston, Lincolnshire with 691 households², where the most expensive property was sold for £1,800,000.00.
Properties for sale in Frampton And Holme
Roads and Postcodes in Frampton And Holme
Navigate through our locations to find the location of your next house in Frampton And Holme, Boston for sale or to rent.
| Streets | Postcodes |
|---|---|
| Bannisters Lane | PE20 1RD |
| Beck Bank | PE20 1TH |
| Boardsides | PE20 3QP |
| Church End | PE20 1AD PE20 1AH PE20 1AX |
| Church Green Lane | PE20 1RN PE20 1RP |
| Cuthberts Lane | PE20 1RR |
| Fen Road | PE20 1RB PE20 1RS PE20 1RU PE20 1RZ PE20 1SD |
| Five House Lane | PE20 1RY |
| Frampton Bank | PE20 1SW |
| Frampton Fen Lane | PE20 1SH PE20 3QU |
| Frampton Roads | PE20 1AY |
| Green Lane | PE20 3HN |
| Grosvenor Road | PE20 1DB |
| Hall Lane | PE20 1AB |
| Holme Road | PE20 1SY PE20 1TB |
| Holmes Road | PE20 1SJ PE20 1SN PE20 1SP |
| Hubberts Bridge Road | PE20 1TW |
| Kells Drove | PE20 1TL |
| Langrick Road | PE20 3SG |
| Lenton Way | PE20 1AU |
| Lighton Avenue | PE20 1BY |
| Littleside Road | PE20 1TA |
| London Road | PE20 1BN PE20 1BP |
| Middlegate Road | PE20 1AR PE20 1AS PE20 1AW PE20 1BX PE20 1BZ PE20 1DA |
| Millfield Lane West | PE20 1BW |
| Multon Ings Lane | PE20 1RW |
| Ralphs Lane | PE20 1QU PE20 1QZ PE20 1RJ PE20 1RQ |
| Rookery | PE20 1RE |
| Sandholme Lane | PE20 1AE PE20 1AF PE20 1AG PE20 1NG |
| Silvertoft Lane | PE20 1RX |
| Simon Weir Lane | PE20 1TF |
| Spotfield Lane | PE20 1QY |
| Station Road | PE20 3QR PE20 3QT |
| Swineshead Road | PE20 1SB PE20 1SF PE20 1SG PE20 1SQ |
| Sykemouth Drove | PE20 1TU |
| Thornimans Lane | PE20 1AJ |
| PE20 1TE PE20 1TQ PE20 1TT |
Transport near Frampton And Holme
- FAQ
- Price Paid By Year
- Property Type Price
Frequently asked questions about Frampton And Holme
What is the average price for a property for sale in Frampton And Holme?
The average price for a property for sale in Frampton And Holme is £317,381. This amount is 47% higher than the average price in Boston. There are 4,335 property listings for sale in Frampton And Holme.
What streets have the most expensive properties for sale in Frampton And Holme?
The streets with the most expensive properties for sale in Frampton And Holme are Hall Lane at an average of £570,000, Fen Road at an average of £343,875 and Middlegate Road at an average of £334,938.
What streets have the most affordable properties for sale in Frampton And Holme?
The streets with the most affordable properties for sale in Frampton And Holme are London Road at an average of £250,000, Church Green Lane at an average of £250,000 and Bannisters Lane at an average of £250,500.
Which train stations are available in or near Frampton And Holme?
Some of the train stations available in or near Frampton And Holme are Hubberts Bridge, Boston and Swineshead.
Property Price Paid in Frampton And Holme by Year
The average sold property price by year was:
| Year | Average Sold Price | Price Change |
Sold Properties
|
|---|---|---|---|
| 2025 | £229,150 | -62% |
13 Properties |
| 2024 | £371,157 | 13% |
19 Properties |
| 2023 | £322,600 | 3% |
24 Properties |
| 2022 | £313,514 | 5% |
28 Properties |
| 2021 | £298,550 | 13% |
38 Properties |
| 2020 | £258,675 | 6% |
20 Properties |
| 2019 | £243,748 | 14% |
32 Properties |
| 2018 | £210,656 | -33% |
32 Properties |
| 2017 | £280,068 | 26% |
26 Properties |
| 2016 | £206,219 | -0,3% |
18 Properties |
| 2015 | £206,838 | 15% |
27 Properties |
| 2014 | £176,198 | 2% |
25 Properties |
| 2013 | £173,053 | -13% |
27 Properties |
| 2012 | £194,806 | 10% |
22 Properties |
| 2011 | £174,952 | 8% |
23 Properties |
| 2010 | £160,672 | -3% |
20 Properties |
| 2009 | £165,668 | -41% |
20 Properties |
| 2008 | £233,785 | 16% |
21 Properties |
| 2007 | £195,535 | 6% |
27 Properties |
| 2006 | £183,712 | 8% |
16 Properties |
| 2005 | £168,767 | 9% |
26 Properties |
| 2004 | £153,219 | 11% |
21 Properties |
| 2003 | £136,202 | 22% |
21 Properties |
| 2002 | £105,828 | 7% |
38 Properties |
| 2001 | £98,494 | 26% |
24 Properties |
| 2000 | £72,696 | 17% |
44 Properties |
| 1999 | £60,176 | -6% |
28 Properties |
| 1998 | £63,759 | 0,2% |
42 Properties |
| 1997 | £63,647 | 4% |
20 Properties |
| 1996 | £61,375 | 22% |
24 Properties |
| 1995 | £47,679 | - |
22 Properties |
Property Price per Property Type in Frampton And Holme
Here you can find historic sold price data in order to help with your property search.
The average Property Paid Price for specific property types in the last three years are:
| Property Type | Average Sold Price | Sold Properties |
|---|---|---|
| Semi Detached House | £221,390.00 | 5 Semi Detached Houses |
| Detached House | £326,792.00 | 51 Detached Houses |


