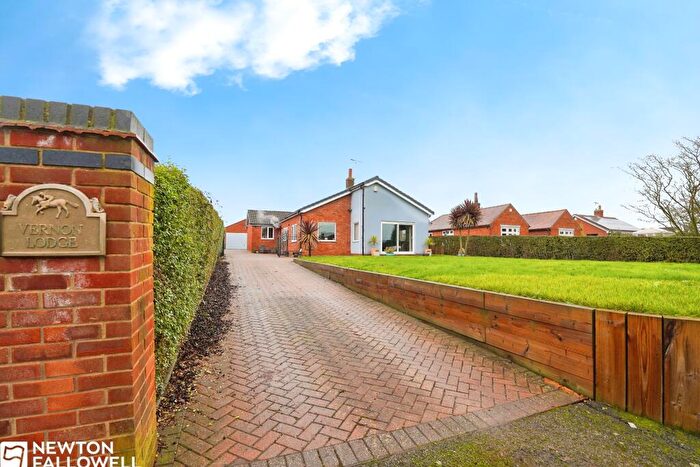
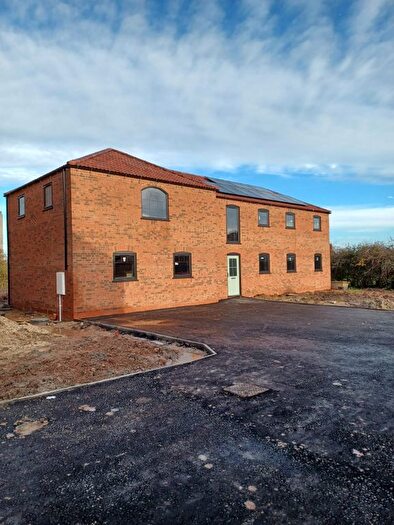
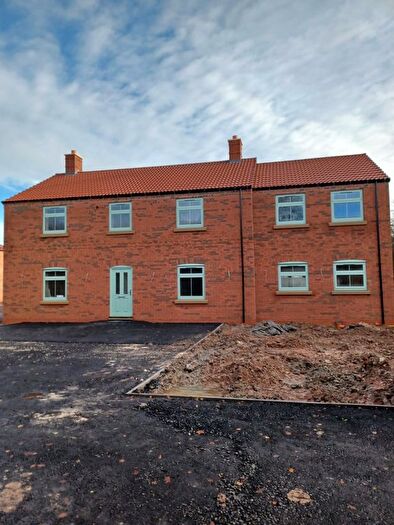
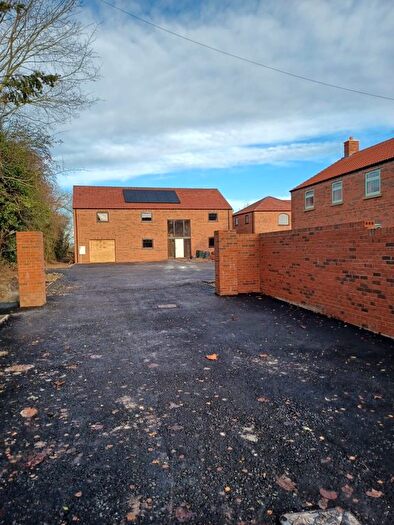
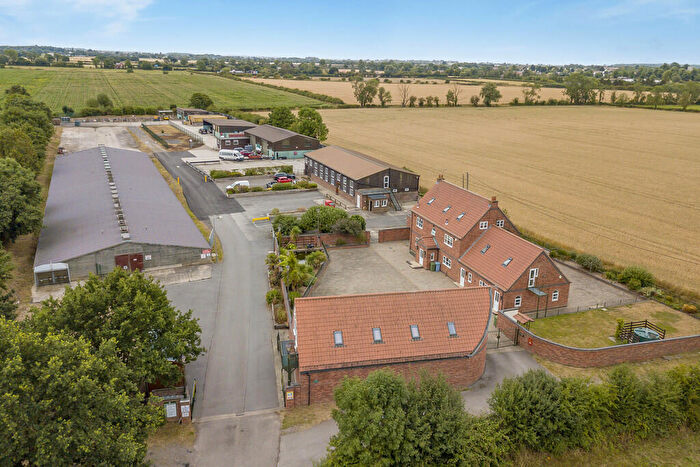
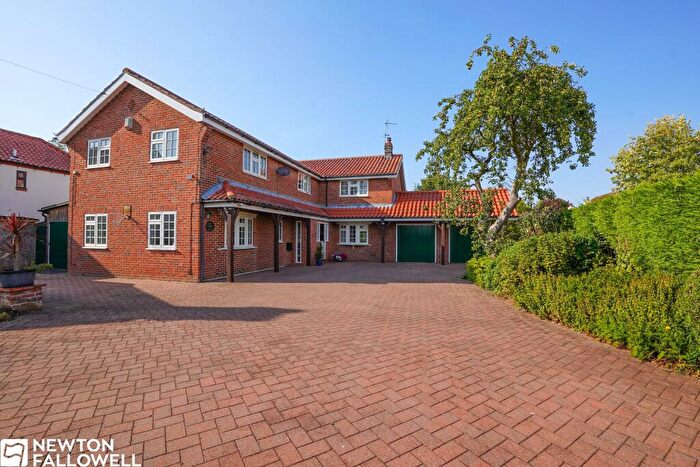
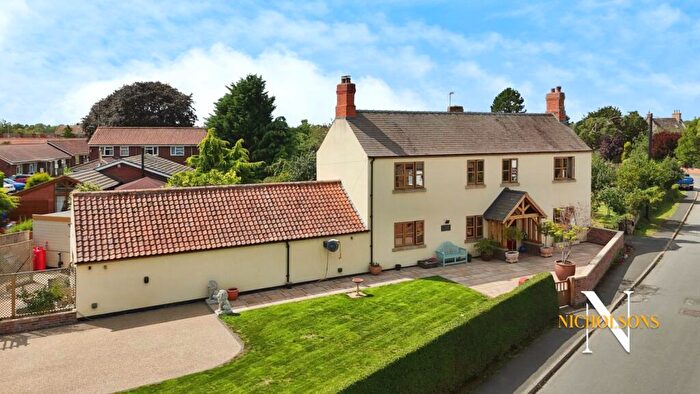
Houses for sale & to rent in Rampton, Retford
House Prices in Rampton
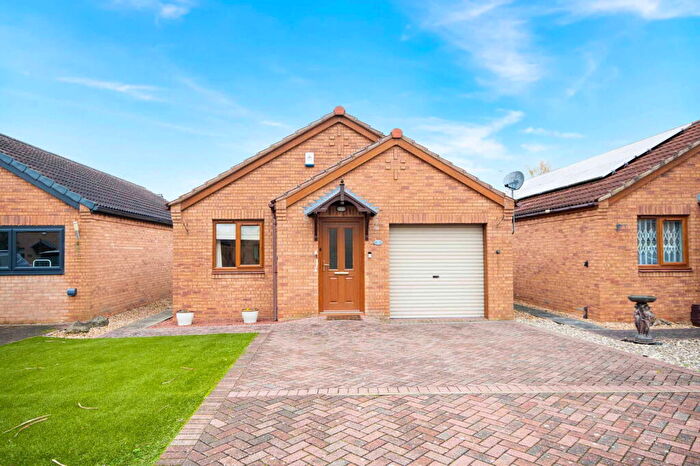
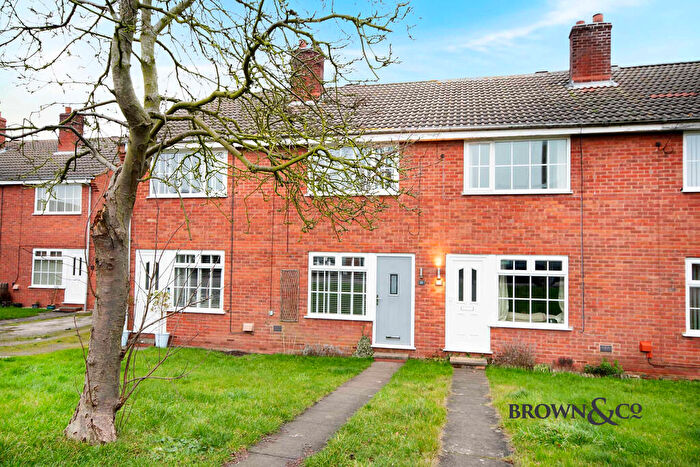
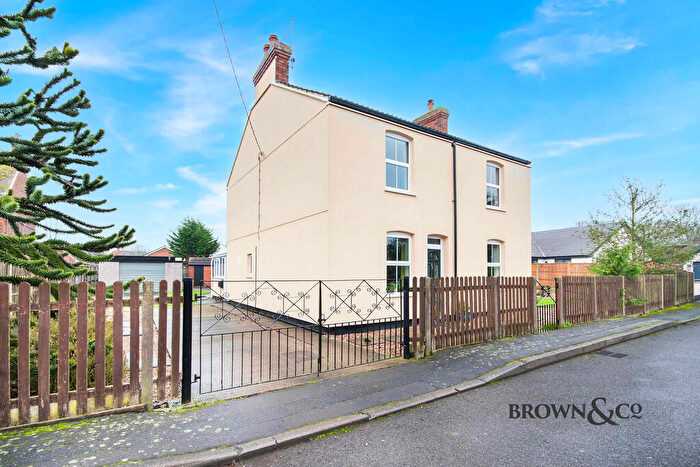
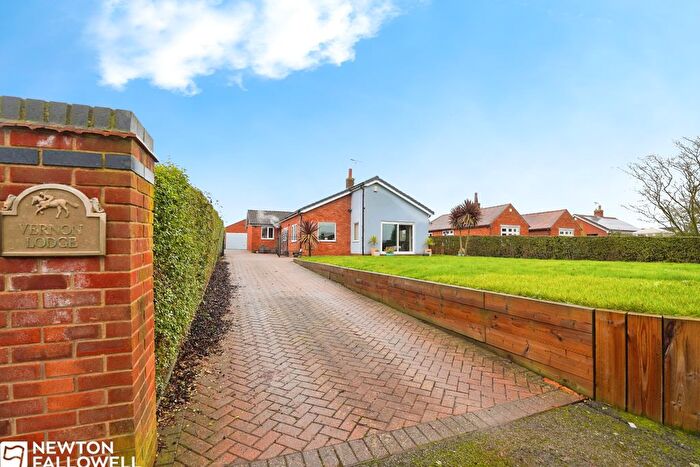
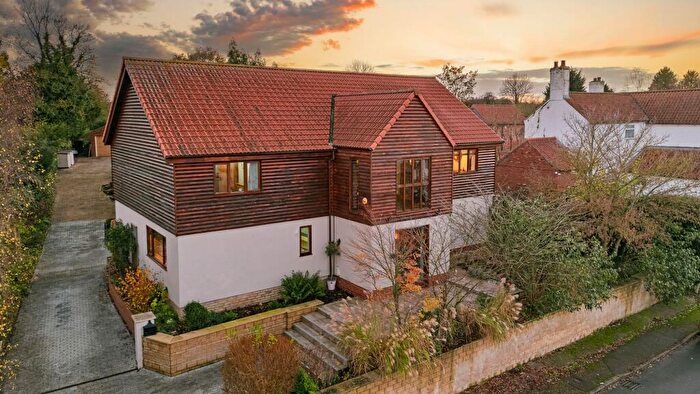
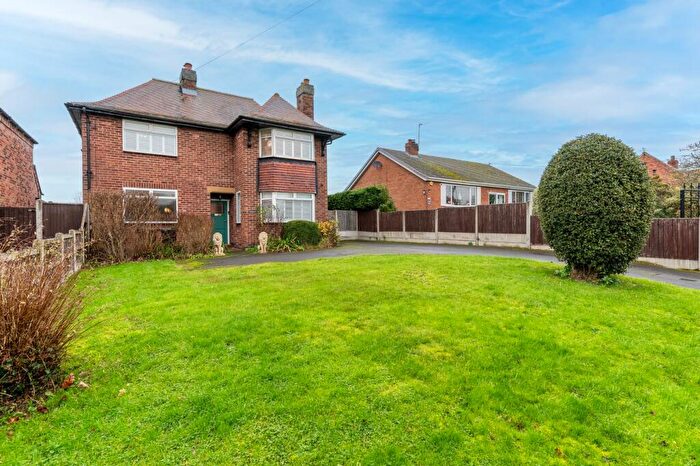
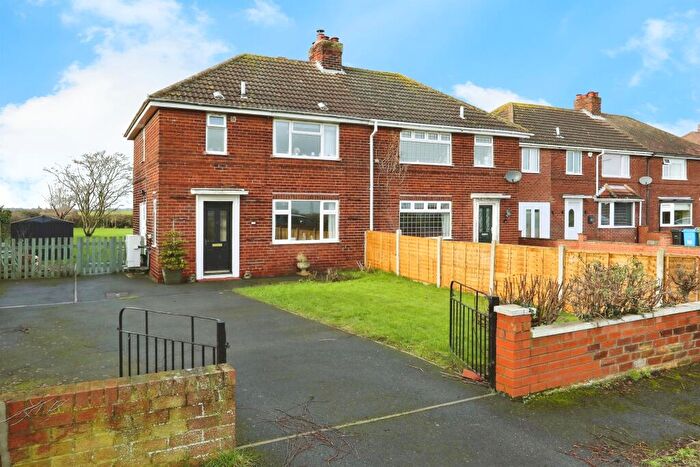
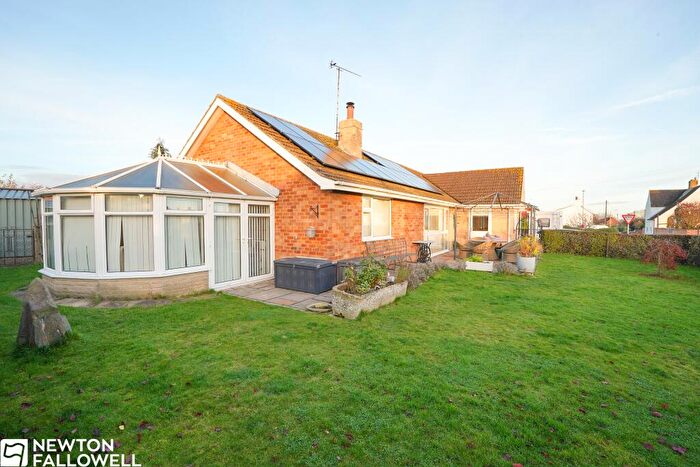
Properties in Rampton have an average house price of £284,617.00 and had 51 Property Transactions within the last 3 years¹.
Rampton is an area in Retford, Nottinghamshire with 839 households², where the most expensive property was sold for £605,000.00.
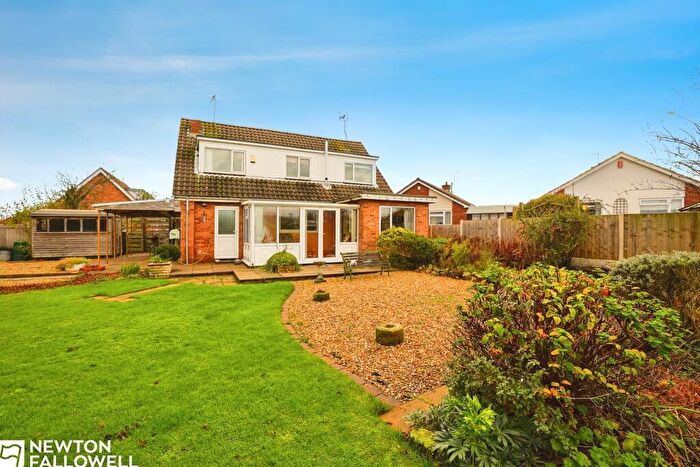
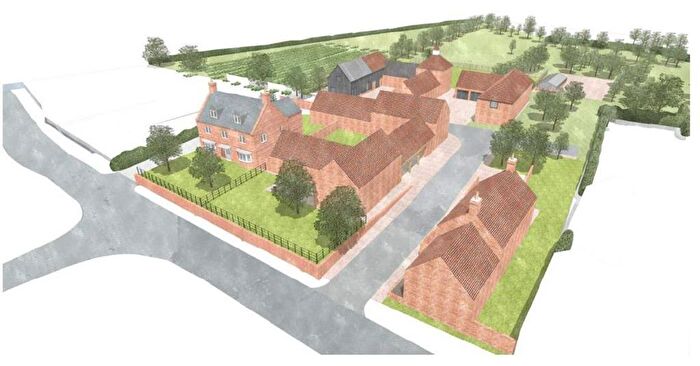
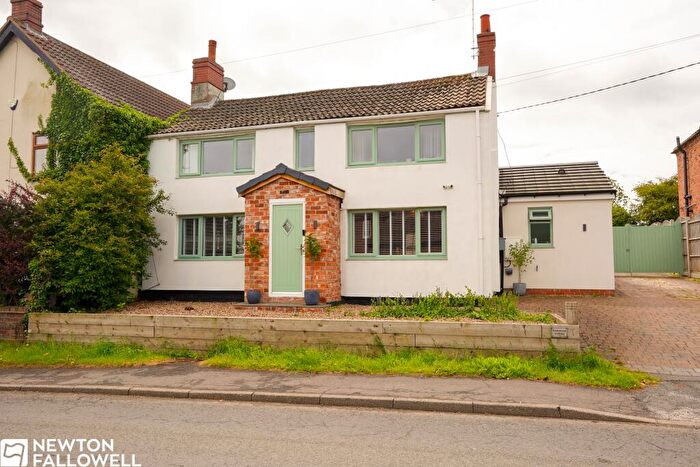
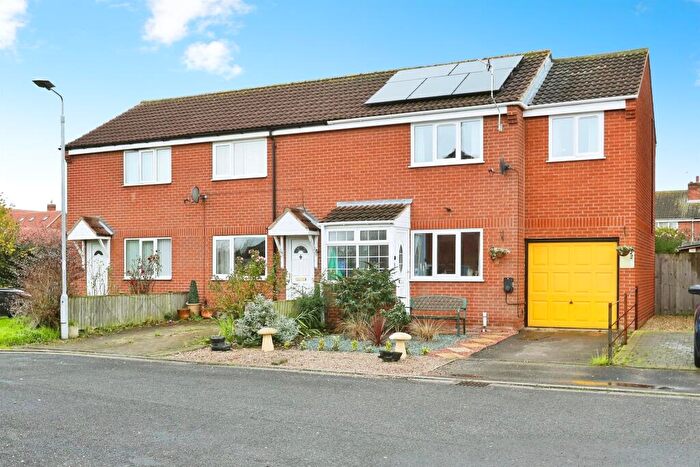
Properties for sale in Rampton
Roads and Postcodes in Rampton
Navigate through our locations to find the location of your next house in Rampton, Retford for sale or to rent.
| Streets | Postcodes |
|---|---|
| Birch Close | DN22 0TB |
| Burden Crescent | DN22 0JR |
| Cavell Close | DN22 0HL |
| Chadwick Walk | DN22 0JS |
| Church Street | DN22 0BL DN22 0BX DN22 0BZ |
| Church View | DN22 0RF |
| Cottam Road | DN22 0BU DN22 0EP |
| Darwin Drive | DN22 0JT |
| Dendy Drive | DN22 0HW |
| East End Court | DN22 0GE |
| Fleming Drive | DN22 0JF |
| Floss Lane | DN22 0EY |
| Floss View | DN22 0EX |
| Galen Avenue | DN22 0JJ |
| Glover Close | DN22 0BW |
| Golden Holme Lane | DN22 0LT |
| Grange Farm Cottages | DN22 0EZ |
| Greenside | DN22 0HY |
| Greenside Avenue | DN22 0JN |
| Grove | DN22 0RJ |
| Grove Road | DN22 0EA |
| Harvest Square | DN22 0GG |
| Headon Park | DN22 0RH |
| High Street | DN22 0BN |
| Lady Well Lane | DN22 0PA |
| Laneham Street | DN22 0JX |
| Long Lane | DN22 0GH |
| Main Street | DN22 0HR |
| Manor Farm Cottages | DN22 0JY |
| Manor Grounds | DN22 0JU |
| Marsh Lane | DN22 0FN |
| Meetinghouse Lane | DN22 0BS |
| Mill Lane | DN22 0DA |
| Nightingale Way | DN22 0JG |
| Old Walled Gardens | DN22 0FA |
| Orchard Drive | DN22 0LS |
| Orchard Lane | DN22 0FD |
| Orchard Rise | DN22 0EL |
| Outgang Road | DN22 0GF |
| Plough Hill | DN22 0GN |
| Rampton Lane | DN22 0BF |
| Rectory Road | DN22 0EH |
| Retford Road | DN22 0BB DN22 0BY DN22 0FG DN22 0HE DN22 0JE DN22 0JL DN22 0JA |
| Simon Close | DN22 0JW |
| Station Road | DN22 0DB |
| The Pastures | DN22 0TD |
| Thorpe Farm Close | DN22 0FR |
| Torksey Street | DN22 0HT |
| Town Street | DN22 0BT DN22 0EG DN22 0EJ DN22 0EN |
| Treswell Road | DN22 0BP DN22 0HU DN22 0HX |
| Vernon Close | DN22 0RL |
| West Croft Close | DN22 0DP |
| Westbrecks Lane | DN22 0ER DN22 0ES |
| Whites Farm | DN22 0FB |
| DN22 0ED DN22 0EU DN22 0EW DN22 0JB DN22 0JD DN22 0JZ DN22 0RA DN22 0RD DN22 0DJ DN22 0EB DN22 0EE DN22 0EF DN22 0EQ DN22 0LA DN22 0LB DN22 0NP DN22 0PB DN22 0PD DN22 0RE DN22 0RQ DN22 0TF |
Transport near Rampton
- FAQ
- Price Paid By Year
- Property Type Price
Frequently asked questions about Rampton
What is the average price for a property for sale in Rampton?
The average price for a property for sale in Rampton is £284,617. This amount is 26% higher than the average price in Retford. There are 590 property listings for sale in Rampton.
What streets have the most expensive properties for sale in Rampton?
The streets with the most expensive properties for sale in Rampton are Rampton Lane at an average of £500,000, Laneham Street at an average of £426,500 and Whites Farm at an average of £422,000.
What streets have the most affordable properties for sale in Rampton?
The streets with the most affordable properties for sale in Rampton are Burden Crescent at an average of £126,250, Fleming Drive at an average of £140,000 and The Pastures at an average of £145,500.
Which train stations are available in or near Rampton?
Some of the train stations available in or near Rampton are Retford, Gainsborough Lea Road and Gainsborough Central.
Property Price Paid in Rampton by Year
The average sold property price by year was:
| Year | Average Sold Price | Price Change |
Sold Properties
|
|---|---|---|---|
| 2025 | £313,409 | 2% |
11 Properties |
| 2024 | £306,735 | 17% |
17 Properties |
| 2023 | £254,500 | -32% |
23 Properties |
| 2022 | £336,891 | 14% |
28 Properties |
| 2021 | £290,720 | 20% |
33 Properties |
| 2020 | £233,336 | 3% |
35 Properties |
| 2019 | £226,664 | -7% |
31 Properties |
| 2018 | £242,636 | 10% |
37 Properties |
| 2017 | £219,242 | 0,4% |
33 Properties |
| 2016 | £218,343 | -1% |
32 Properties |
| 2015 | £220,704 | 11% |
41 Properties |
| 2014 | £196,810 | 13% |
29 Properties |
| 2013 | £171,861 | -3% |
28 Properties |
| 2012 | £177,275 | 3% |
18 Properties |
| 2011 | £172,650 | -37% |
20 Properties |
| 2010 | £235,767 | 25% |
12 Properties |
| 2009 | £177,916 | -27% |
18 Properties |
| 2008 | £226,272 | 7% |
11 Properties |
| 2007 | £209,486 | -5% |
40 Properties |
| 2006 | £218,946 | 23% |
38 Properties |
| 2005 | £168,812 | -6% |
29 Properties |
| 2004 | £179,718 | 1% |
30 Properties |
| 2003 | £178,796 | 21% |
39 Properties |
| 2002 | £141,155 | 29% |
43 Properties |
| 2001 | £100,887 | 11% |
34 Properties |
| 2000 | £89,751 | 4% |
40 Properties |
| 1999 | £86,291 | -9% |
45 Properties |
| 1998 | £94,362 | 25% |
29 Properties |
| 1997 | £70,518 | -5% |
42 Properties |
| 1996 | £74,156 | 16% |
16 Properties |
| 1995 | £62,061 | - |
27 Properties |
Property Price per Property Type in Rampton
Here you can find historic sold price data in order to help with your property search.
The average Property Paid Price for specific property types in the last three years are:
| Property Type | Average Sold Price | Sold Properties |
|---|---|---|
| Semi Detached House | £193,066.00 | 15 Semi Detached Houses |
| Detached House | £357,366.00 | 30 Detached Houses |
| Terraced House | £149,750.00 | 6 Terraced Houses |

