
Houses for sale & to rent in Tuxford And Trent, Retford
House Prices in Tuxford And Trent
Properties in Tuxford And Trent have an average house price of £383,155.00 and had 26 Property Transactions within the last 3 years¹.
Tuxford And Trent is an area in Retford, Nottinghamshire with 230 households², where the most expensive property was sold for £725,000.00.
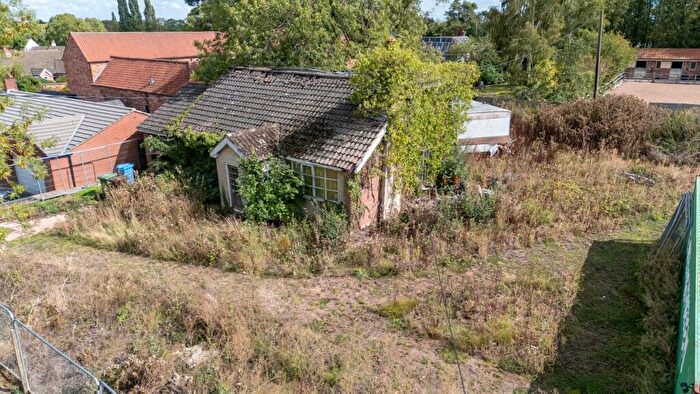
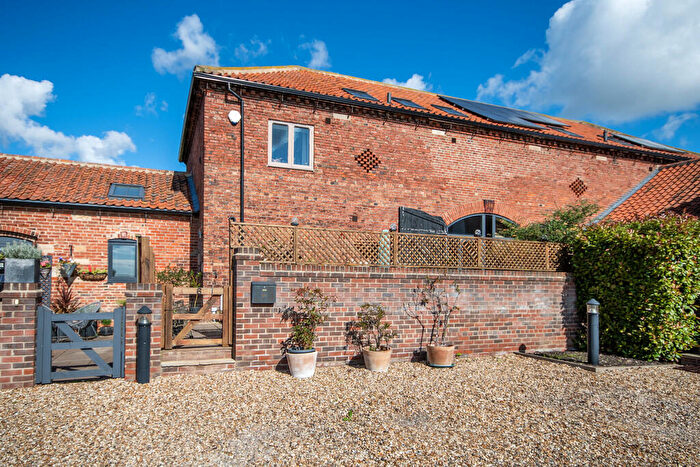
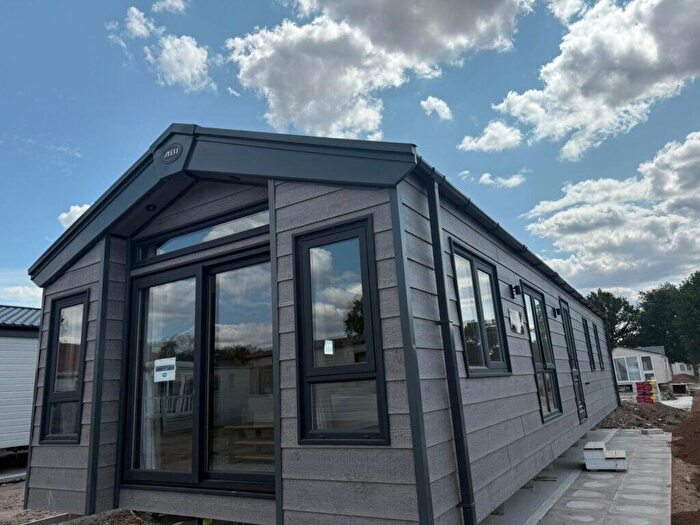
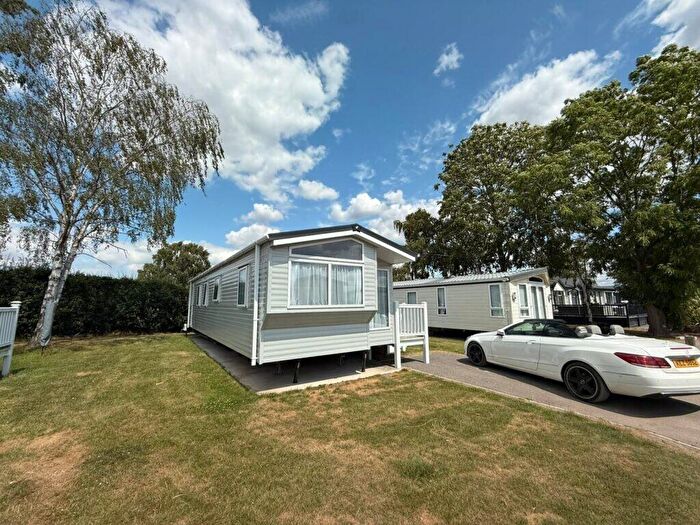
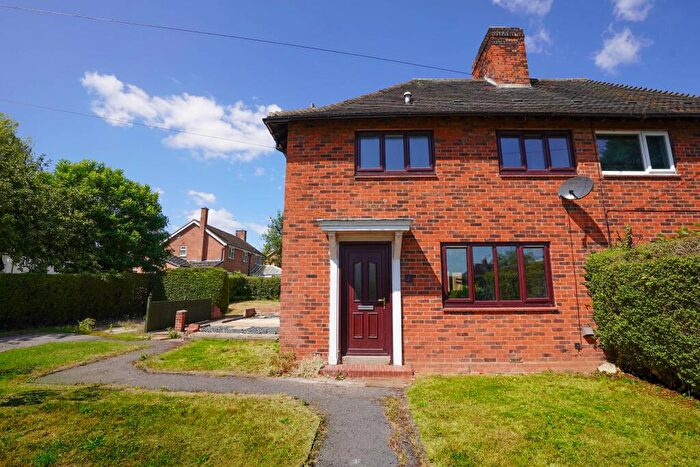
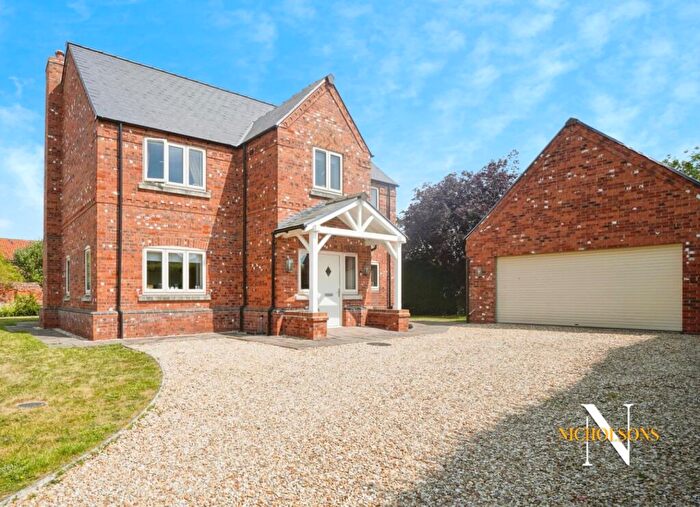
Properties for sale in Tuxford And Trent
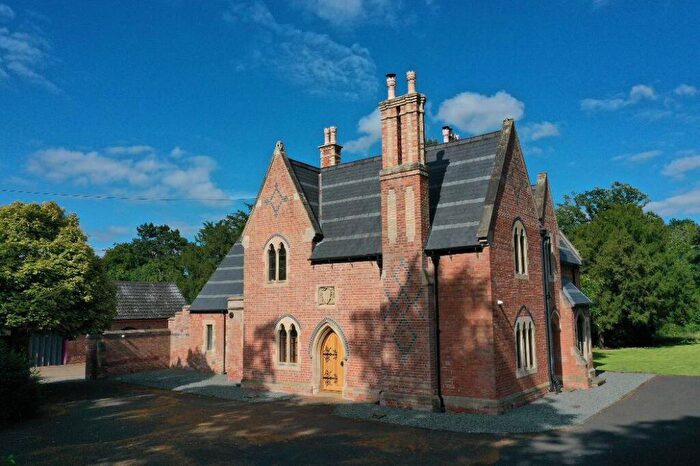
![]()
If you are looking to sell your house, let it out, or receive a property valuation, an expert can help you.
Click the button below to get started.
Roads and Postcodes in Tuxford And Trent
Navigate through our locations to find the location of your next house in Tuxford And Trent, Retford for sale or to rent.
| Streets | Postcodes |
|---|---|
| Broadings Lane | DN22 0NF DN22 0NL DN22 0NN |
| Church Lane | DN22 0LH DN22 0LJ |
| Darlton Road | DN22 0LQ |
| Dunham Road | DN22 0NB |
| Greengates Road | DN22 0LD |
| Homefield Close | DN22 0LX |
| Low Street | DN22 0LN |
| Main Street | DN22 0NA DN22 0ND DN22 0NG |
| Manor Farm Drive | DN22 0FQ |
| North Green | DN22 0LF |
| Rampton Road | DN22 0NE |
| Retford Road | DN22 0LL |
| Ring O Bells | DN22 0NW |
| Riverview | DN22 0FL |
| Top Street | DN22 0LG |
| DN22 0LP DN22 0LW DN22 0NJ DN22 0NQ DN22 0FE DN22 0LE DN22 0LR |
Transport near Tuxford And Trent
-
 Saxilby Station
 -
Retford Station
-
Gainsborough Lea Road Station
-
Swinderby Station
-
Gainsborough Central Station
-
Collingham Station
- FAQ
- Price Paid By Year
- Property Type Price
Frequently asked questions about Tuxford And Trent
What is the average price for a property for sale in Tuxford And Trent?
The average price for a property for sale in Tuxford And Trent is £383,155. This amount is 68% higher than the average price in Retford. There are 301 property listings for sale in Tuxford And Trent.
What streets have the most expensive properties for sale in Tuxford And Trent?
The streets with the most expensive properties for sale in Tuxford And Trent are North Green at an average of £690,000, Low Street at an average of £450,125 and Dunham Road at an average of £444,987.
What streets have the most affordable properties for sale in Tuxford And Trent?
The streets with the most affordable properties for sale in Tuxford And Trent are Main Street at an average of £237,012, Top Street at an average of £270,000 and Church Lane at an average of £440,000.
Which train stations are available in or near Tuxford And Trent?
Some of the train stations available in or near Tuxford And Trent are Saxilby, Retford and Gainsborough Lea Road.
Property Price Paid in Tuxford And Trent by Year
The average sold property price by year was:
| Year | Average Sold Price | Price Change |
Sold Properties
|
|---|---|---|---|
| 2025 | £567,000 | 36% |
5 Properties |
| 2024 | £364,444 | -2% |
9 Properties |
| 2023 | £370,075 | 27% |
6 Properties |
| 2022 | £271,100 | 5% |
6 Properties |
| 2021 | £257,437 | -13% |
8 Properties |
| 2020 | £290,166 | -1% |
6 Properties |
| 2019 | £293,433 | -12% |
15 Properties |
| 2018 | £328,621 | 19% |
9 Properties |
| 2017 | £267,227 | -13% |
11 Properties |
| 2016 | £300,666 | 19% |
6 Properties |
| 2015 | £244,918 | -1% |
13 Properties |
| 2014 | £248,250 | 29% |
6 Properties |
| 2013 | £176,092 | 10% |
7 Properties |
| 2012 | £158,070 | 4% |
15 Properties |
| 2011 | £151,000 | -45% |
3 Properties |
| 2010 | £219,500 | -3% |
4 Properties |
| 2009 | £225,075 | 7% |
6 Properties |
| 2008 | £209,700 | -21% |
6 Properties |
| 2007 | £253,882 | -15% |
9 Properties |
| 2006 | £292,454 | 11% |
12 Properties |
| 2005 | £261,363 | 42% |
11 Properties |
| 2004 | £152,500 | -30% |
4 Properties |
| 2003 | £198,999 | 42% |
9 Properties |
| 2002 | £116,190 | -33% |
5 Properties |
| 2001 | £154,929 | 13% |
9 Properties |
| 2000 | £135,064 | 26% |
7 Properties |
| 1999 | £100,500 | 18% |
6 Properties |
| 1998 | £82,825 | -15% |
6 Properties |
| 1997 | £95,100 | 18% |
10 Properties |
| 1996 | £78,200 | 15% |
10 Properties |
| 1995 | £66,600 | - |
5 Properties |
Property Price per Property Type in Tuxford And Trent
Here you can find historic sold price data in order to help with your property search.
The average Property Paid Price for specific property types in the last three years are:
| Property Type | Average Sold Price | Sold Properties |
|---|---|---|
| Semi Detached House | £411,250.00 | 2 Semi Detached Houses |
| Detached House | £416,797.00 | 20 Detached Houses |
| Terraced House | £200,900.00 | 4 Terraced Houses |