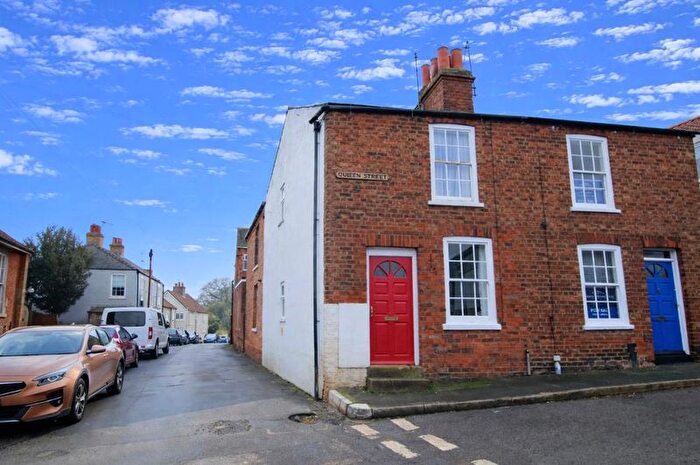
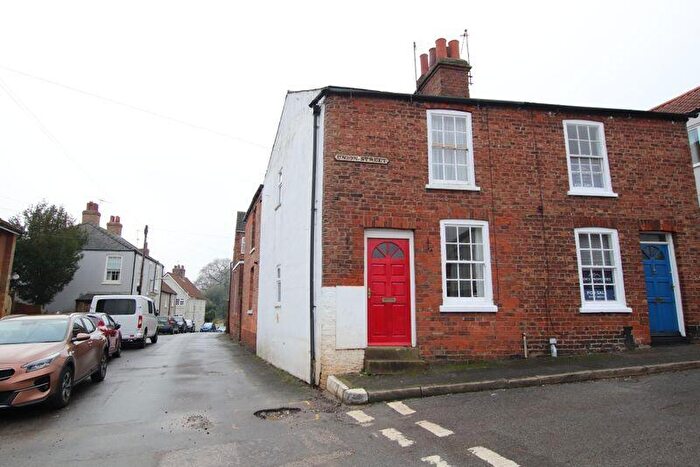
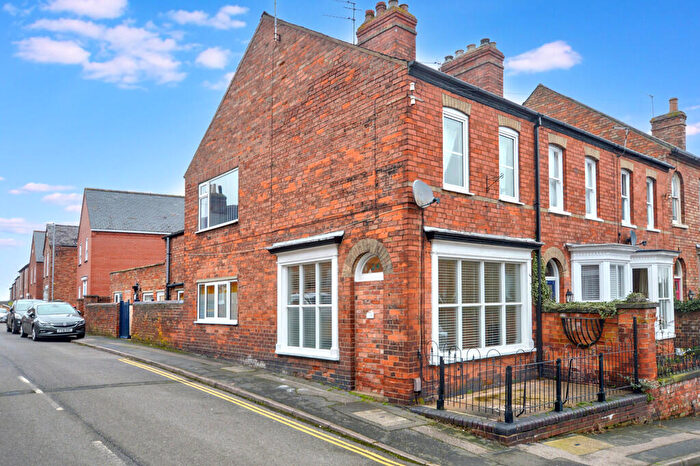
Houses for sale & to rent in North Holme, Louth
House Prices in North Holme
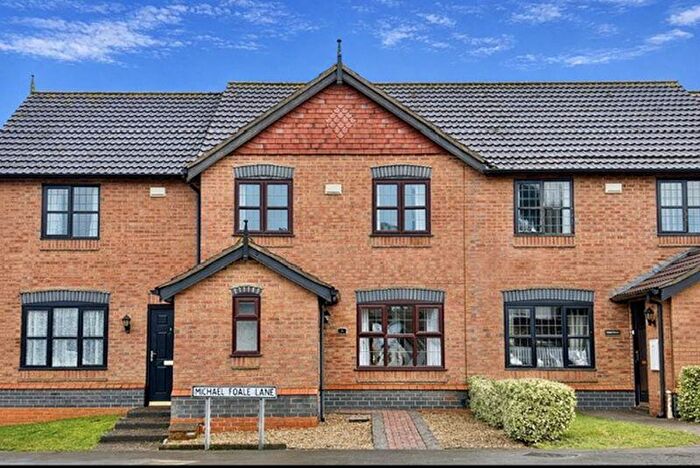
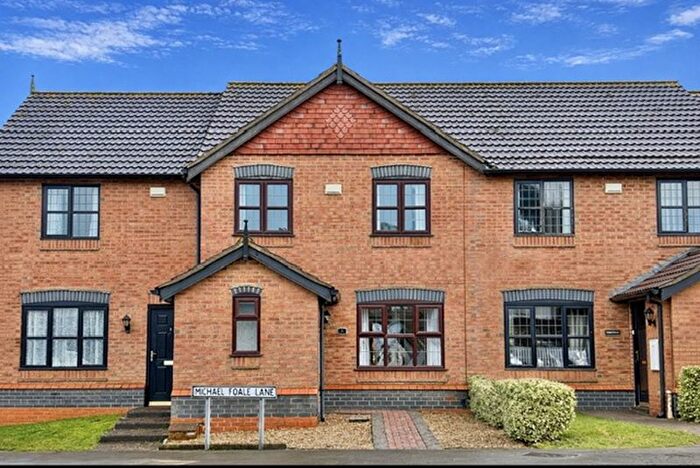
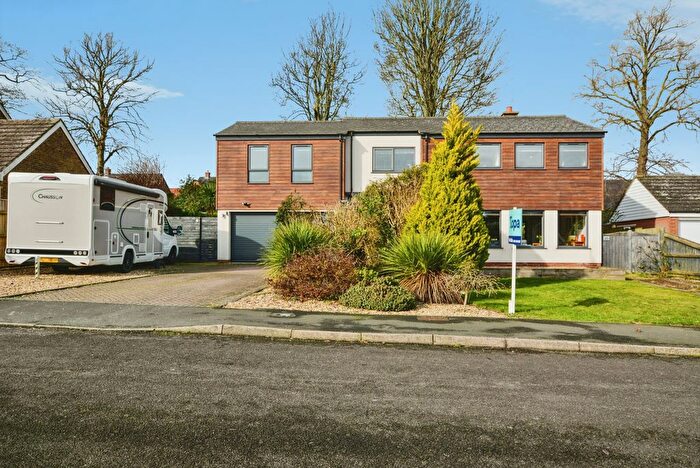
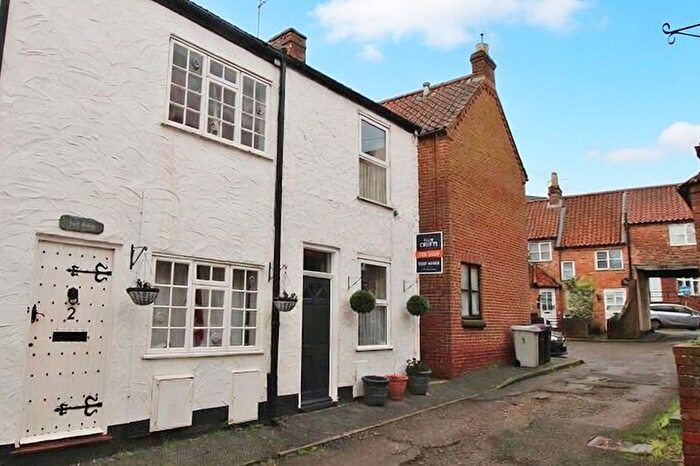
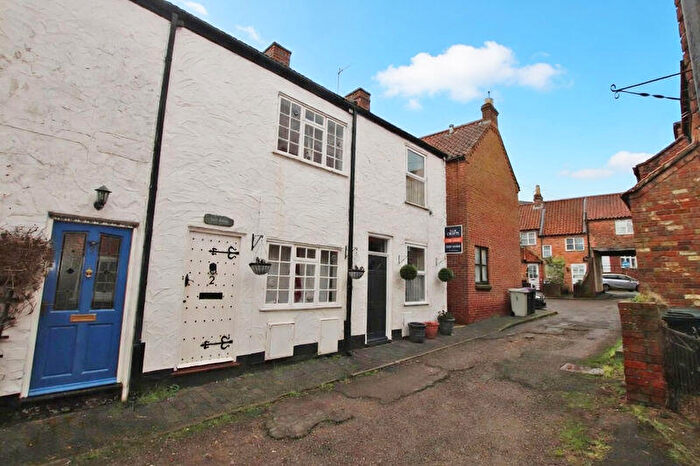
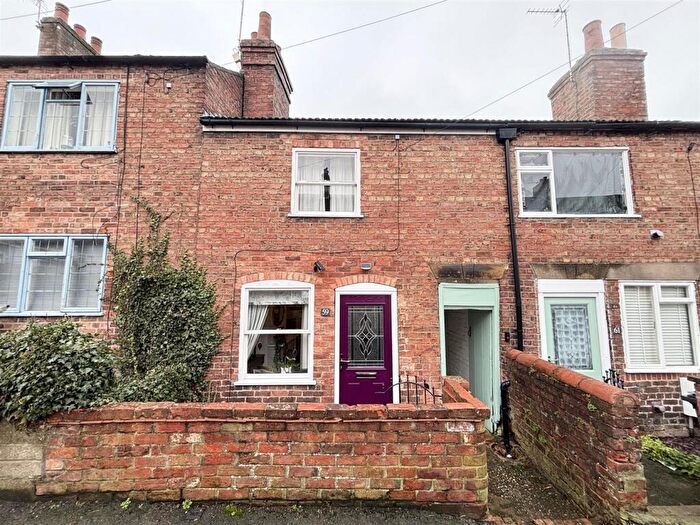
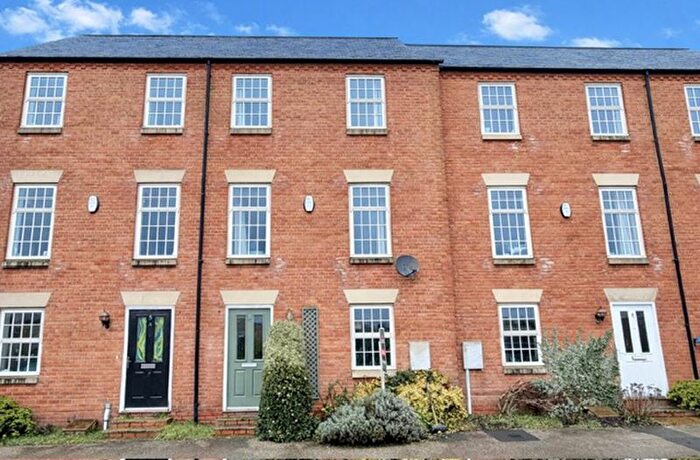
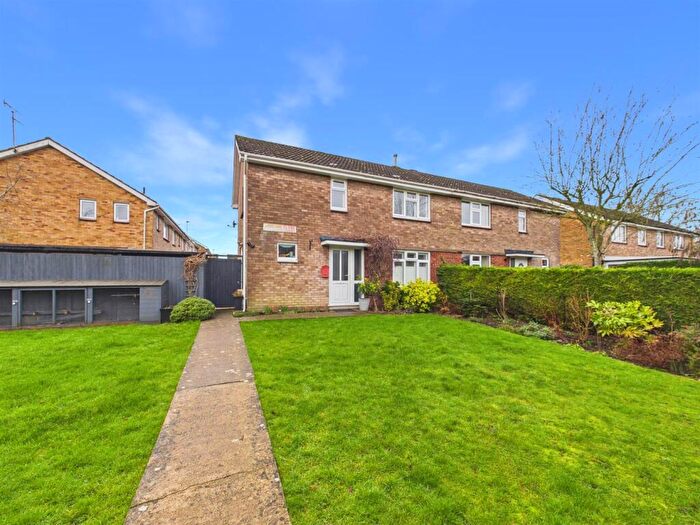
Properties in North Holme have an average house price of £270,254.00 and had 93 Property Transactions within the last 3 years¹.
North Holme is an area in Louth, Lincolnshire with 984 households², where the most expensive property was sold for £2,365,000.00.
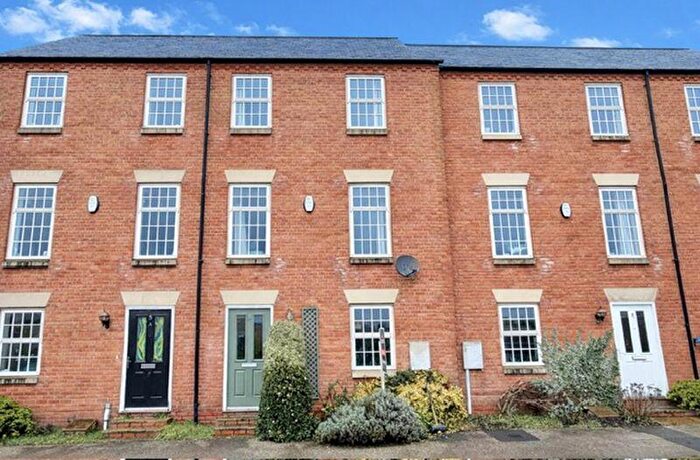
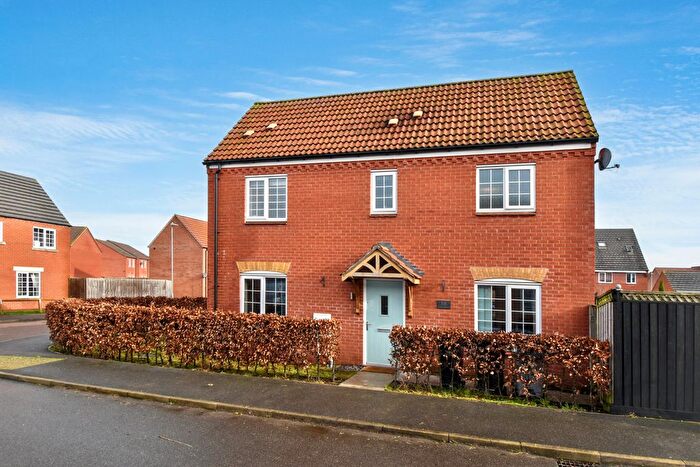
Properties for sale in North Holme
Roads and Postcodes in North Holme
Navigate through our locations to find the location of your next house in North Holme, Louth for sale or to rent.
| Streets | Postcodes |
|---|---|
| Albion Court | LN11 0ZA |
| Althorp Gardens | LN11 0YX |
| Andrews Close | LN11 0BP |
| Arundel Drive | LN11 0HZ |
| Badminton Way | LN11 0YH |
| Bee Orchid Way | LN11 0FP |
| Belton Walk | LN11 0YJ |
| Belvoir Court | LN11 0UD |
| Belvoir Way | LN11 0LQ LN11 0YA LN11 0YF |
| Blenheim Close | LN11 0HX |
| Bluebell Lane | LN11 0FJ |
| Bolingbroke Road | LN11 0WA LN11 0ZW LN11 0GP LN11 0WE |
| Bracken Way | LN11 0GA |
| Brackenborough Road | LN11 0AD LN11 0NP LN11 0AX |
| Brocklesby Walk | LN11 0YL |
| Buckingham Road | LN11 0YU |
| Burghley Crescent | LN11 0HT |
| Chatsworth Drive | LN11 0JA LN11 0JB |
| Cordeaux Close | LN11 0GD |
| Cuppleditch Way | LN11 0UF |
| Daisy Way | LN11 0FS LN11 0FX |
| Dales Close | LN11 0AS |
| Dales Way | LN11 0AF |
| Davey Close | LN11 0AB |
| Fairfield Industrial Estate | LN11 0YQ |
| Fanthorpe Lane | LN11 0EB LN11 0SU |
| Fern Close | LN11 0WH |
| Glamis Place | LN11 0YT |
| Goodwood Close | LN11 0YN |
| Grimsby Road | LN11 0DY LN11 0DZ LN11 0EA LN11 0ED LN11 0SX LN11 0LA LN11 0SY |
| Hardwick Close | LN11 0HY |
| Harewood Crescent | LN11 0JD |
| High Holme Road | LN11 0EX LN11 0FE LN11 0HD LN11 0EU |
| Hill Rise | LN11 0YY |
| Holmes Close | LN11 0HB |
| Howard Fields Way | LN11 0FR |
| Keddington Road | LN11 0AA |
| Lancaster Park | LN11 0ZB |
| Leakes Row | LN11 0JZ |
| Lincoln Way | LN11 0LS |
| Longleat Drive | LN11 0YW |
| Mill Lane | LN11 0EZ |
| Mount Olivet | LN11 0EG |
| North Holme Road | LN11 0HF LN11 0HG LN11 0HL LN11 0HQ LN11 0HS LN11 0JF |
| Northolme Court | LN11 0YS |
| Northolme Road Trading Estate | LN11 0JQ |
| Nottingham Road | LN11 0WB LN11 0WP |
| Richmond Road | LN11 0FU LN11 0ZR |
| Sandringham Drive | LN11 0JE |
| Scarborough Road | LN11 0WD |
| Snowdrop Lane | LN11 0FT |
| St Marys Lane | LN11 0DT |
| St Marys Park | LN11 0EF |
| Tattershall Way | LN11 0HH LN11 0UZ LN11 0YZ |
| Torridon Court | LN11 0WN |
| Wallflower Lane | LN11 0FW |
| Warwick Road | LN11 0YB |
| Welbeck Way | LN11 0HA |
| Windsor Road | LN11 0LF LN11 0YG |
| Wintringham Way | LN11 0ZT |
| Woburn Close | LN11 0HU |
| Woodvale Rise | LN11 0GB |
Transport near North Holme
-
Cleethorpes Station
-
Grimsby Town Station
-
Market Rasen Station
-
New Clee Station
-
Grimsby Docks Station
-
Great Coates Station
- FAQ
- Price Paid By Year
- Property Type Price
Frequently asked questions about North Holme
What is the average price for a property for sale in North Holme?
The average price for a property for sale in North Holme is £270,254. This amount is 8% higher than the average price in Louth. There are 1,358 property listings for sale in North Holme.
What streets have the most expensive properties for sale in North Holme?
The streets with the most expensive properties for sale in North Holme are Howard Fields Way at an average of £1,322,500, St Marys Lane at an average of £540,550 and St Marys Park at an average of £495,600.
What streets have the most affordable properties for sale in North Holme?
The streets with the most affordable properties for sale in North Holme are Warwick Road at an average of £87,500, Burghley Crescent at an average of £120,000 and Longleat Drive at an average of £125,000.
Which train stations are available in or near North Holme?
Some of the train stations available in or near North Holme are Cleethorpes, Grimsby Town and Market Rasen.
Property Price Paid in North Holme by Year
The average sold property price by year was:
| Year | Average Sold Price | Price Change |
Sold Properties
|
|---|---|---|---|
| 2025 | £241,725 | -16% |
33 Properties |
| 2024 | £280,055 | -6% |
40 Properties |
| 2023 | £297,725 | 14% |
20 Properties |
| 2022 | £256,832 | 19% |
56 Properties |
| 2021 | £207,392 | 4% |
53 Properties |
| 2020 | £199,710 | -1% |
56 Properties |
| 2019 | £201,224 | 19% |
53 Properties |
| 2018 | £163,858 | -16% |
22 Properties |
| 2017 | £189,311 | 19% |
35 Properties |
| 2016 | £152,847 | 1% |
27 Properties |
| 2015 | £151,680 | -8% |
27 Properties |
| 2014 | £163,939 | -10% |
23 Properties |
| 2013 | £180,463 | 7% |
34 Properties |
| 2012 | £168,194 | 8% |
17 Properties |
| 2011 | £153,927 | 2% |
29 Properties |
| 2010 | £150,183 | -6% |
27 Properties |
| 2009 | £159,134 | -17% |
26 Properties |
| 2008 | £186,077 | 18% |
18 Properties |
| 2007 | £151,927 | -6% |
29 Properties |
| 2006 | £161,520 | -5% |
46 Properties |
| 2005 | £169,395 | 7% |
35 Properties |
| 2004 | £156,781 | 31% |
52 Properties |
| 2003 | £108,433 | 15% |
39 Properties |
| 2002 | £91,916 | -13% |
49 Properties |
| 2001 | £103,517 | 32% |
34 Properties |
| 2000 | £70,175 | 12% |
29 Properties |
| 1999 | £61,926 | -4% |
41 Properties |
| 1998 | £64,392 | 13% |
25 Properties |
| 1997 | £56,314 | 8% |
42 Properties |
| 1996 | £51,557 | -5% |
42 Properties |
| 1995 | £54,053 | - |
26 Properties |
Property Price per Property Type in North Holme
Here you can find historic sold price data in order to help with your property search.
The average Property Paid Price for specific property types in the last three years are:
| Property Type | Average Sold Price | Sold Properties |
|---|---|---|
| Semi Detached House | £203,146.00 | 49 Semi Detached Houses |
| Detached House | £451,750.00 | 28 Detached Houses |
| Terraced House | £166,107.00 | 14 Terraced Houses |
| Flat | £102,500.00 | 2 Flats |

