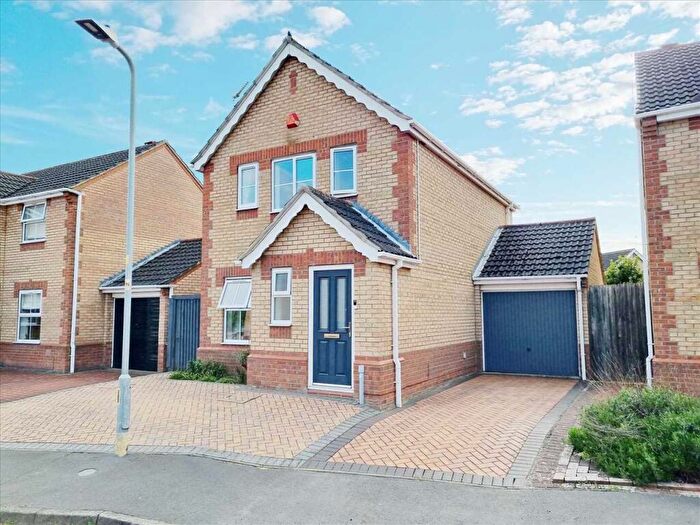
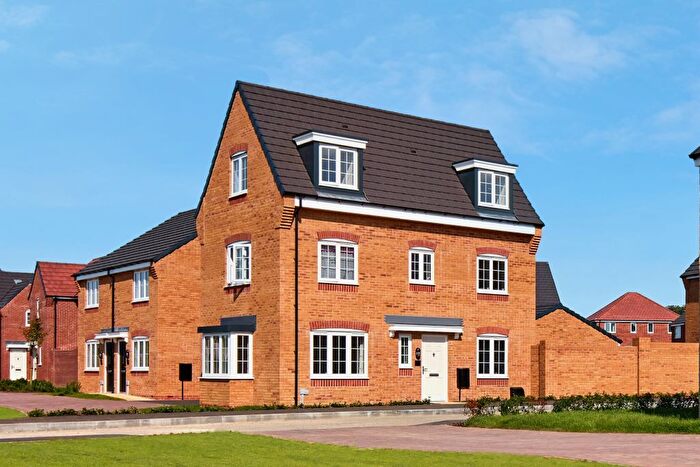
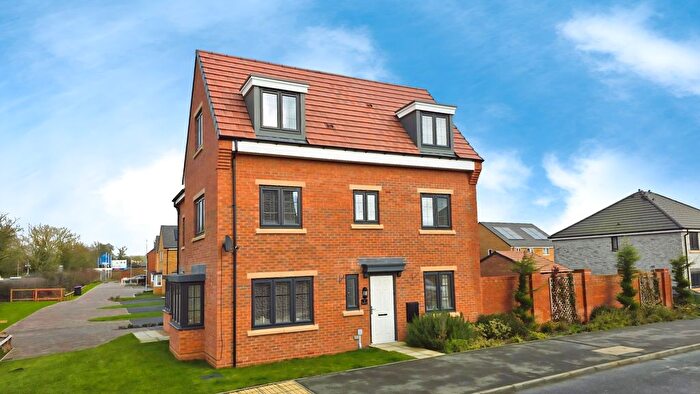
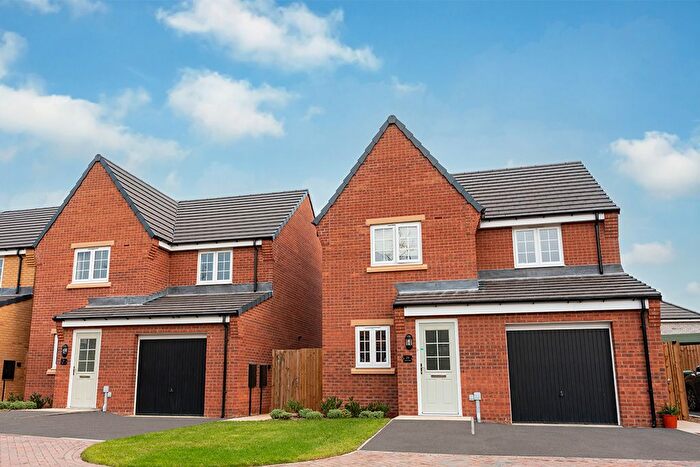
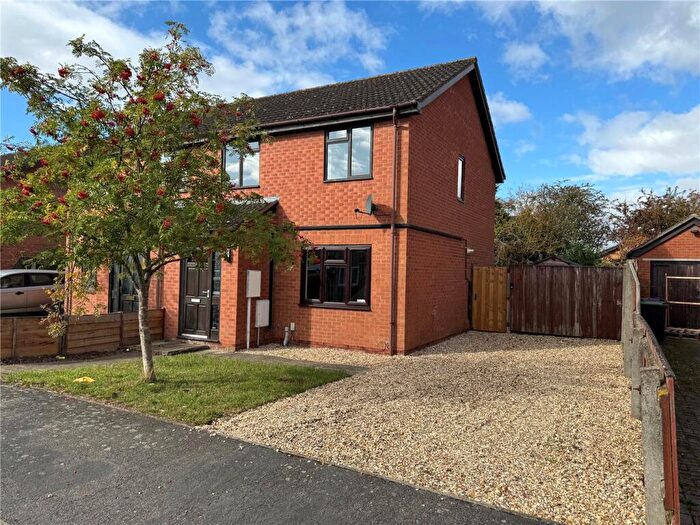
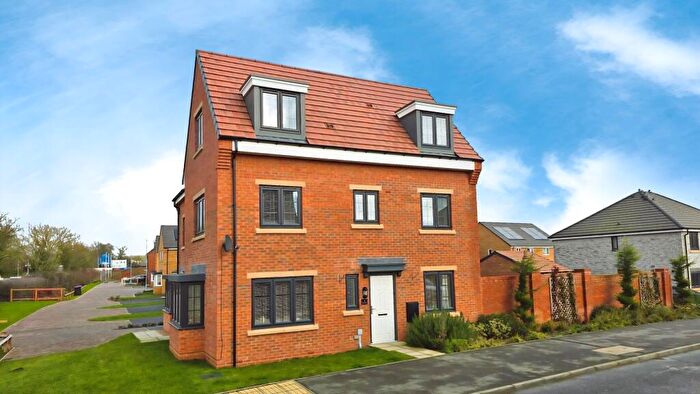
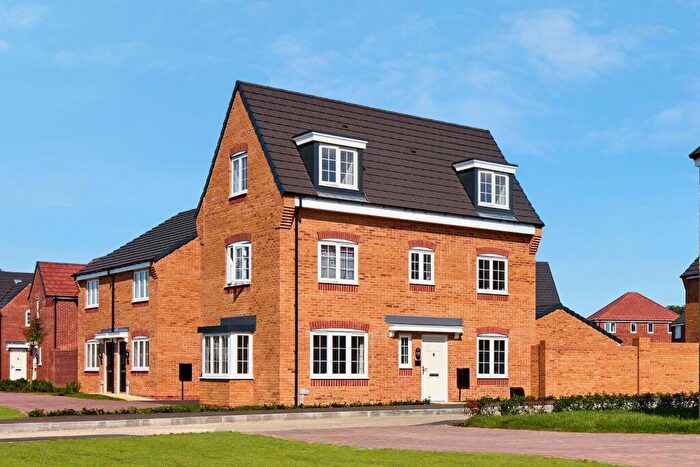
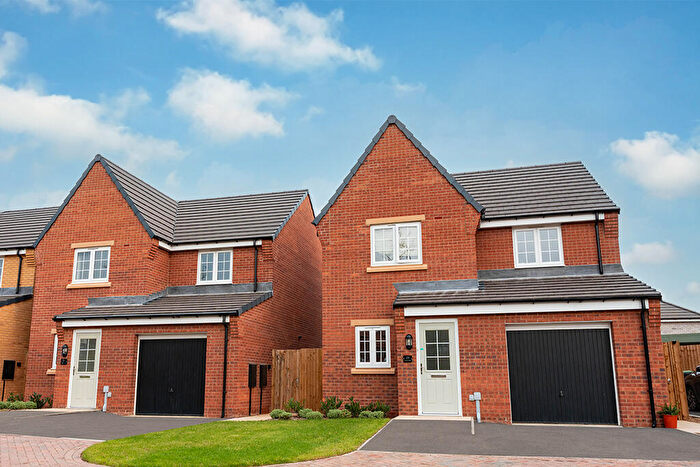
Houses for sale & to rent in Sleaford, Lincolnshire
House Prices in Sleaford
Properties in Sleaford have an average house price of £247,758.00 and had 1,716 Property Transactions within the last 3 years.¹
Sleaford is an area in Lincolnshire with 17,657 households², where the most expensive property was sold for £960,000.00.
Properties for sale in Sleaford
Neighbourhoods in Sleaford
Navigate through our locations to find the location of your next house in Sleaford, Lincolnshire for sale or to rent.
- Ashby De La Launde And Cranwell
- Aveland
- Billinghay, Martin And North Kyme
- Heath
- Heckington Rural
- Kirkby La Thorpe And South Kyme
- Leasingham And Rauceby
- Lincrest
- Osbournby
- Ruskington
- Sleaford Castle
- Sleaford Holdingham
- Sleaford Navigation
- Sleaford Quarrington And Mareham
- Sleaford Westholme
- Toller
- Helpringham & Osbournby
- Sleaford Quarrington & Mareham
- Cranwell, Leasingham & Wilsford
- Kirkby La Thorpe & South Kyme
Transport in Sleaford
Please see below transportation links in this area:
- FAQ
- Price Paid By Year
- Property Type Price
Frequently asked questions about Sleaford
What is the average price for a property for sale in Sleaford?
The average price for a property for sale in Sleaford is £247,758. This amount is 1% higher than the average price in Lincolnshire. There are 7,410 property listings for sale in Sleaford.
What locations have the most expensive properties for sale in Sleaford?
The locations with the most expensive properties for sale in Sleaford are Lincrest at an average of £417,142, Osbournby at an average of £405,220 and Aveland at an average of £401,185.
What locations have the most affordable properties for sale in Sleaford?
The locations with the most affordable properties for sale in Sleaford are Sleaford Castle at an average of £170,746, Sleaford Westholme at an average of £179,911 and Sleaford Navigation at an average of £181,122.
Which train stations are available in or near Sleaford?
Some of the train stations available in or near Sleaford are Sleaford, Rauceby and Ruskington.
Property Price Paid in Sleaford by Year
The average sold property price by year was:
| Year | Average Sold Price | Price Change |
Sold Properties
|
|---|---|---|---|
| 2025 | £253,158 | 3% |
543 Properties |
| 2024 | £244,623 | -1% |
604 Properties |
| 2023 | £245,933 | -2% |
569 Properties |
| 2022 | £250,444 | 6% |
789 Properties |
| 2021 | £236,603 | 6% |
1,017 Properties |
| 2020 | £223,204 | 9% |
768 Properties |
| 2019 | £202,924 | 6% |
848 Properties |
| 2018 | £190,459 | -1% |
874 Properties |
| 2017 | £191,785 | 4% |
914 Properties |
| 2016 | £184,370 | 6% |
892 Properties |
| 2015 | £174,114 | 3% |
918 Properties |
| 2014 | £168,319 | 7% |
899 Properties |
| 2013 | £156,042 | 0,4% |
690 Properties |
| 2012 | £155,376 | 4% |
575 Properties |
| 2011 | £149,860 | -7% |
570 Properties |
| 2010 | £160,844 | 5% |
559 Properties |
| 2009 | £152,298 | -11% |
542 Properties |
| 2008 | £168,997 | -1% |
556 Properties |
| 2007 | £171,010 | 5% |
1,145 Properties |
| 2006 | £162,420 | 7% |
1,238 Properties |
| 2005 | £150,580 | 6% |
1,055 Properties |
| 2004 | £141,306 | 13% |
1,198 Properties |
| 2003 | £123,084 | 19% |
1,353 Properties |
| 2002 | £99,477 | 22% |
1,515 Properties |
| 2001 | £77,962 | 10% |
1,485 Properties |
| 2000 | £69,913 | 9% |
1,365 Properties |
| 1999 | £63,498 | 7% |
1,277 Properties |
| 1998 | £58,795 | 6% |
1,004 Properties |
| 1997 | £55,080 | 2% |
954 Properties |
| 1996 | £53,881 | 5% |
817 Properties |
| 1995 | £51,277 | - |
732 Properties |
Property Price per Property Type in Sleaford
Here you can find historic sold price data in order to help with your property search.
The average Property Paid Price for specific property types in the last three years are:
| Property Type | Average Sold Price | Sold Properties |
|---|---|---|
| Semi Detached House | £195,338.00 | 529 Semi Detached Houses |
| Terraced House | £154,847.00 | 283 Terraced Houses |
| Detached House | £320,583.00 | 850 Detached Houses |
| Flat | £101,888.00 | 54 Flats |

