
Houses for sale & to rent in Leasingham And Rauceby, Sleaford
House Prices in Leasingham And Rauceby
Properties in Leasingham And Rauceby have an average house price of £302k and had 70 Property Transactions within the last 3 years¹.
Leasingham And Rauceby is an area in Sleaford, Lincolnshire with 947 households², where the most expensive property was sold for £750k.
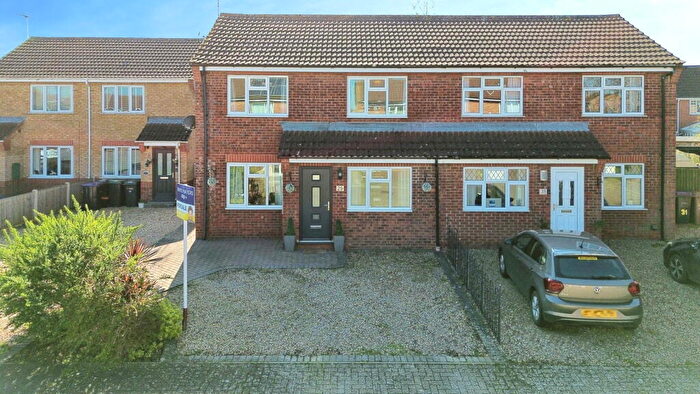
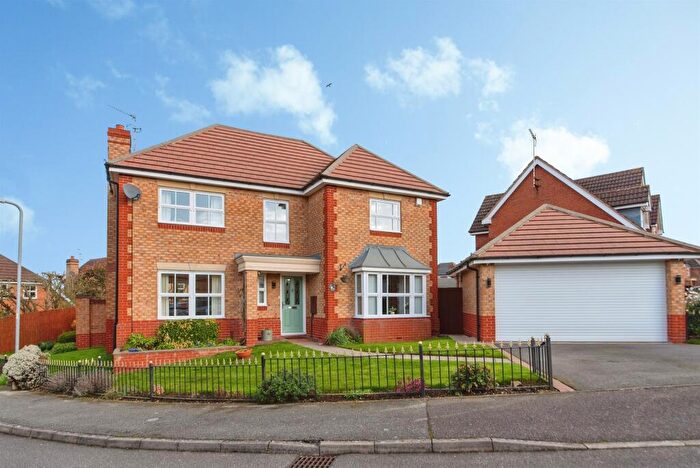
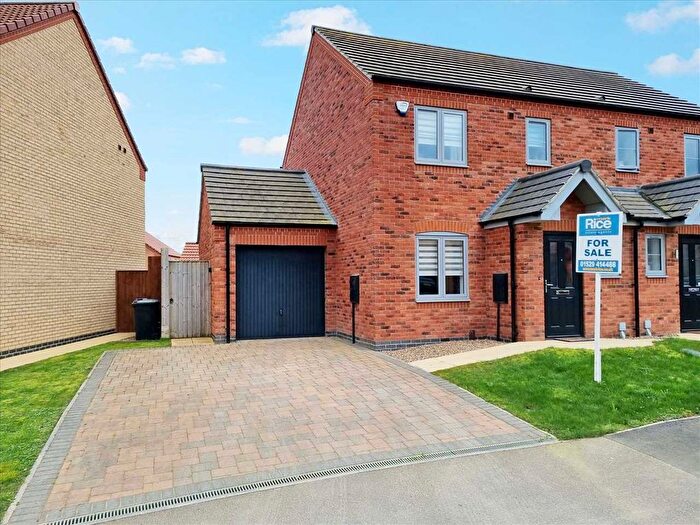
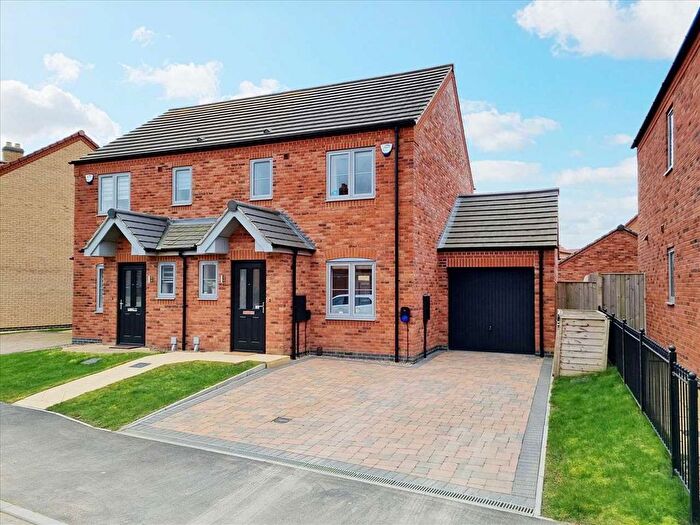
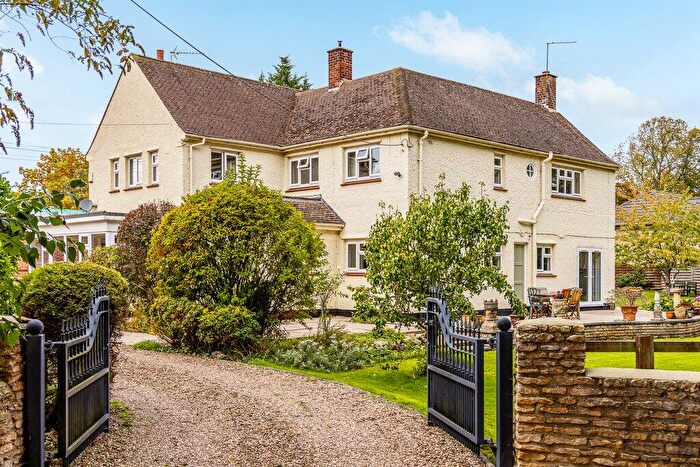
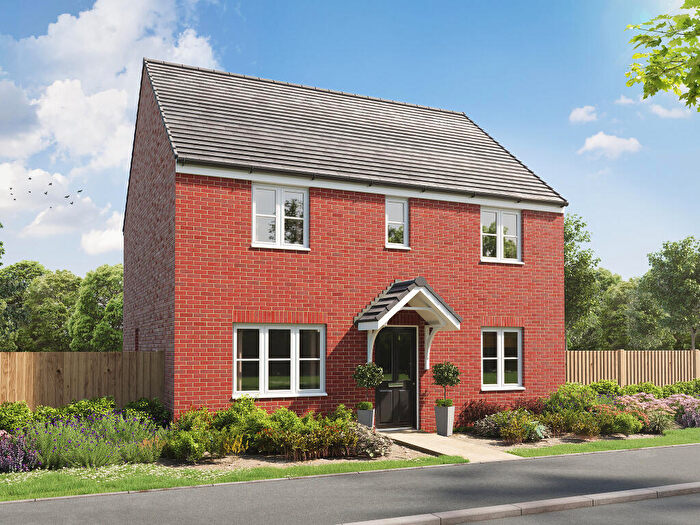
Properties for sale in Leasingham And Rauceby


![]()
If you are looking to sell your house, let it out, or receive a property valuation, an expert can help you.
Click the button below to get started.


Roads and Postcodes in Leasingham And Rauceby
Navigate through our locations to find the location of your next house in Leasingham And Rauceby, Sleaford for sale or to rent.
| Streets | Postcodes |
|---|---|
| Beech Rise | NG34 8PZ |
| Bishops Road | NG34 8NH |
| Bracken Close | NG34 8LX |
| Captains Hill | NG34 8JP |
| Chapel Close | NG34 8QZ |
| Chapel Lane | NG34 8LB NG34 8LD NG34 8QP NG34 8XR |
| Church Lane | NG34 8QT NG34 8QS NG34 8QU |
| Church View | NG34 8HF |
| Cliffe View | NG34 8PY |
| Dean Close | NG34 8NW |
| Deepdale Drive | NG34 8LR |
| Dovecote Rise | NG34 8WZ |
| Flaxwell Way | NG34 8JR |
| Gorse Lane | NG34 8JD |
| Heath Lane | NG34 8JF |
| Jessop Close | NG34 8LJ |
| Juniper Close | NG34 8LY |
| Kirkdale Close | NG34 8NN |
| Lilburn Close | NG34 8NL |
| Lincoln Road | NG34 8JH NG34 8JS NG34 8JT NG34 8JU NG34 8XY |
| Main Street | NG34 8QG NG34 8QQ |
| Manor Close | NG34 8LW |
| Maple Close | NG34 8JE |
| Meadow Lane | NG34 8LL |
| Meadow View | NG34 8YW |
| Middleton Way | NG34 8LN |
| Moor Lane | NG34 8JN NG34 8JW NG34 8SJ |
| New Lane | NG34 8WA |
| Newark Road | NG34 8EU NG34 8ET |
| Pinfold Lane | NG34 8QE NG34 8QD |
| Rauceby Drove | NG34 8QB NG34 8PT |
| Robertson Avenue | NG34 8NJ |
| Rookery Lane | NG34 8JJ |
| Roxholme Road | NG34 8LF NG34 8LG NG34 8NQ |
| Russell Road | NG34 8LQ |
| Sedge Close | NG34 8JB |
| Sleaford Road | NG34 8JL |
| Southgate Spinneys | NG34 8QF |
| Spring Lane | NG34 8JZ |
| St Andrews Crescent | NG34 8LS |
| St Johns Close | NG34 8LU |
| St Peters Close | NG34 8RA |
| The Green | NG34 8LH |
| The Lea | NG34 8JY |
| The Link | NG34 8JX |
| The Maltings | NG34 8GQ |
| The Square | NG34 8LA |
| Thorpe Drove | NG34 8QH |
| Tom Lane | NG34 8QW |
| Wansbeck Road | NG34 8LP |
| Washdyke Lane | NG34 8LE NG34 8LT |
| Westfield Road | NG34 8LZ NG34 8NA |
| NG34 8ND NG34 8QJ NG34 8QL NG34 8QX NG34 8SL NG34 8EX NG34 8NB NG34 8NE NG34 8NF NG34 8NG NG34 8PU NG34 8PX NG34 8QN NG34 8QR NG34 8SH NG34 8SN |
Transport near Leasingham And Rauceby

- FAQ
- Price Paid By Year
- Property Type Price
Frequently asked questions about Leasingham And Rauceby
What is the average price for a property for sale in Leasingham And Rauceby?
The average price for a property for sale in Leasingham And Rauceby is £301,947. This amount is 22% higher than the average price in Sleaford. There are 4,102 property listings for sale in Leasingham And Rauceby.
What streets have the most expensive properties for sale in Leasingham And Rauceby?
The streets with the most expensive properties for sale in Leasingham And Rauceby are Pinfold Lane at an average of £640,000, Main Street at an average of £490,000 and Church Lane at an average of £450,000.
What streets have the most affordable properties for sale in Leasingham And Rauceby?
The streets with the most affordable properties for sale in Leasingham And Rauceby are The Square at an average of £150,000, The Green at an average of £190,000 and Bracken Close at an average of £198,000.
Which train stations are available in or near Leasingham And Rauceby?
Some of the train stations available in or near Leasingham And Rauceby are Sleaford, Rauceby and Ruskington.
Property Price Paid in Leasingham And Rauceby by Year
The average sold property price by year was:
| Year | Average Sold Price | Price Change |
Sold Properties
|
|---|---|---|---|
| 2025 | £310,809 | 11% |
21 Properties |
| 2024 | £275,571 | -14% |
21 Properties |
| 2023 | £315,083 | -7% |
28 Properties |
| 2022 | £337,837 | 11% |
45 Properties |
| 2021 | £299,760 | 5% |
53 Properties |
| 2020 | £283,486 | 24% |
41 Properties |
| 2019 | £214,812 | -7% |
24 Properties |
| 2018 | £228,896 | 0,4% |
38 Properties |
| 2017 | £227,881 | 10% |
38 Properties |
| 2016 | £205,032 | -1% |
39 Properties |
| 2015 | £207,373 | 22% |
41 Properties |
| 2014 | £162,258 | -16% |
50 Properties |
| 2013 | £188,093 | 7% |
38 Properties |
| 2012 | £175,350 | -5% |
25 Properties |
| 2011 | £184,960 | 3% |
30 Properties |
| 2010 | £179,911 | 15% |
18 Properties |
| 2009 | £153,091 | -11% |
34 Properties |
| 2008 | £170,088 | -7% |
22 Properties |
| 2007 | £182,733 | 0,1% |
53 Properties |
| 2006 | £182,461 | -0,4% |
38 Properties |
| 2005 | £183,119 | 13% |
41 Properties |
| 2004 | £158,705 | 8% |
35 Properties |
| 2003 | £146,523 | 21% |
52 Properties |
| 2002 | £115,883 | 19% |
60 Properties |
| 2001 | £93,646 | 12% |
56 Properties |
| 2000 | £82,495 | 19% |
48 Properties |
| 1999 | £66,839 | -7% |
49 Properties |
| 1998 | £71,334 | -9% |
41 Properties |
| 1997 | £77,641 | 17% |
49 Properties |
| 1996 | £64,655 | 24% |
36 Properties |
| 1995 | £48,919 | - |
33 Properties |
Property Price per Property Type in Leasingham And Rauceby
Here you can find historic sold price data in order to help with your property search.
The average Property Paid Price for specific property types in the last three years are:
| Property Type | Average Sold Price | Sold Properties |
|---|---|---|
| Semi Detached House | £216,666.00 | 9 Semi Detached Houses |
| Detached House | £324,506.00 | 58 Detached Houses |
| Terraced House | £134,975.00 | 2 Terraced Houses |
| Flat | £95,000.00 | 1 Flat |