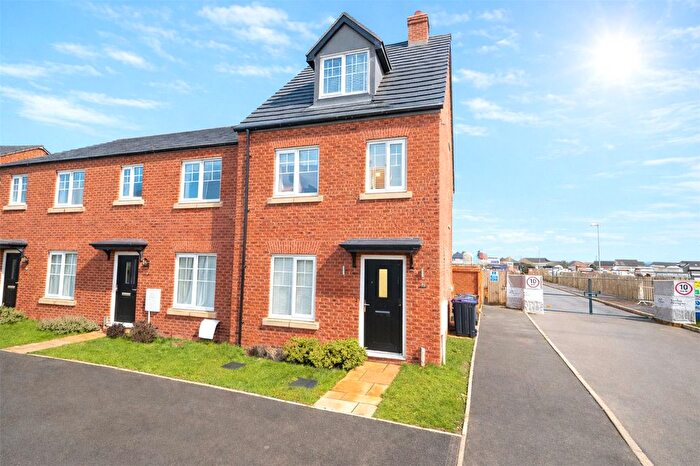
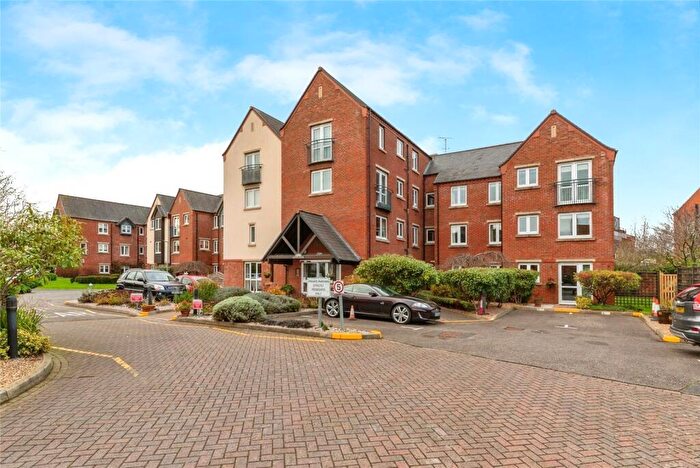
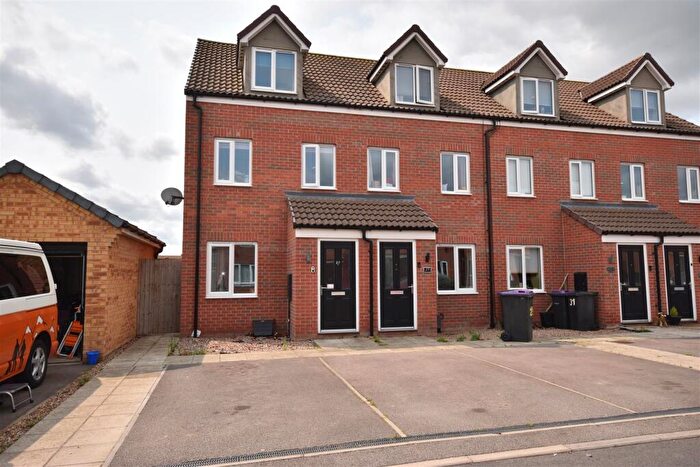
Houses for sale & to rent in Sleaford Westholme, Sleaford
House Prices in Sleaford Westholme
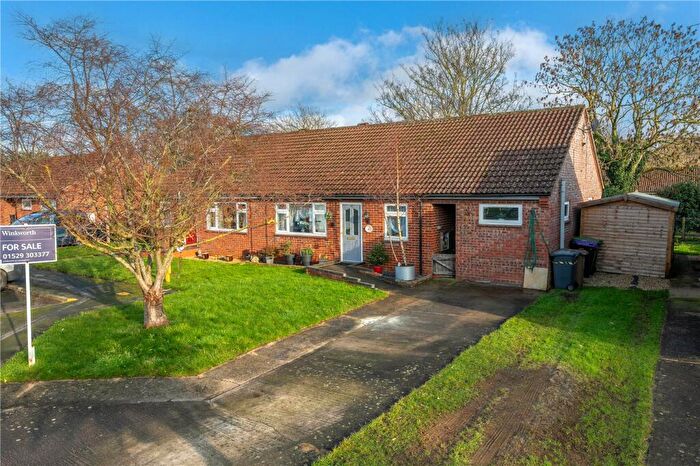
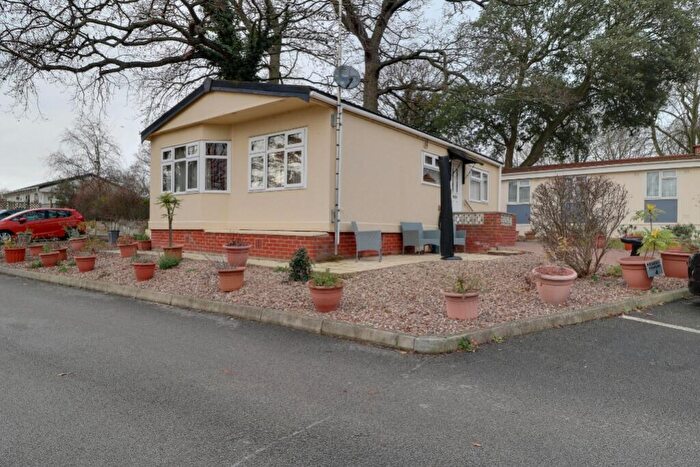
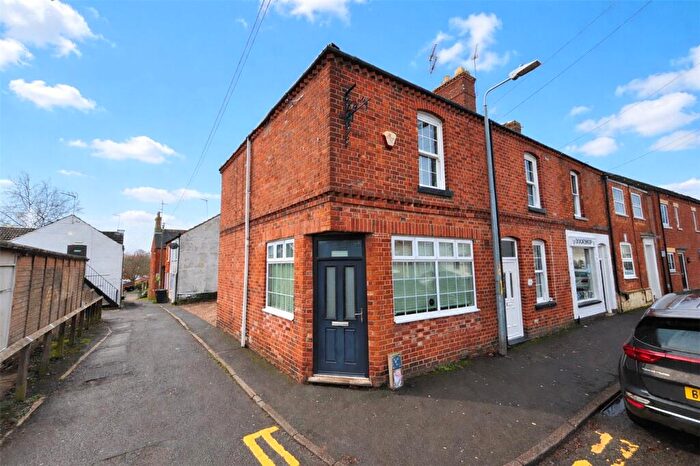
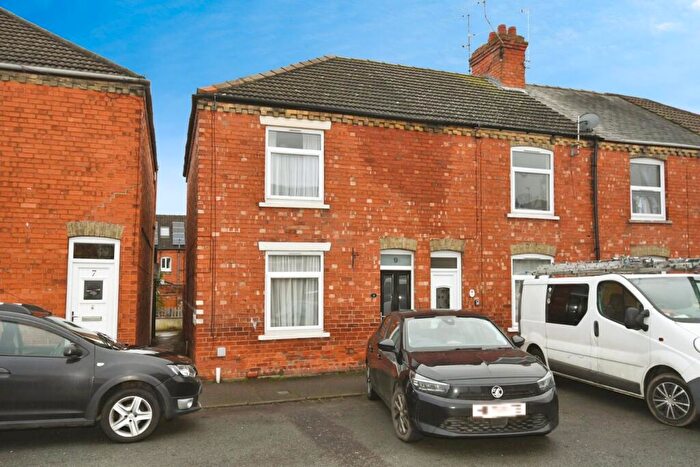
Properties in Sleaford Westholme have an average house price of £179,480.00 and had 93 Property Transactions within the last 3 years¹.
Sleaford Westholme is an area in Sleaford, Lincolnshire with 1,152 households², where the most expensive property was sold for £340,000.00.
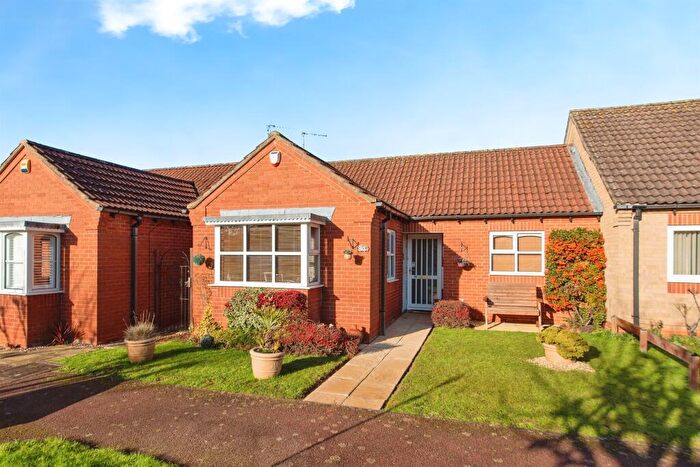
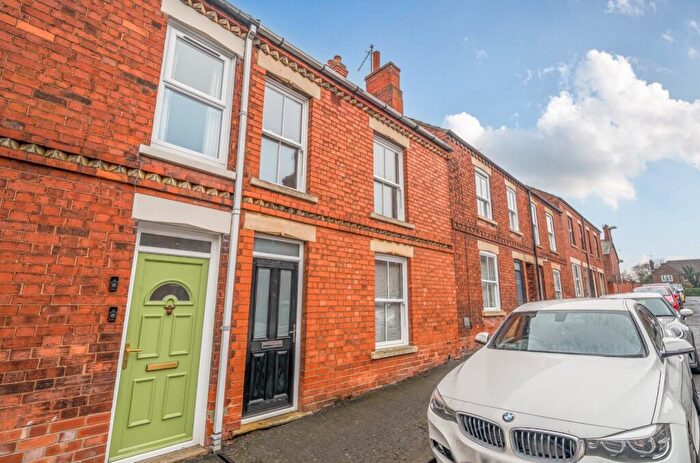
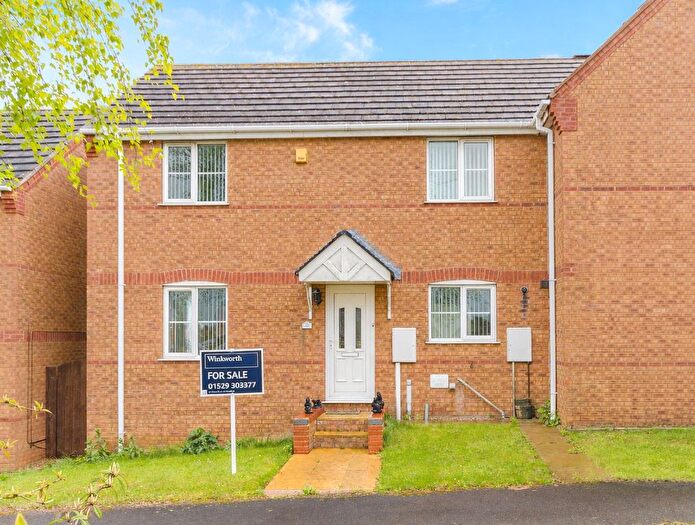
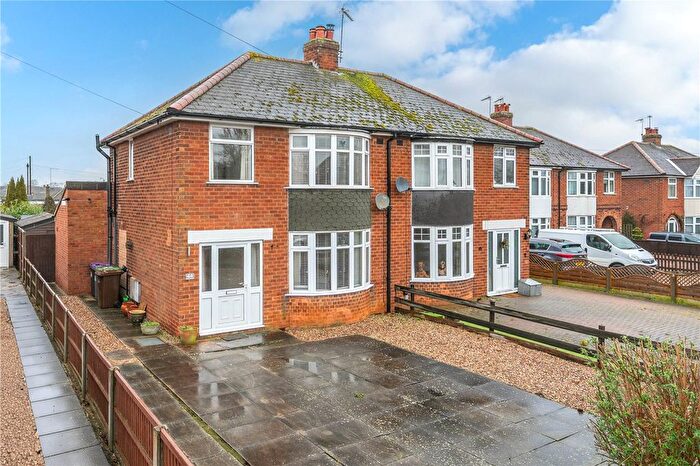
Properties for sale in Sleaford Westholme
Roads and Postcodes in Sleaford Westholme
Navigate through our locations to find the location of your next house in Sleaford Westholme, Sleaford for sale or to rent.
| Streets | Postcodes |
|---|---|
| Bishops Court | NG34 7BQ |
| Bristol Way | NG34 7AE |
| Charles Street | NG34 7QY |
| Claybergh Drive | NG34 7BG |
| Drove Lane | NG34 8FT |
| Elmore Close | NG34 7QS |
| Franklin Crescent | NG34 7AH |
| Galley Hill Close | NG34 7RX |
| Lafford Court | NG34 7BD |
| Leicester Street | NG34 7PS |
| Lincoln Road | NG34 8AD NG34 8AE |
| Linwood Close | NG34 8AQ |
| Manor Place | NG34 7AR |
| Market Place | NG34 7SA NG34 7SB |
| Meadowfield | NG34 7AZ NG34 7BA |
| Millfield Terrace | NG34 7AD |
| Newfield Road | NG34 7AX NG34 7AY |
| Newton Way | NG34 7AJ |
| North Parade | NG34 8AH NG34 8AJ NG34 8AL NG34 8AN NG34 8AP NG34 8AW |
| North Road | NG34 7AW |
| Northgate | NG34 7AQ NG34 7BH NG34 7BN NG34 7BS NG34 7BX NG34 7AF NG34 7BB NG34 7BW NG34 7DD NG34 7EL |
| Northwood Drive | NG34 8AF |
| Playhouse Yard | NG34 7YP |
| Reform Place | NG34 7QR |
| Robertson Drive | NG34 7AL NG34 7AN |
| Spring Gardens | NG34 7AU |
| St Denys Avenue | NG34 8AR NG34 8AS |
| Tennyson Avenue | NG34 7AG |
| The Drove | NG34 7AP NG34 7AS NG34 8JQ NG34 7AT |
| The Hedgerows | NG34 8RE |
| The Paddock | NG34 7WB |
| Toft Lane | NG34 7YQ |
| Walton Cottages | NG34 7QX |
| Watergate | NG34 7PG NG34 7TB |
| Welby Close | NG34 7BP |
| Westgate | NG34 7PJ NG34 7PN NG34 7PP NG34 7PU NG34 7PW NG34 7QU NG34 7QZ NG34 7QT NG34 7RJ |
| Westgate Park | NG34 7QP |
Transport near Sleaford Westholme
- FAQ
- Price Paid By Year
- Property Type Price
Frequently asked questions about Sleaford Westholme
What is the average price for a property for sale in Sleaford Westholme?
The average price for a property for sale in Sleaford Westholme is £179,480. This amount is 28% lower than the average price in Sleaford. There are 1,462 property listings for sale in Sleaford Westholme.
What streets have the most expensive properties for sale in Sleaford Westholme?
The streets with the most expensive properties for sale in Sleaford Westholme are Northwood Drive at an average of £238,200, North Parade at an average of £224,305 and St Denys Avenue at an average of £223,100.
What streets have the most affordable properties for sale in Sleaford Westholme?
The streets with the most affordable properties for sale in Sleaford Westholme are The Hedgerows at an average of £74,200, Leicester Street at an average of £99,000 and Playhouse Yard at an average of £121,750.
Which train stations are available in or near Sleaford Westholme?
Some of the train stations available in or near Sleaford Westholme are Sleaford, Rauceby and Ruskington.
Property Price Paid in Sleaford Westholme by Year
The average sold property price by year was:
| Year | Average Sold Price | Price Change |
Sold Properties
|
|---|---|---|---|
| 2025 | £186,541 | 8% |
23 Properties |
| 2024 | £172,394 | -6% |
38 Properties |
| 2023 | £182,821 | 7% |
32 Properties |
| 2022 | £169,956 | 8% |
36 Properties |
| 2021 | £157,021 | -11% |
42 Properties |
| 2020 | £173,853 | 17% |
45 Properties |
| 2019 | £144,842 | 11% |
39 Properties |
| 2018 | £129,625 | 9% |
37 Properties |
| 2017 | £118,091 | -6% |
56 Properties |
| 2016 | £125,734 | 2% |
44 Properties |
| 2015 | £123,090 | -2% |
47 Properties |
| 2014 | £125,018 | 4% |
50 Properties |
| 2013 | £119,580 | 5% |
33 Properties |
| 2012 | £113,620 | -2% |
25 Properties |
| 2011 | £115,765 | 6% |
30 Properties |
| 2010 | £109,030 | -7% |
25 Properties |
| 2009 | £116,926 | -11% |
30 Properties |
| 2008 | £130,058 | 1% |
35 Properties |
| 2007 | £129,144 | 4% |
59 Properties |
| 2006 | £123,830 | -6% |
50 Properties |
| 2005 | £131,555 | 16% |
48 Properties |
| 2004 | £110,318 | 9% |
45 Properties |
| 2003 | £100,083 | 25% |
57 Properties |
| 2002 | £75,371 | 28% |
57 Properties |
| 2001 | £54,342 | 1% |
65 Properties |
| 2000 | £53,970 | 11% |
43 Properties |
| 1999 | £48,104 | -6% |
58 Properties |
| 1998 | £51,060 | 4% |
49 Properties |
| 1997 | £49,201 | 6% |
50 Properties |
| 1996 | £46,020 | 17% |
54 Properties |
| 1995 | £38,305 | - |
41 Properties |
Property Price per Property Type in Sleaford Westholme
Here you can find historic sold price data in order to help with your property search.
The average Property Paid Price for specific property types in the last three years are:
| Property Type | Average Sold Price | Sold Properties |
|---|---|---|
| Semi Detached House | £199,433.00 | 42 Semi Detached Houses |
| Detached House | £226,522.00 | 22 Detached Houses |
| Terraced House | £123,976.00 | 21 Terraced Houses |
| Flat | £91,062.00 | 8 Flats |

