Houses for sale & to rent in Kirkby La Thorpe And South Kyme, Sleaford
House Prices in Kirkby La Thorpe And South Kyme
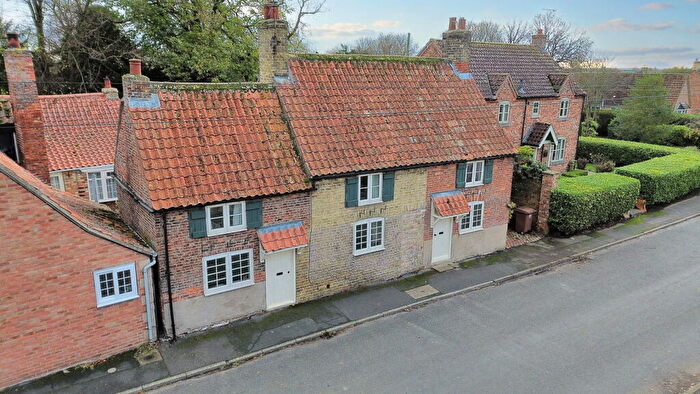
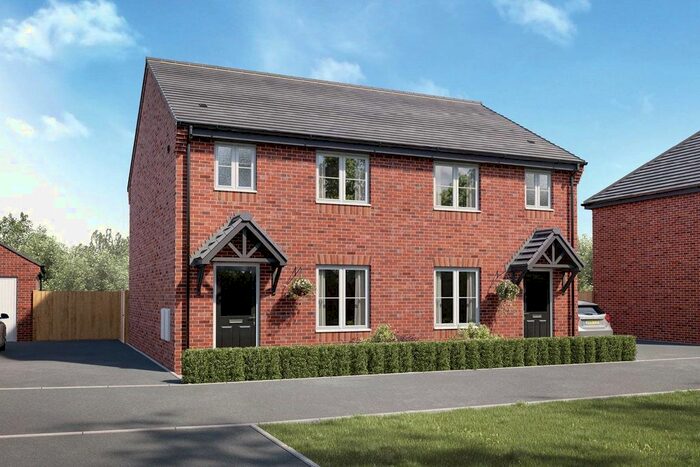
Properties in Kirkby La Thorpe And South Kyme have an average house price of £314,327.00 and had 96 Property Transactions within the last 3 years¹.
Kirkby La Thorpe And South Kyme is an area in Sleaford, Lincolnshire with 799 households², where the most expensive property was sold for £910,000.00.
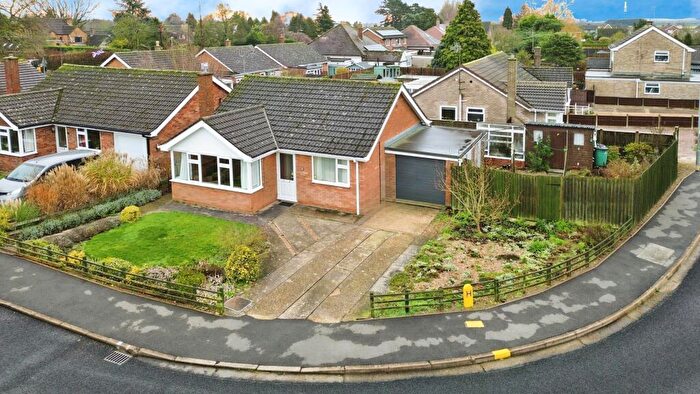
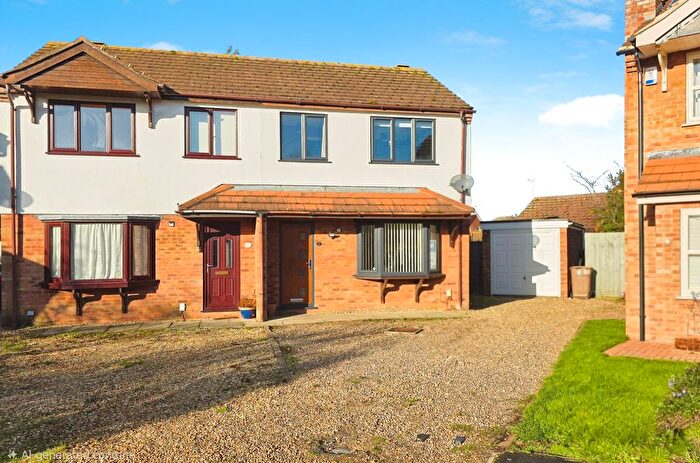
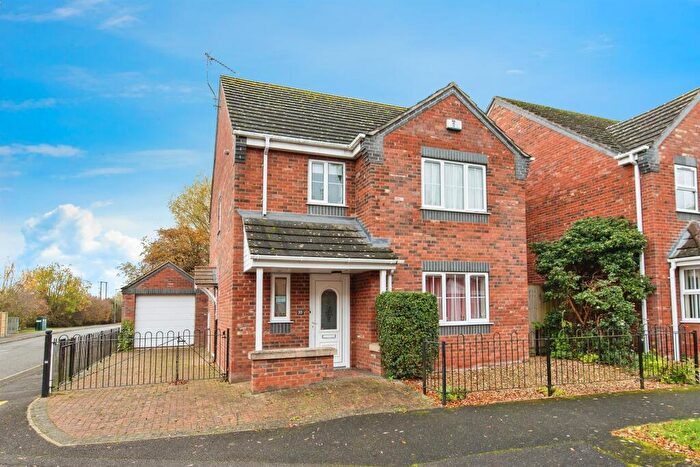
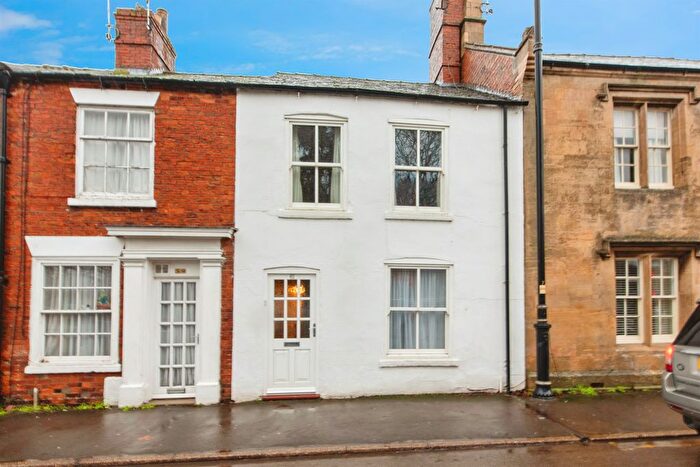
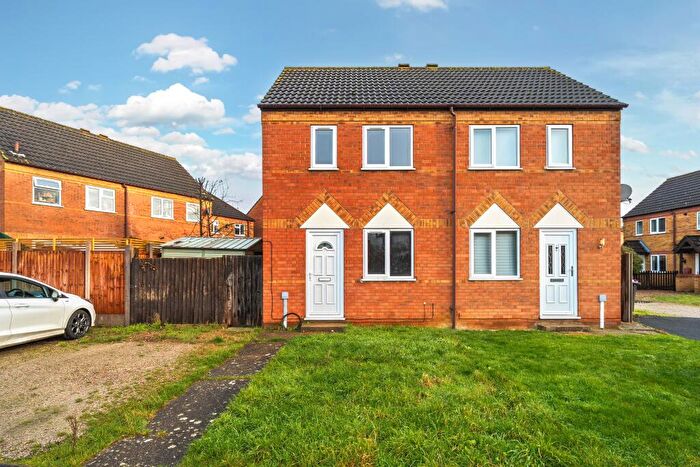
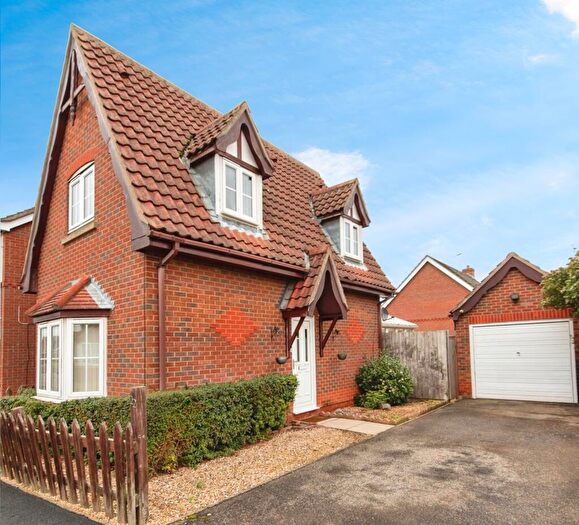
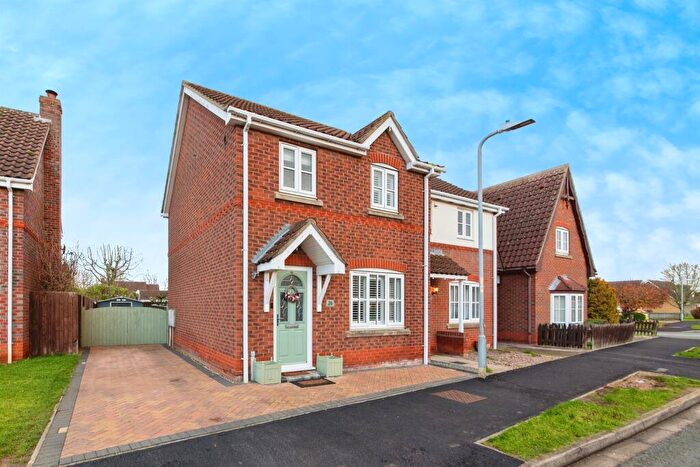
Properties for sale in Kirkby La Thorpe And South Kyme
Roads and Postcodes in Kirkby La Thorpe And South Kyme
Navigate through our locations to find the location of your next house in Kirkby La Thorpe And South Kyme, Sleaford for sale or to rent.
| Streets | Postcodes |
|---|---|
| Anwick Drive | NG34 9TU |
| Anwick Fen | NG34 9SY |
| Asgarby Road | NG34 9PW |
| Boston Road | NG34 9GH |
| Boughton Cottage | NG34 9QB |
| Bramling Way | NG34 7TS NG34 7ZJ |
| Burns Crescent | NG34 7GD |
| Byron Close | NG34 7FX |
| Centurion Close | NG34 7PH |
| Chapel Lane | NG34 9SX |
| Chaucer Gardens | NG34 7FY |
| Church Lane | NG34 9NU NG34 9SS NG34 9ST |
| Coleridge Gardens | NG34 7FQ |
| Daisyfield Lane | NG34 7ZP |
| Eliot Close | NG34 7FW |
| Empire Court | NG34 7ZS |
| Evedon Road | NG34 9NY |
| Ewerby Road | NG34 9NX |
| Field Lane | NG34 9PQ |
| Formans Lane | NG34 9SR |
| Forum Way | NG34 7FF |
| Golden Close | NG34 9TZ |
| Haverholme Park | NG34 9PF |
| Heckington Road | NG34 9PX NG34 9PZ |
| Howell Fen Drove | NG34 9PU |
| Keats Drive | NG34 7JA |
| Kipling Drive | NG34 7FN |
| Main Road | NG34 9SH NG34 9SJ NG34 9SU NG34 9SL |
| Main Street | NG34 9PH NG34 9PJ NG34 9PN |
| Maltkiln Close | NG34 7ZH |
| Milton Way | NG34 7GE |
| Mount Lane | NG34 9NR NG34 9NS |
| Old Black Drove | NG34 9SZ |
| Papermill Lane | NG34 9PD |
| Park Lane | NG34 9PG |
| Princess Square | NG34 9SN |
| Railway Cottages | NG34 9NN |
| River Lane | NG34 9SP |
| School Crescent | NG34 9SW |
| Shelley Drive | NG34 7GB |
| St Ediths Close | NG34 9QG |
| The Hoplands | NG34 7HZ NG34 7LZ |
| Thorpe Road | NG34 9PP |
| Wheelwright Court | NG34 9UA |
| Wordsworth Court | NG34 7JH |
| NG34 9PA NG34 9PB NG34 9PR NG34 9PS NG34 9PT NG34 9QF NG34 0BJ NG34 9PL NG34 9QD NG34 9QE |
Transport near Kirkby La Thorpe And South Kyme
- FAQ
- Price Paid By Year
- Property Type Price
Frequently asked questions about Kirkby La Thorpe And South Kyme
What is the average price for a property for sale in Kirkby La Thorpe And South Kyme?
The average price for a property for sale in Kirkby La Thorpe And South Kyme is £314,327. This amount is 26% higher than the average price in Sleaford. There are 1,414 property listings for sale in Kirkby La Thorpe And South Kyme.
What streets have the most expensive properties for sale in Kirkby La Thorpe And South Kyme?
The streets with the most expensive properties for sale in Kirkby La Thorpe And South Kyme are Ewerby Road at an average of £611,762, Main Street at an average of £441,142 and Church Lane at an average of £402,500.
What streets have the most affordable properties for sale in Kirkby La Thorpe And South Kyme?
The streets with the most affordable properties for sale in Kirkby La Thorpe And South Kyme are Maltkiln Close at an average of £95,000, Bramling Way at an average of £163,071 and River Lane at an average of £163,333.
Which train stations are available in or near Kirkby La Thorpe And South Kyme?
Some of the train stations available in or near Kirkby La Thorpe And South Kyme are Ruskington, Sleaford and Heckington.
Property Price Paid in Kirkby La Thorpe And South Kyme by Year
The average sold property price by year was:
| Year | Average Sold Price | Price Change |
Sold Properties
|
|---|---|---|---|
| 2025 | £327,766 | 2% |
15 Properties |
| 2024 | £320,269 | -3% |
26 Properties |
| 2023 | £328,418 | 11% |
25 Properties |
| 2022 | £290,716 | 7% |
30 Properties |
| 2021 | £269,813 | -3% |
34 Properties |
| 2020 | £278,894 | 9% |
29 Properties |
| 2019 | £253,800 | 3% |
23 Properties |
| 2018 | £246,377 | 13% |
36 Properties |
| 2017 | £213,544 | 8% |
43 Properties |
| 2016 | £197,381 | -12% |
41 Properties |
| 2015 | £220,815 | 16% |
45 Properties |
| 2014 | £186,191 | -4% |
41 Properties |
| 2013 | £194,267 | 3% |
26 Properties |
| 2012 | £187,684 | 3% |
18 Properties |
| 2011 | £181,572 | -8% |
20 Properties |
| 2010 | £195,842 | 8% |
19 Properties |
| 2009 | £180,838 | -15% |
25 Properties |
| 2008 | £208,847 | 20% |
18 Properties |
| 2007 | £167,528 | -11% |
42 Properties |
| 2006 | £186,163 | 16% |
53 Properties |
| 2005 | £156,523 | -6% |
58 Properties |
| 2004 | £165,412 | 18% |
65 Properties |
| 2003 | £136,100 | 15% |
49 Properties |
| 2002 | £115,487 | 11% |
58 Properties |
| 2001 | £103,235 | 22% |
43 Properties |
| 2000 | £80,351 | 12% |
49 Properties |
| 1999 | £71,033 | -3% |
31 Properties |
| 1998 | £73,228 | -1% |
37 Properties |
| 1997 | £74,023 | -2% |
64 Properties |
| 1996 | £75,158 | 8% |
50 Properties |
| 1995 | £69,517 | - |
37 Properties |
Property Price per Property Type in Kirkby La Thorpe And South Kyme
Here you can find historic sold price data in order to help with your property search.
The average Property Paid Price for specific property types in the last three years are:
| Property Type | Average Sold Price | Sold Properties |
|---|---|---|
| Semi Detached House | £189,811.00 | 21 Semi Detached Houses |
| Detached House | £363,991.00 | 70 Detached Houses |
| Terraced House | £142,000.00 | 5 Terraced Houses |

