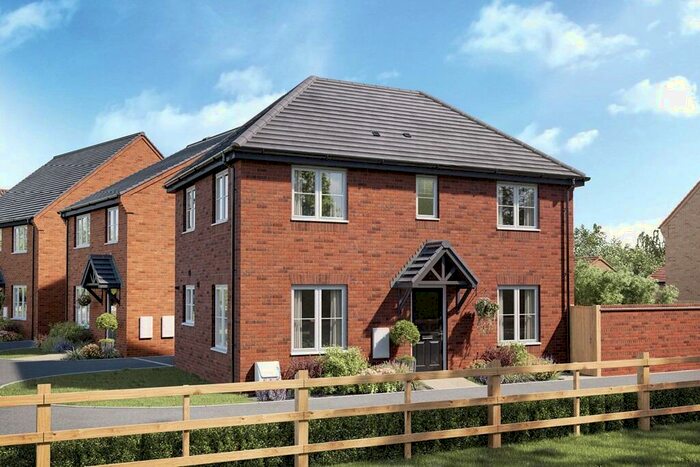
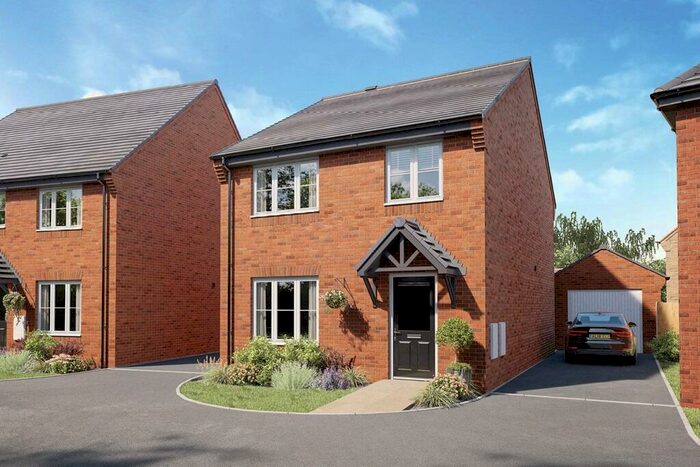
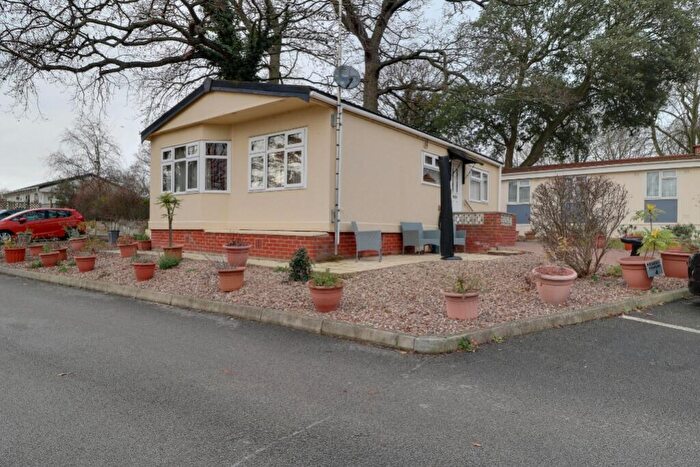
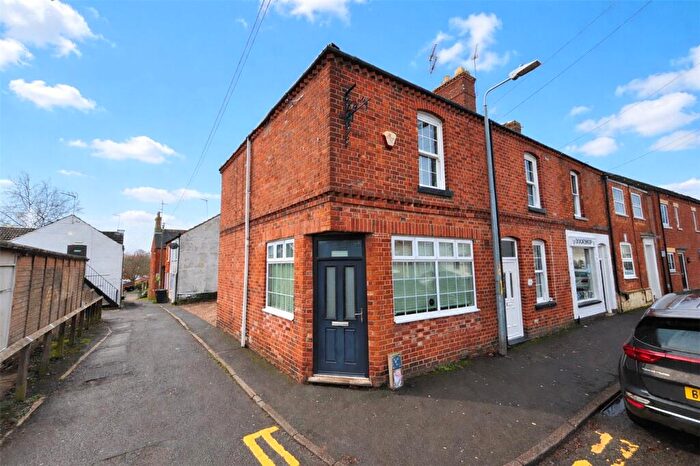
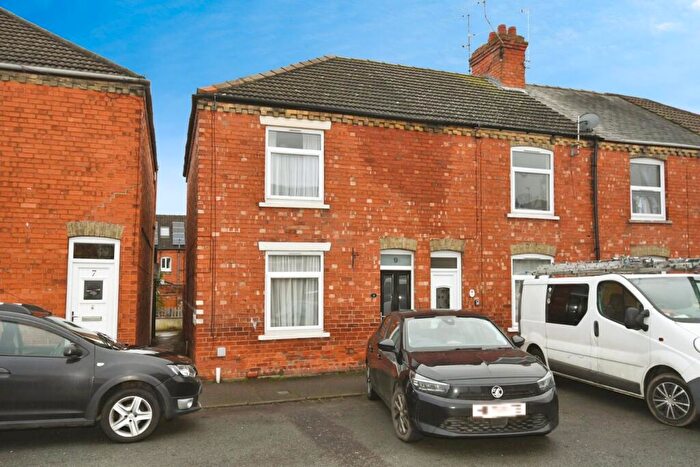
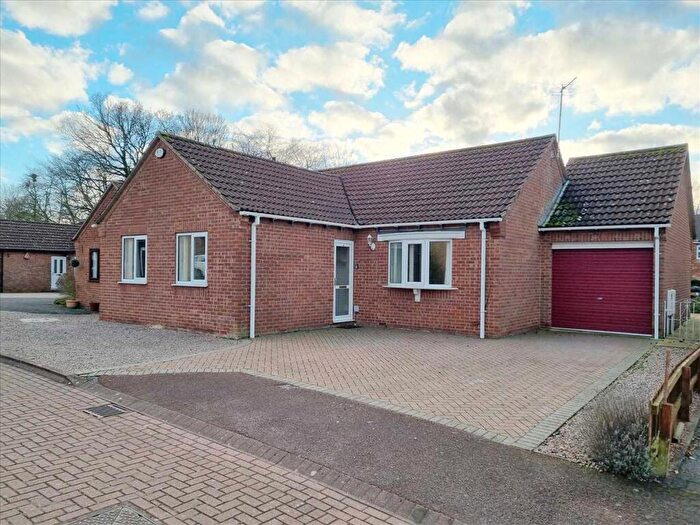
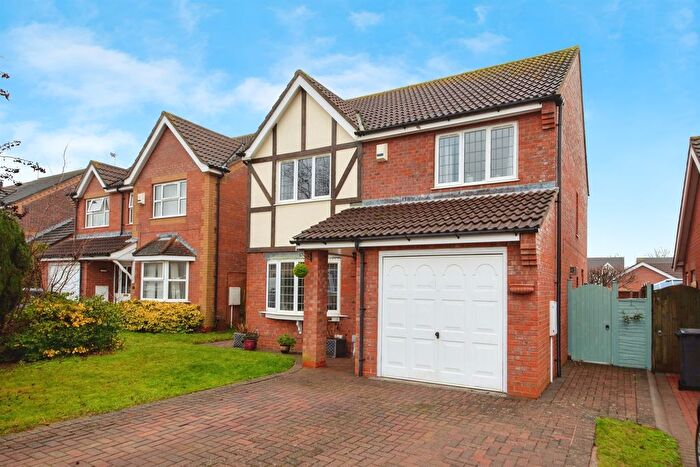
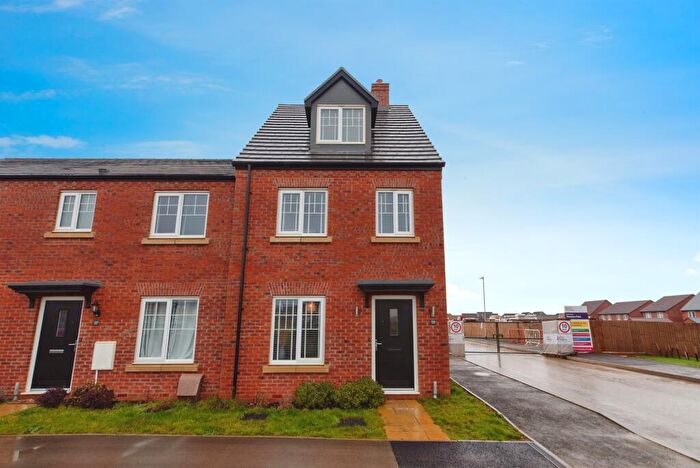
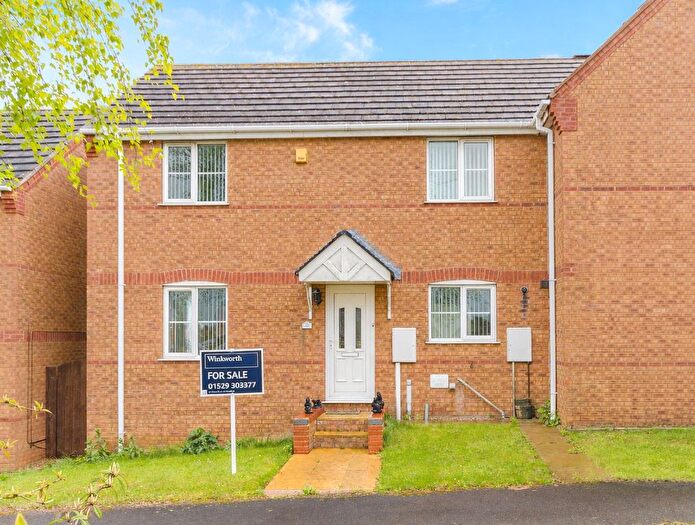
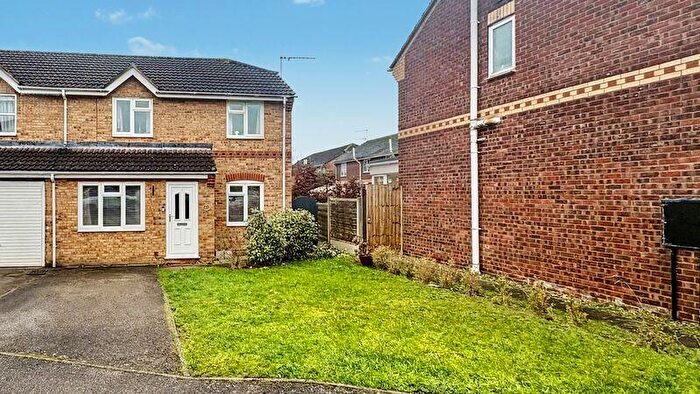
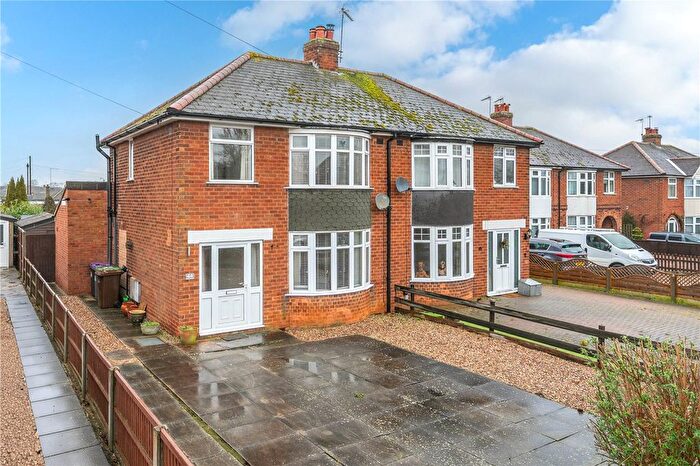
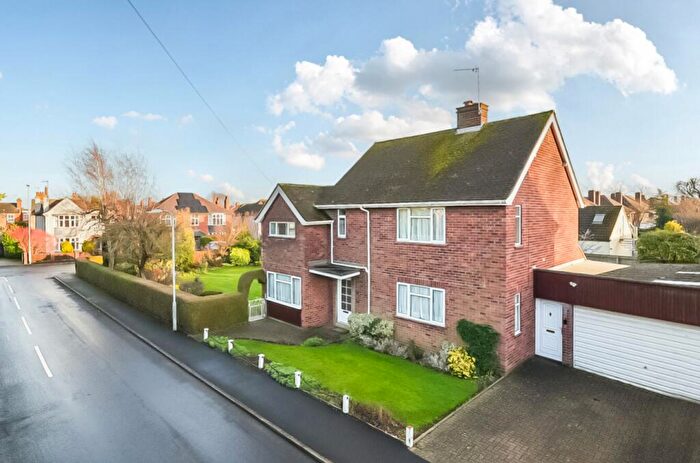
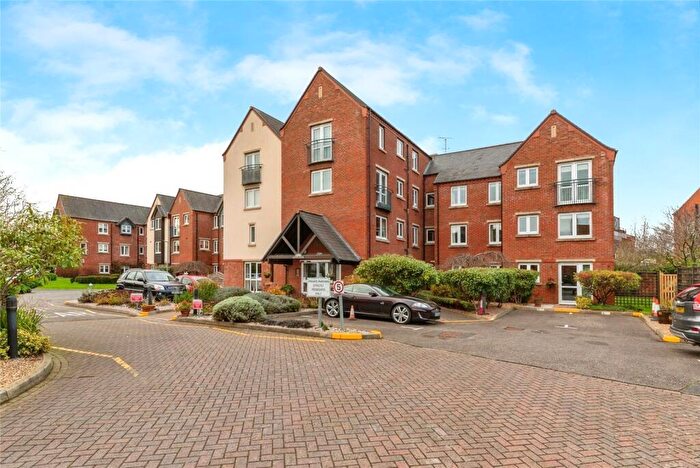
Houses for sale & to rent in Sleaford Castle, Sleaford
House Prices in Sleaford Castle
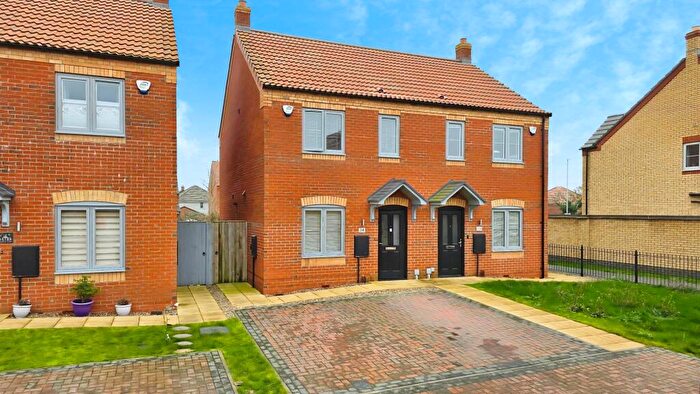
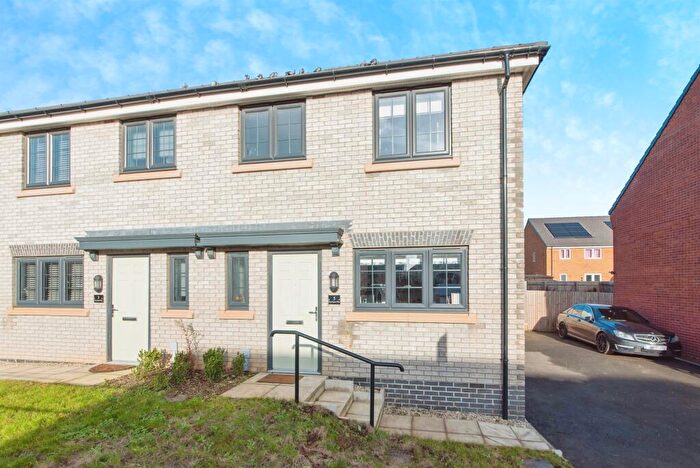
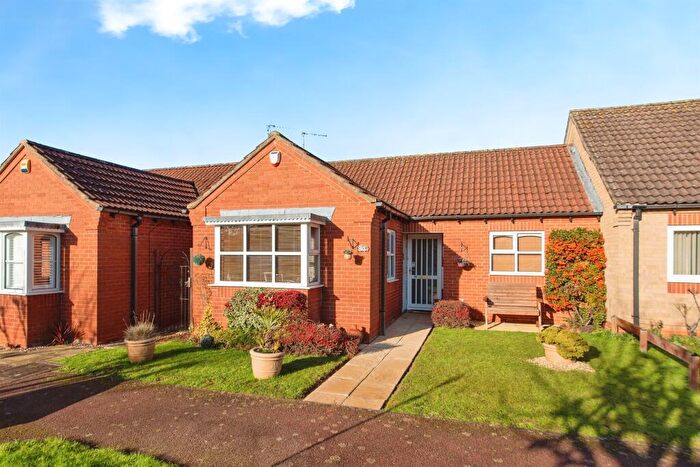
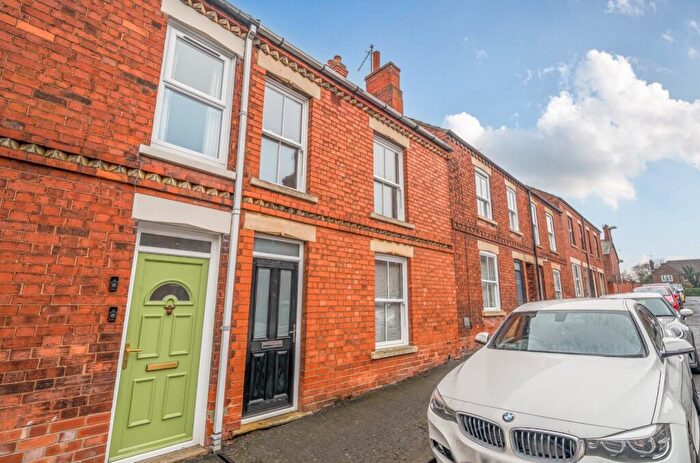
Properties in Sleaford Castle have an average house price of £170,929.00 and had 141 Property Transactions within the last 3 years¹.
Sleaford Castle is an area in Sleaford, Lincolnshire with 1,229 households², where the most expensive property was sold for £525,000.00.
Properties for sale in Sleaford Castle
Roads and Postcodes in Sleaford Castle
Navigate through our locations to find the location of your next house in Sleaford Castle, Sleaford for sale or to rent.
| Streets | Postcodes |
|---|---|
| Albert Terrace | NG34 7QA |
| Alexandra Road | NG34 7QW |
| Alexandra Square | NG34 7XZ |
| Bourne Close | NG34 7WD |
| Brydone Way | NG34 7GL |
| Buttler Way | NG34 7PA |
| Carlton Close | NG34 7WN |
| Castle Causeway | NG34 7QN |
| Castle Street | NG34 7QE |
| Castle Terrace | NG34 7QG |
| Castle Terrace Road | NG34 7QF |
| Charlotte Street | NG34 7PR |
| Curlew Way | NG34 7UD |
| Cygnet Close | NG34 7UQ |
| Dove Close | NG34 7UT |
| Eagle Drive | NG34 7UX |
| Electric Station Road | NG34 7QJ NG34 7QL |
| Elizabeth Court | NG34 7TU |
| Falcon Way | NG34 7UA |
| Finch Drive | NG34 7US |
| George Street | NG34 7NZ |
| Grantham Road | NG34 7NB NG34 7NE NG34 7NS NG34 7NU NG34 7NW |
| Handley Court Mews | NG34 7RW |
| Hawks Way | NG34 7UR |
| Jermyn Street | NG34 7RU NG34 7UL NG34 7RS |
| Kesteven Street | NG34 4ZY |
| Kestrel Close | NG34 7UP |
| King Edward Street | NG34 7NF NG34 7NN |
| King John Street | NG34 7QH |
| Linnet Way | NG34 7UB |
| Lord Street | NG34 7NQ |
| Millstream Square | NG34 7ZL |
| Nags Head Passage | NG34 7RP |
| Osprey Close | NG34 7UZ |
| Peregrine Close | NG34 7UY |
| Poppyfield Lane | NG34 7ZW |
| Queen Street | NG34 7NH |
| Rhodes Avenue | NG34 7PB |
| Riverside Close | NG34 7RF |
| Riverside Shopping Centre | NG34 7PD |
| Robin Close | NG34 7TZ |
| Rookery Avenue | NG34 7TY NG34 7FE |
| Slea Cottages | NG34 7PY |
| Somerton Close | NG34 7WU |
| Southgate | NG34 7RR NG34 7RZ NG34 7RL |
| Spriggs Close | NG34 7UW |
| Stamford Close | NG34 7WP |
| Station Road | NG34 7AA NG34 7RG NG34 7SJ |
| Swallow Close | NG34 7UU |
| The Creamery | NG34 7ZF |
| Thomas Court | NG34 7TX |
| Thomas Street | NG34 7QD |
| Thrush Close | NG34 7UE |
| Welbourn Close | NG34 7WT |
| West Banks | NG34 7PX NG34 7PZ NG34 7QB NG34 7QQ NG34 7PQ |
| White Hart Mews | NG34 7RY |
| Wren Close | NG34 7XA |
| NG34 0XD NG34 4AS NG34 4ED NG34 4EJ NG34 4ER NG34 4ES NG34 4EX NG34 8GZ NG34 9WE NG34 4FE NG34 4FG NG34 4FN NG34 4FR |
Transport near Sleaford Castle
- FAQ
- Price Paid By Year
- Property Type Price
Frequently asked questions about Sleaford Castle
What is the average price for a property for sale in Sleaford Castle?
The average price for a property for sale in Sleaford Castle is £170,929. This amount is 31% lower than the average price in Sleaford. There are 1,487 property listings for sale in Sleaford Castle.
What streets have the most expensive properties for sale in Sleaford Castle?
The streets with the most expensive properties for sale in Sleaford Castle are Rookery Avenue at an average of £330,000, Grantham Road at an average of £243,163 and Cygnet Close at an average of £235,000.
What streets have the most affordable properties for sale in Sleaford Castle?
The streets with the most affordable properties for sale in Sleaford Castle are Nags Head Passage at an average of £78,000, Jermyn Street at an average of £87,791 and Castle Street at an average of £108,812.
Which train stations are available in or near Sleaford Castle?
Some of the train stations available in or near Sleaford Castle are Sleaford, Rauceby and Ruskington.
Property Price Paid in Sleaford Castle by Year
The average sold property price by year was:
| Year | Average Sold Price | Price Change |
Sold Properties
|
|---|---|---|---|
| 2025 | £181,204 | 9% |
45 Properties |
| 2024 | £165,337 | -1% |
44 Properties |
| 2023 | £166,768 | -7% |
52 Properties |
| 2022 | £178,705 | 9% |
85 Properties |
| 2021 | £162,955 | 3% |
83 Properties |
| 2020 | £158,172 | -5% |
61 Properties |
| 2019 | £165,671 | 7% |
77 Properties |
| 2018 | £153,871 | -1% |
84 Properties |
| 2017 | £156,177 | 9% |
100 Properties |
| 2016 | £141,899 | 2% |
89 Properties |
| 2015 | £139,323 | 6% |
107 Properties |
| 2014 | £130,546 | 16% |
62 Properties |
| 2013 | £109,432 | 4% |
46 Properties |
| 2012 | £105,294 | -2% |
38 Properties |
| 2011 | £107,009 | -5% |
38 Properties |
| 2010 | £112,153 | 9% |
51 Properties |
| 2009 | £102,418 | -15% |
41 Properties |
| 2008 | £118,252 | -8% |
43 Properties |
| 2007 | £127,645 | 4% |
86 Properties |
| 2006 | £122,090 | 7% |
93 Properties |
| 2005 | £113,551 | 8% |
106 Properties |
| 2004 | £104,671 | 21% |
108 Properties |
| 2003 | £82,474 | 14% |
119 Properties |
| 2002 | £70,810 | 10% |
113 Properties |
| 2001 | £63,770 | 26% |
151 Properties |
| 2000 | £47,071 | 9% |
113 Properties |
| 1999 | £42,613 | -2% |
102 Properties |
| 1998 | £43,575 | 6% |
81 Properties |
| 1997 | £40,993 | -6% |
88 Properties |
| 1996 | £43,601 | 4% |
71 Properties |
| 1995 | £41,867 | - |
82 Properties |
Property Price per Property Type in Sleaford Castle
Here you can find historic sold price data in order to help with your property search.
The average Property Paid Price for specific property types in the last three years are:
| Property Type | Average Sold Price | Sold Properties |
|---|---|---|
| Semi Detached House | £179,251.00 | 45 Semi Detached Houses |
| Detached House | £271,450.00 | 25 Detached Houses |
| Terraced House | £146,144.00 | 55 Terraced Houses |
| Flat | £75,656.00 | 16 Flats |

