
Houses for sale & to rent in M4 1BB, Edgehill Street, City Centre, Manchester
House Prices in M4 1BB, Edgehill Street, City Centre
Properties in M4 1BB have no sales history available within the last 3 years. M4 1BB is a postcode in Edgehill Street located in City Centre, an area in Manchester, Manchester, with 28 households².
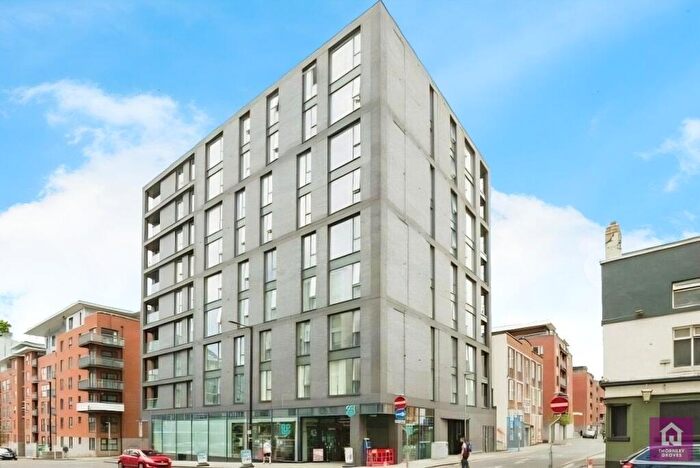
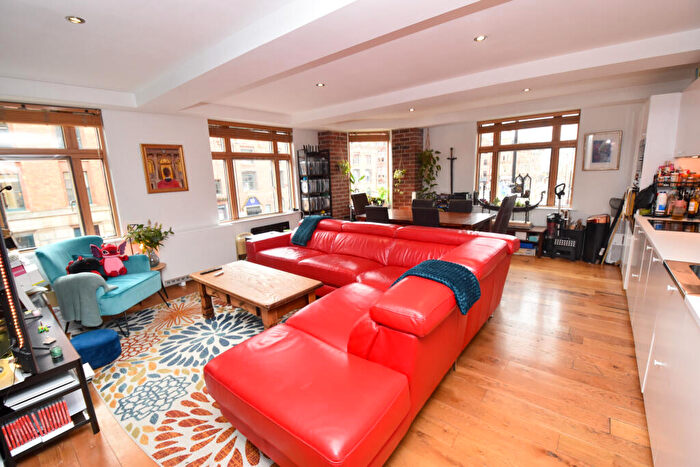
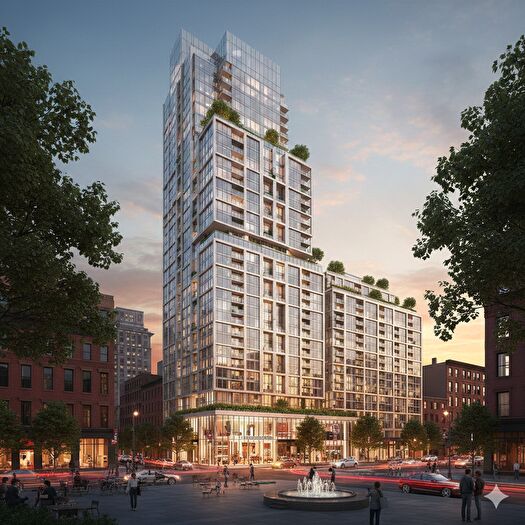
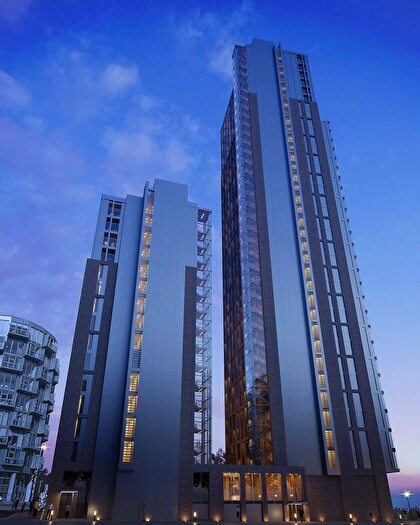
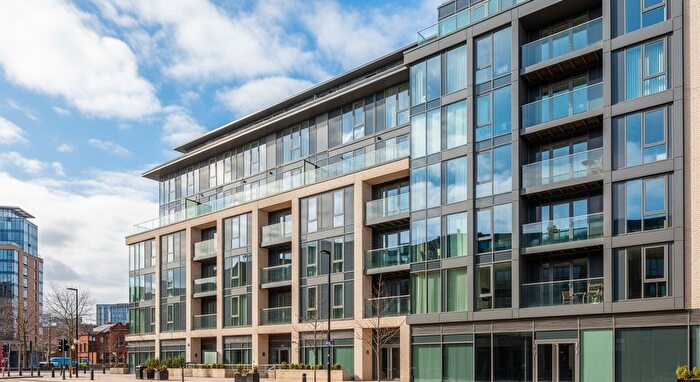
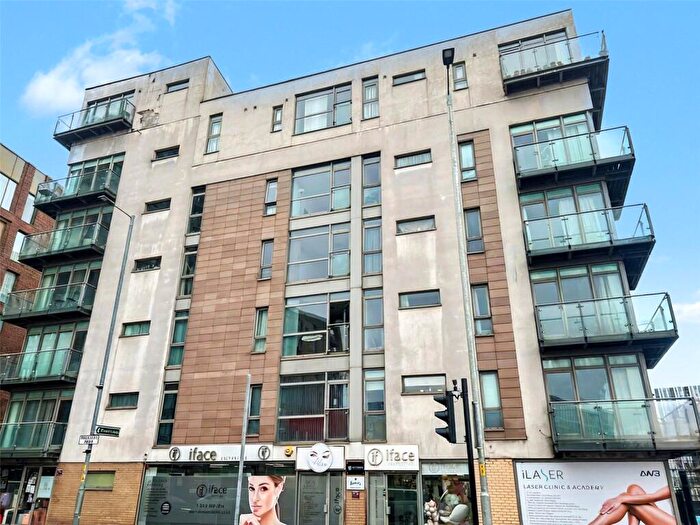
Properties for sale near M4 1BB, Edgehill Street
![]()
If you are looking to sell your house, let it out, or receive a property valuation, an expert can help you.
Click the button below to get started.


Price Paid in Edgehill Street, M4 1BB, City Centre
NORTHPOINT HOUSE, 5 FLAT 22 Edgehill Street, M4 1BB, City Centre Manchester
Property NORTHPOINT HOUSE, 5 FLAT 22 has been sold 2 times. The last time it was sold was in 15/09/2017 and the sold price was £243,000.00.
This is a Flat which was sold as a leasehold in 15/09/2017
| Date | Price | Property Type | Tenure | Classification |
|---|---|---|---|---|
| 15/09/2017 | £243,000.00 | Flat | leasehold | Established Building |
| 08/12/2004 | £155,000.00 | Flat | leasehold | Established Building |
NORTHPOINT HOUSE, 5 FLAT 21 Edgehill Street, M4 1BB, City Centre Manchester
Property NORTHPOINT HOUSE, 5 FLAT 21 has been sold 3 times. The last time it was sold was in 27/02/2013 and the sold price was £142,000.00.
This is a Flat which was sold as a leasehold in 27/02/2013
| Date | Price | Property Type | Tenure | Classification |
|---|---|---|---|---|
| 27/02/2013 | £142,000.00 | Flat | leasehold | Established Building |
| 13/01/2006 | £193,950.00 | Flat | leasehold | Established Building |
| 09/09/2003 | £159,500.00 | Flat | leasehold | New Build |
Transport near M4 1BB, Edgehill Street
-
 Manchester Victoria Station
 -
Manchester Piccadilly Station
-
Manchester Oxford Road Station
-
Salford Central Station
-
Deansgate Station
-
Ardwick Station
-
Salford Crescent Station
-
Ashburys Station
-
Manchester United Football Ground Station
-
Belle Vue Station
House price paid reports for M4 1BB, Edgehill Street
Click on the buttons below to see price paid reports by year or property price:
- Price Paid By Year
Property Price Paid in M4 1BB, Edgehill Street by Year
The average sold property price by year was:
| Year | Average Sold Price | Price Change |
Sold Properties
|
|---|---|---|---|
| 2017 | £243,000 | 42% |
1 Property |
| 2013 | £142,000 | -37% |
1 Property |
| 2006 | £193,950 | 20% |
1 Property |
| 2004 | £155,000 | -3% |
1 Property |
| 2003 | £159,500 | - |
1 Property |