Houses for sale & to rent in Poppyland, Cromer
House Prices in Poppyland
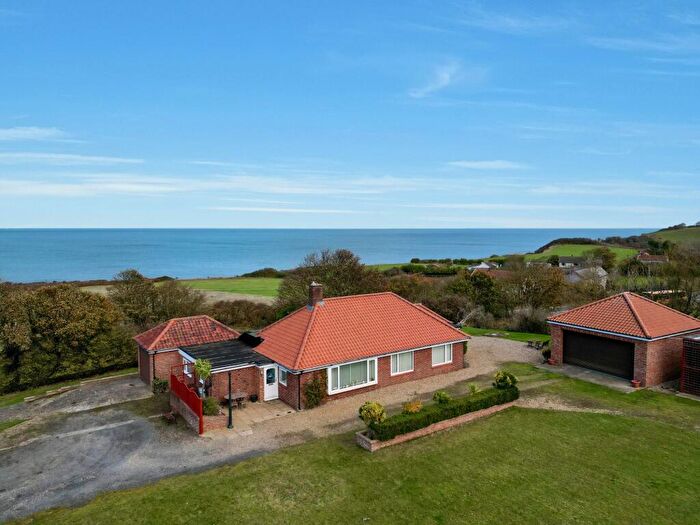
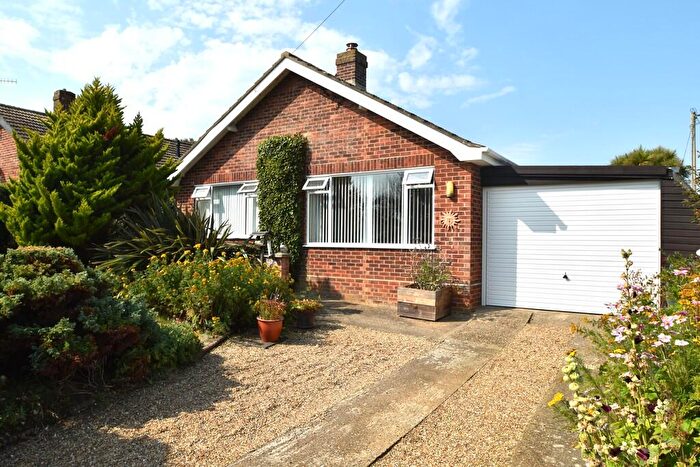
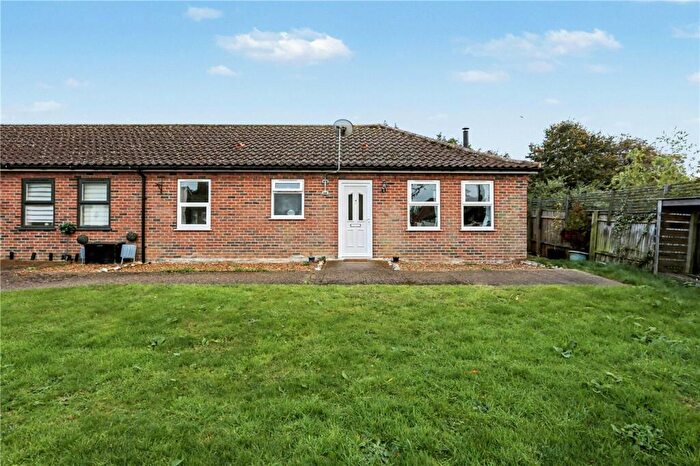
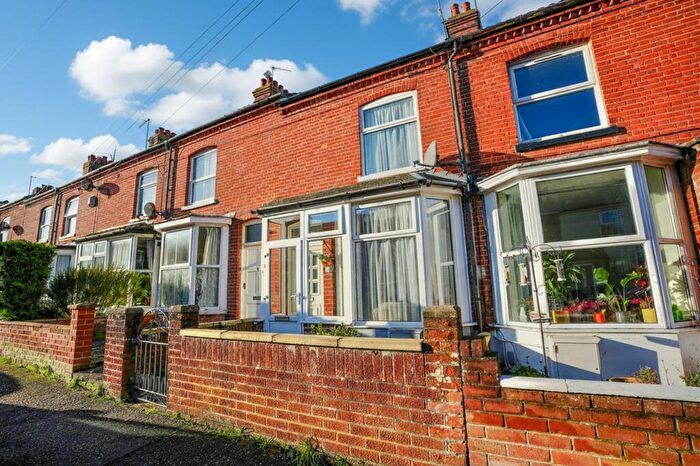
Properties in Poppyland have an average house price of £372,874.00 and had 104 Property Transactions within the last 3 years¹.
Poppyland is an area in Cromer, Norfolk with 873 households², where the most expensive property was sold for £890,000.00.
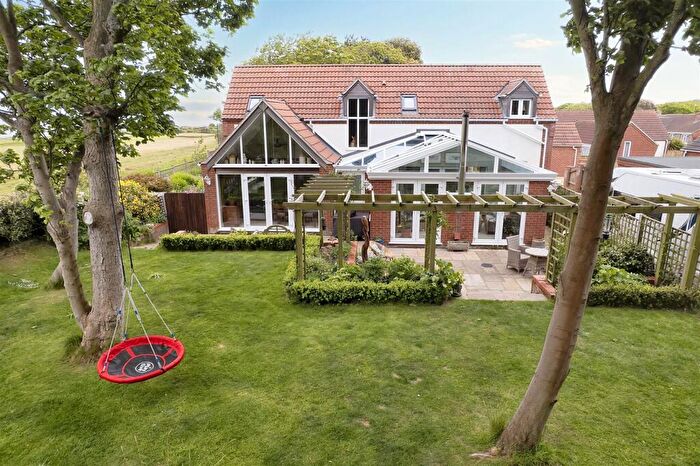
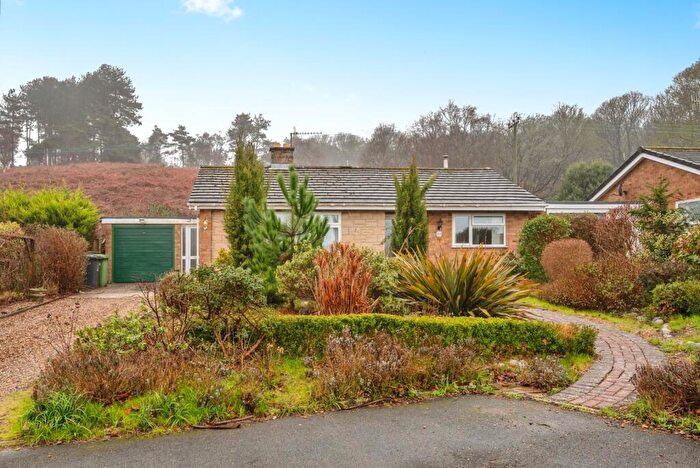
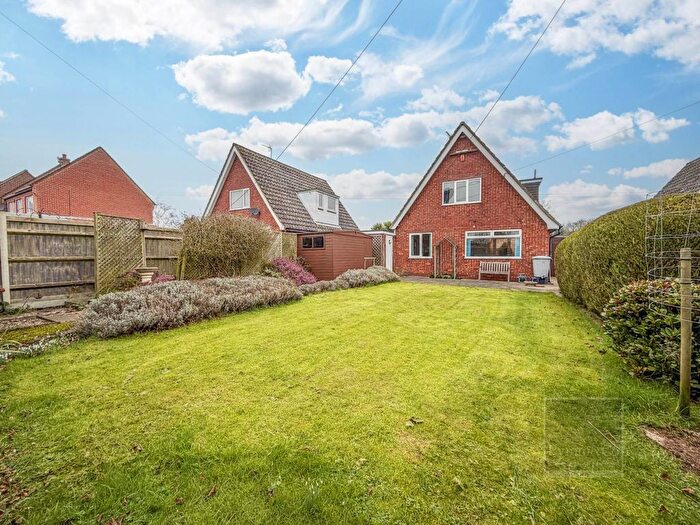
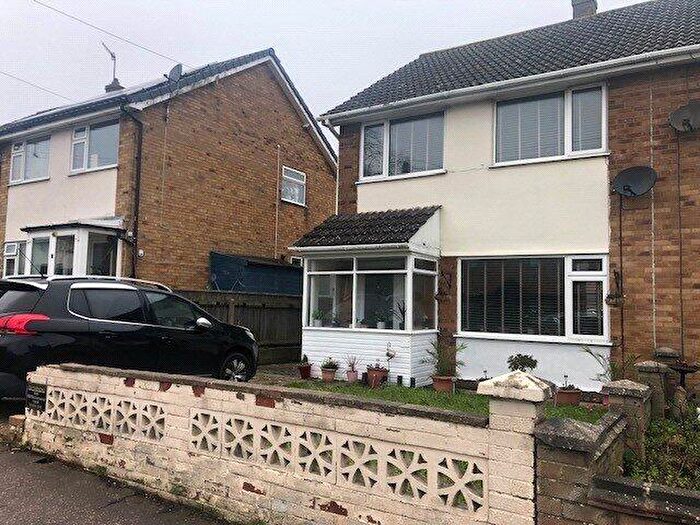
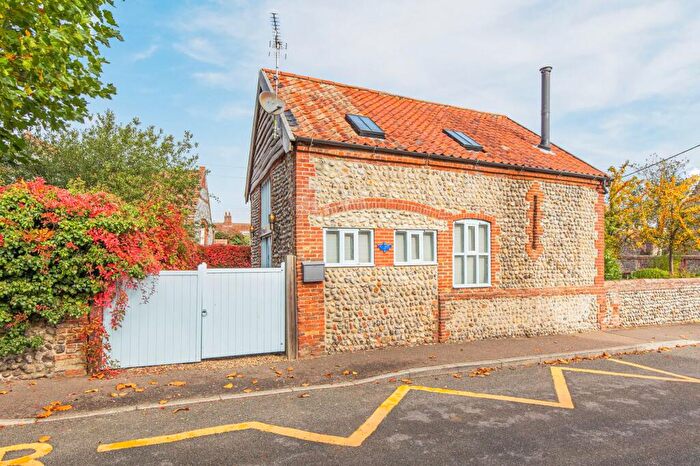
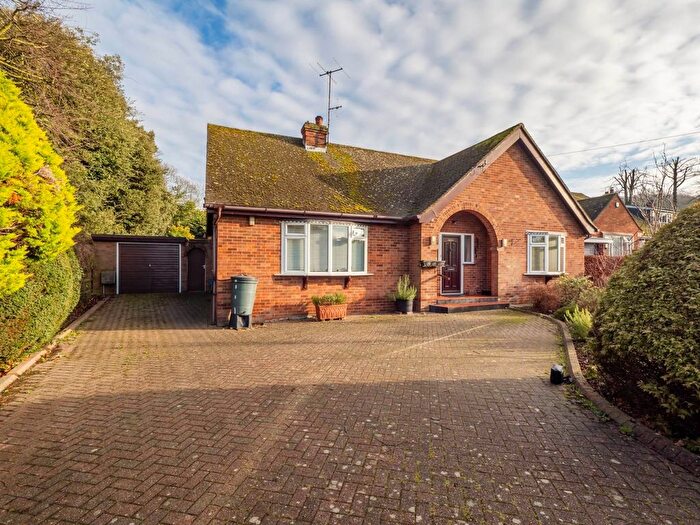
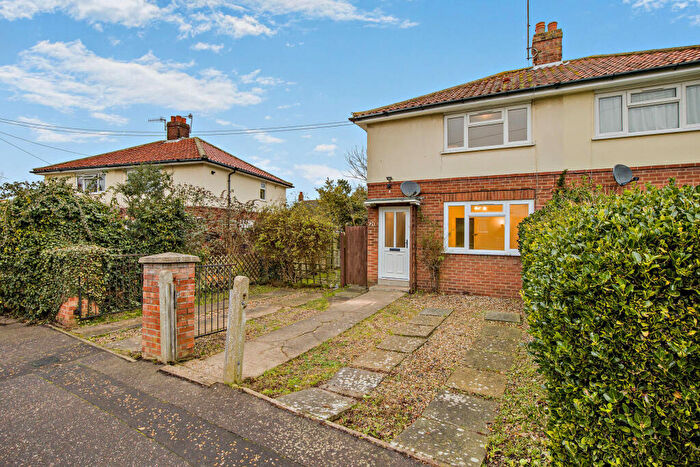
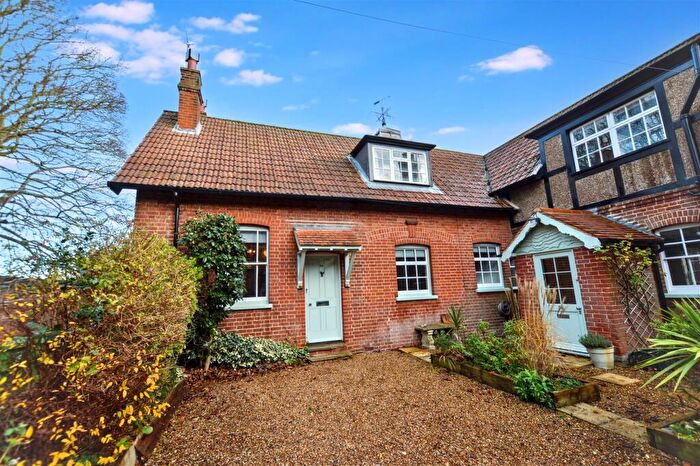
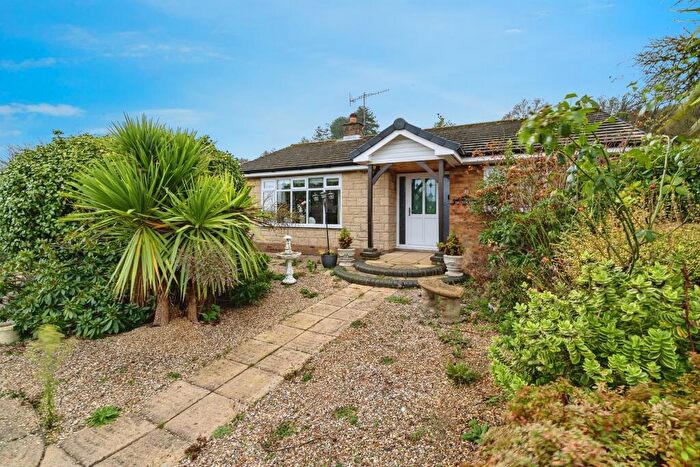
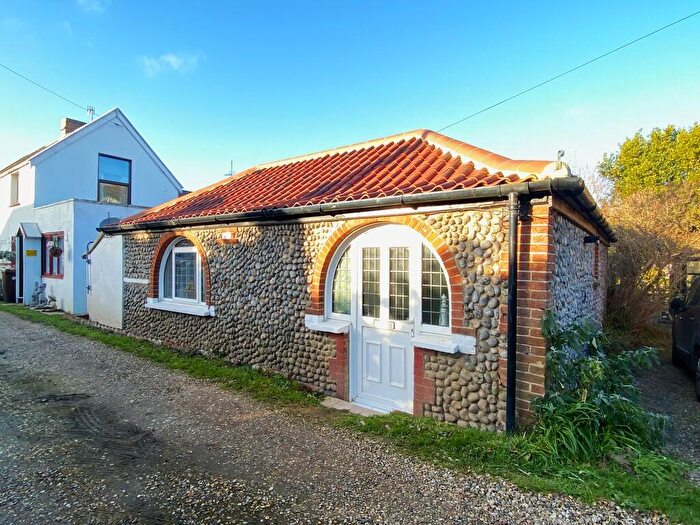
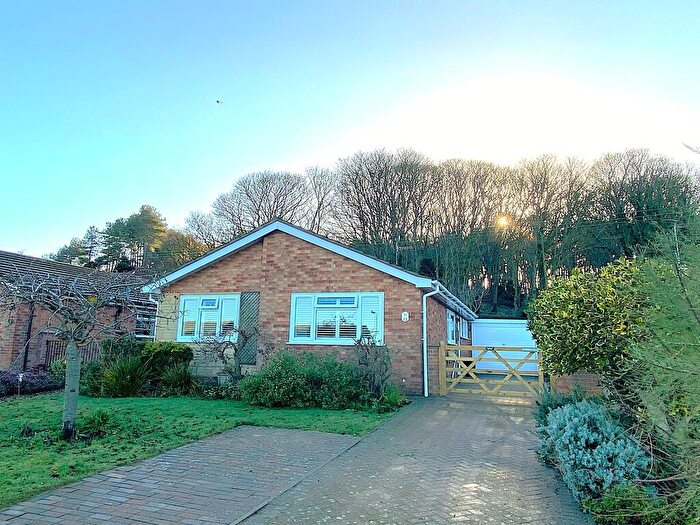
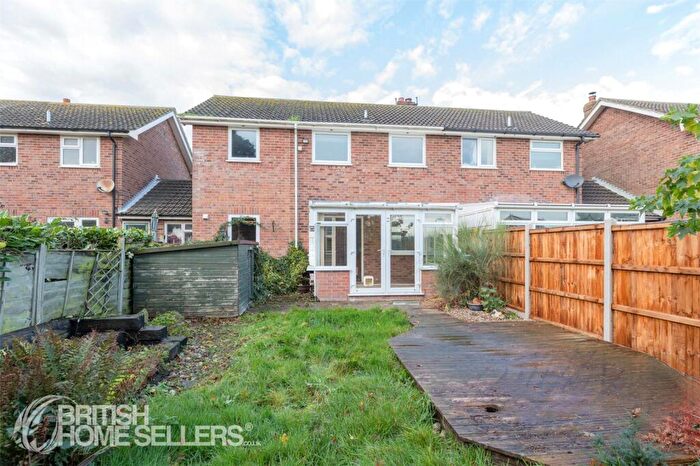
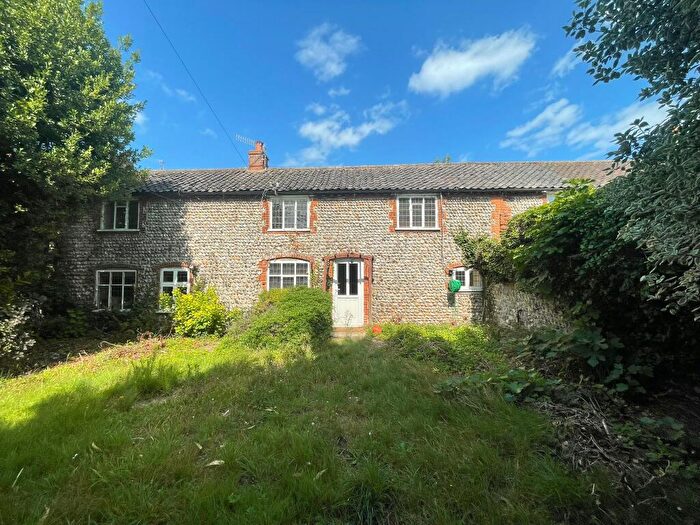
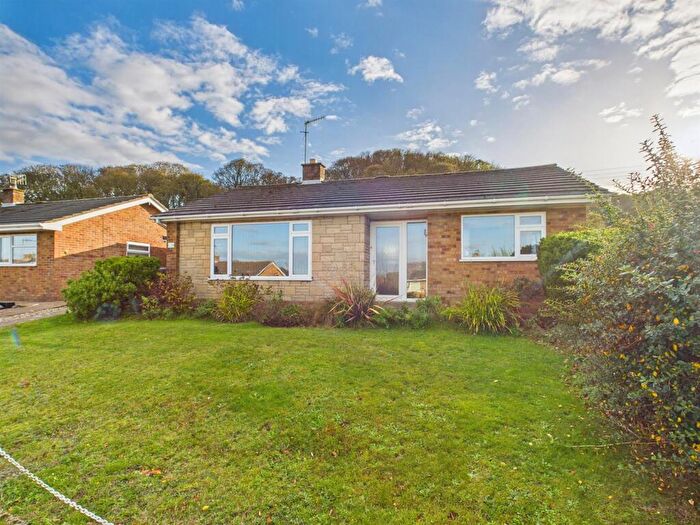
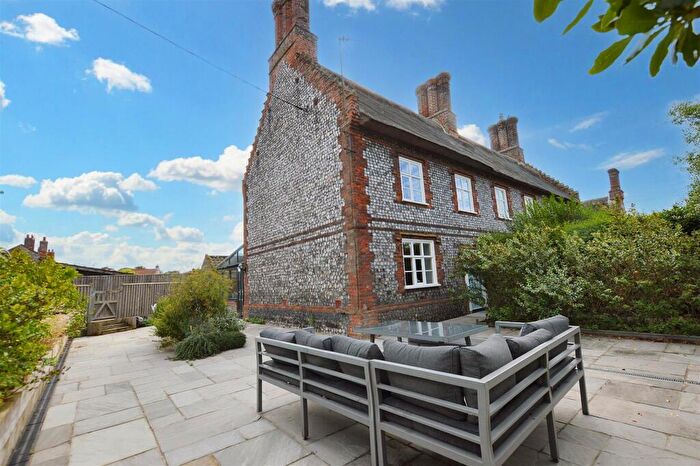
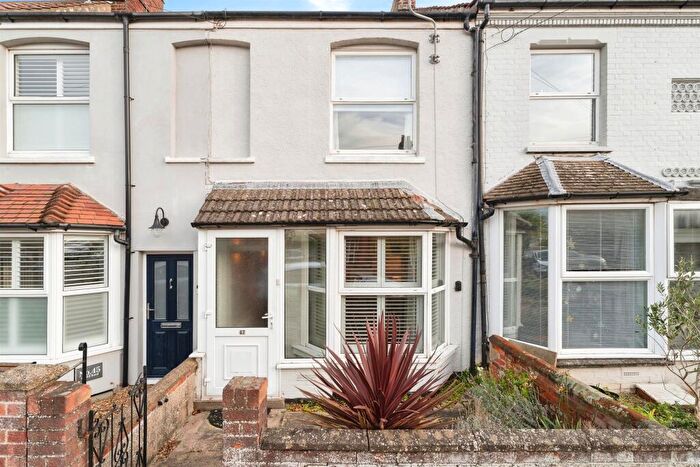
Properties for sale in Poppyland
Roads and Postcodes in Poppyland
Navigate through our locations to find the location of your next house in Poppyland, Cromer for sale or to rent.
| Streets | Postcodes |
|---|---|
| Aldis Close | NR27 0JF |
| Arden Close | NR27 0PH |
| Beach Close | NR27 0PJ |
| Bracken Avenue | NR27 0NZ |
| Bracken End | NR27 0PA |
| Bridge Terrace | NR27 0HF |
| Broadgate Close | NR27 0LR |
| Carr Lane | NR27 0PS |
| Christophers Close | NR27 0GA |
| Church Close | NR27 0NY |
| Church Street | NR27 0AA NR27 0LG |
| Cliff Road | NR27 0PP |
| Clifton Way | NR27 0NG |
| Coast Road | NR27 0NF |
| Craft Lane | NR27 0LJ NR27 0LL |
| Cromer Road | NR27 0JJ NR27 0JX NR27 0JY NR27 0LT NR27 0LU NR27 0LY NR27 0NT NR27 0NU NR27 0NX NR27 0LX NR27 0NH |
| Crossdale Street | NR27 9LA NR27 9LB NR27 9LD NR27 9RQ |
| Danish House Gardens | NR27 0PD |
| Emerys Close | NR27 0NE |
| Finch Close | NR27 0QD |
| Foundry Close | NR27 0JZ |
| Gallus Close | NR27 0BJ |
| Grange Avenue | NR27 0ND |
| Hall Road | NR27 0JP NR27 0JW |
| Harbord Road | NR27 0PL NR27 0PN |
| High Street | NR27 0AB |
| Highfield Road | NR27 0NQ |
| Hillingdon Park | NR27 0PG |
| Hungry Hill | NR27 0LN NR27 0LW |
| Keswick Close | NR27 0LF |
| Lutyens Drive | NR27 0FL |
| Madams Lane | NR27 0LP |
| Main Road | NR27 0LS |
| Mundesley Road | NR27 0NB NR27 0PT NR27 0PU |
| Nightingale Close | NR27 0QE |
| North Walsham Road | NR27 9LE NR27 9LF |
| Northrepps Road | NR27 0JL NR27 0JS NR27 0JR |
| Norwich Road | NR27 0HG NR27 9JU |
| Pauls Lane | NR27 0PE NR27 0PF |
| Pit Road | NR27 0LZ |
| Rectory Road | NR27 0LH |
| School Close | NR27 0LB |
| Silver Court | NR27 0NW |
| Starling Rise | NR27 0NJ |
| Stevens Road | NR27 0HZ |
| Storeys Loke | NR27 0JT |
| The Glade | NR27 0PY |
| The Londs | NR27 0PW |
| Thurst Road | NR27 0PR |
| Tolls Hill Road | NR27 0NN |
| Tolls View | NR27 0PQ |
| Tower Lane | NR27 0NA |
| White Horse Gardens | NR27 0PX |
| NR27 0JN NR27 0LQ |
Transport near Poppyland
- FAQ
- Price Paid By Year
- Property Type Price
Frequently asked questions about Poppyland
What is the average price for a property for sale in Poppyland?
The average price for a property for sale in Poppyland is £372,874. This amount is 16% higher than the average price in Cromer. There are 503 property listings for sale in Poppyland.
What streets have the most expensive properties for sale in Poppyland?
The streets with the most expensive properties for sale in Poppyland are Clifton Way at an average of £500,000, Cromer Road at an average of £497,291 and Harbord Road at an average of £487,500.
What streets have the most affordable properties for sale in Poppyland?
The streets with the most affordable properties for sale in Poppyland are Beach Close at an average of £175,000, Keswick Close at an average of £230,500 and The Londs at an average of £237,500.
Which train stations are available in or near Poppyland?
Some of the train stations available in or near Poppyland are Roughton Road, Cromer and Gunton.
Property Price Paid in Poppyland by Year
The average sold property price by year was:
| Year | Average Sold Price | Price Change |
Sold Properties
|
|---|---|---|---|
| 2025 | £343,068 | -10% |
32 Properties |
| 2024 | £378,400 | -5% |
40 Properties |
| 2023 | £395,773 | 2% |
32 Properties |
| 2022 | £389,062 | 12% |
48 Properties |
| 2021 | £341,116 | 4% |
74 Properties |
| 2020 | £328,796 | -1% |
43 Properties |
| 2019 | £333,445 | 12% |
56 Properties |
| 2018 | £295,094 | -2% |
77 Properties |
| 2017 | £299,863 | 19% |
62 Properties |
| 2016 | £243,082 | -0,4% |
72 Properties |
| 2015 | £243,979 | 5% |
51 Properties |
| 2014 | £231,684 | 6% |
81 Properties |
| 2013 | £216,823 | 1% |
54 Properties |
| 2012 | £213,917 | -1% |
37 Properties |
| 2011 | £215,551 | -10% |
39 Properties |
| 2010 | £237,588 | 20% |
39 Properties |
| 2009 | £189,396 | -6% |
40 Properties |
| 2008 | £199,843 | 1% |
24 Properties |
| 2007 | £197,108 | -3% |
82 Properties |
| 2006 | £203,779 | -8% |
48 Properties |
| 2005 | £220,380 | 20% |
23 Properties |
| 2004 | £176,486 | -7% |
51 Properties |
| 2003 | £189,198 | 25% |
45 Properties |
| 2002 | £142,045 | 35% |
61 Properties |
| 2001 | £92,763 | 9% |
45 Properties |
| 2000 | £84,468 | 6% |
63 Properties |
| 1999 | £79,555 | 18% |
40 Properties |
| 1998 | £65,267 | 6% |
49 Properties |
| 1997 | £61,277 | -2% |
47 Properties |
| 1996 | £62,537 | -1% |
42 Properties |
| 1995 | £63,455 | - |
36 Properties |
Property Price per Property Type in Poppyland
Here you can find historic sold price data in order to help with your property search.
The average Property Paid Price for specific property types in the last three years are:
| Property Type | Average Sold Price | Sold Properties |
|---|---|---|
| Semi Detached House | £322,920.00 | 25 Semi Detached Houses |
| Detached House | £436,823.00 | 57 Detached Houses |
| Terraced House | £270,350.00 | 20 Terraced Houses |
| Flat | £200,000.00 | 2 Flats |

