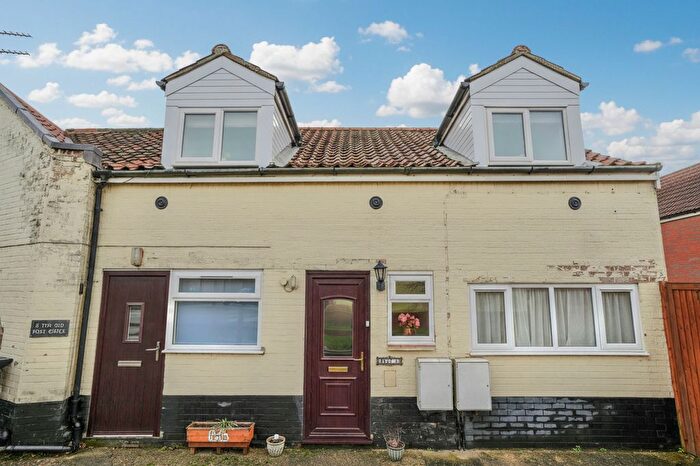
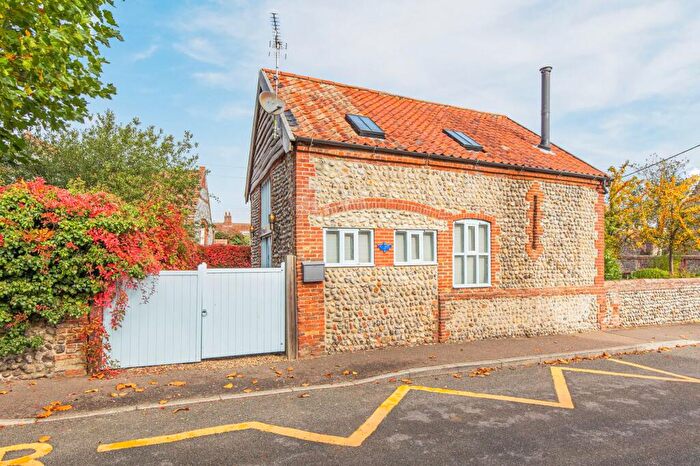
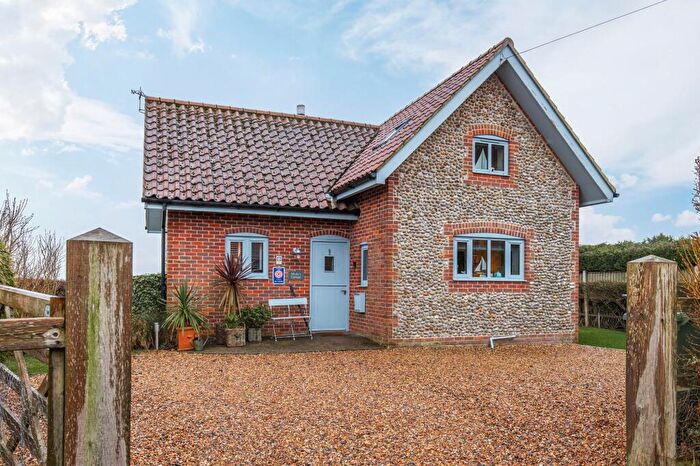
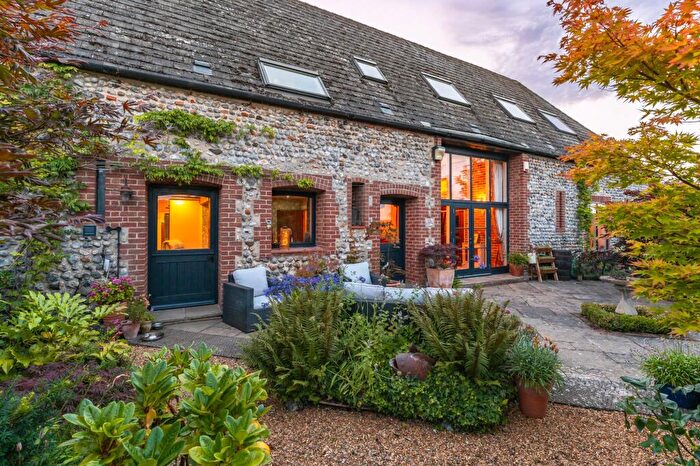
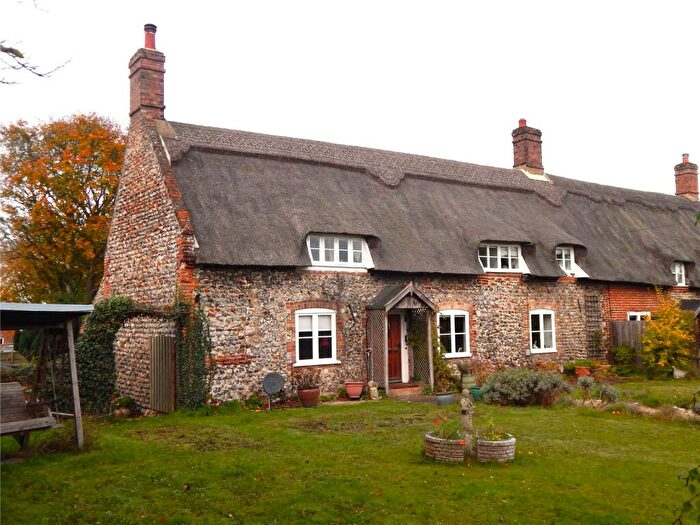
Houses for sale & to rent in Roughton, Norwich
House Prices in Roughton
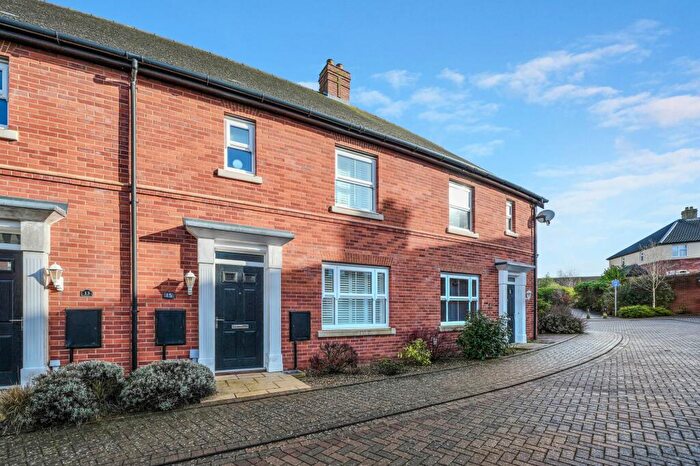
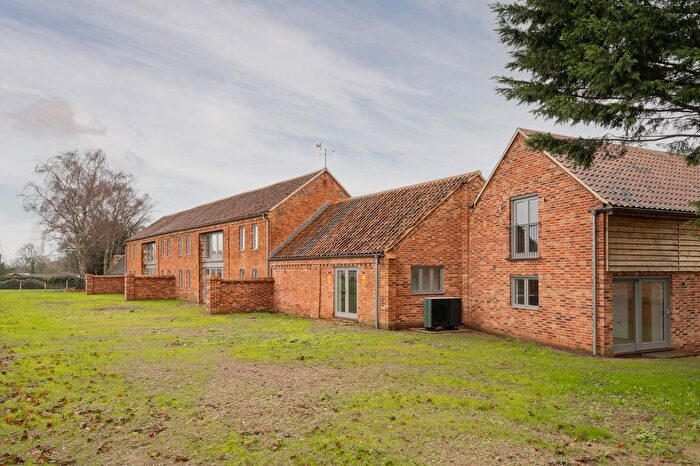
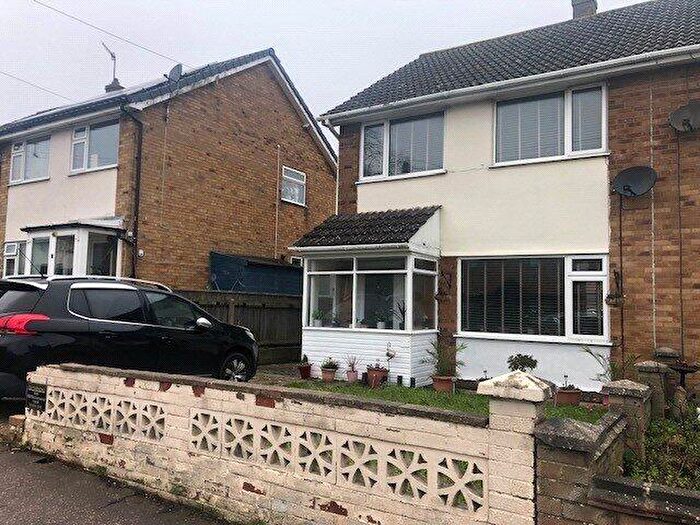
Properties in Roughton have an average house price of £383,941.00 and had 68 Property Transactions within the last 3 years¹.
Roughton is an area in Norwich, Norfolk with 893 households², where the most expensive property was sold for £1,025,000.00.
Properties for sale in Roughton
Roads and Postcodes in Roughton
Navigate through our locations to find the location of your next house in Roughton, Norwich for sale or to rent.
| Streets | Postcodes |
|---|---|
| Back Lane | NR11 8QR NR11 8SL |
| Back Mundesley Road | NR11 8HN |
| Barclay Close | NR11 8NU |
| Beechlands Park | NR11 8NT |
| Brownsfield | NR11 8LX |
| Carr Lane | NR11 8PG |
| Chapel Road | NR11 8AF NR11 8QP NR11 8UR NR11 8UW |
| Chapel Street | NR11 8NW |
| Church Loke | NR11 8SZ |
| Church Road | NR11 8UA NR11 8UB |
| Church Street | NR11 8NP |
| Clipped Hedge Lane | NR11 8NS |
| Common Lane | NR11 8TP |
| Cromer Road | NR11 8AJ NR11 8NE NR11 8PF NR11 8TF NR11 8TU NR11 8TW NR11 8PP NR11 8TQ NR11 8TX |
| Crown Loke | NR11 8AN |
| Drurys Yard | NR11 8NY |
| Felbrigg Road | NR11 8PA NR11 8PD |
| Gables Avenue | NR11 8NH |
| Gimingham Road | NR11 8UY |
| Grove Corner | NR11 8QS |
| Heath Lane | NR11 8NB |
| Heather Cottages | NR11 8TD |
| High Street | NR11 8AH LN9 5PD |
| Hillside Loke | NR11 8PB |
| Jasmine Cottages | NR11 8UP |
| Long Lane | NR11 8NL NR11 8UT NR11 8UU NR11 8FF |
| Lower Street | NR11 8UL |
| Meadow Close | NR11 8PW |
| Meadow Lane | NR11 8NX |
| Metton Road | NR11 8PJ NR11 8QT |
| Mundesley Road | NR11 8EU |
| Norwich Road | NR11 8NA NR11 8ND NR11 8SH NR11 8SJ NR11 8SU |
| Old Mill Lane | NR11 8PH |
| Old Mill Road | NR11 8PE |
| Old Turnpike Road | NR11 8SP |
| Orchard Close | NR11 8SR |
| Orchard Loke | NR11 8NN |
| Pit Street | NR11 8UX |
| Roughton Road | NR11 8PQ NR11 8TE |
| Sandpit Lane | NR11 8TJ |
| Sandy Lane | NR11 8NJ NR11 8HW |
| St James Court | NR11 8NZ |
| St Marys Close | NR11 8QF |
| Station Road | NR11 8UE NR11 8UD |
| The Driftway | NR11 8PL |
| The Green | NR11 8PN NR11 8TL |
| Thorpe Market Road | NR11 8TA NR11 8TB |
| Thorpe Road | NR11 8NG NR11 8NQ |
| Top Road | NR11 8XB |
| Topps Hill Road | NR11 8TR NR11 8TS |
| Warren Road | NR11 8UN |
| Wellspring Road | NR11 8XA |
| Whitegate Road | NR11 8XD |
| Wilfred Davison Way | NR11 8AQ NR11 8FA |
| Windmill Road | NR11 8HL |
| NR11 8NR NR11 8TG NR11 8TH NR11 8TN NR11 8TT NR11 8JA NR11 8PR NR11 8SB |
Transport near Roughton
- FAQ
- Price Paid By Year
- Property Type Price
Frequently asked questions about Roughton
What is the average price for a property for sale in Roughton?
The average price for a property for sale in Roughton is £383,941. This amount is 25% higher than the average price in Norwich. There are 1,848 property listings for sale in Roughton.
What streets have the most expensive properties for sale in Roughton?
The streets with the most expensive properties for sale in Roughton are Station Road at an average of £705,000, Norwich Road at an average of £570,000 and Thorpe Market Road at an average of £499,333.
What streets have the most affordable properties for sale in Roughton?
The streets with the most affordable properties for sale in Roughton are Wilfred Davison Way at an average of £94,500, Lower Street at an average of £265,000 and Beechlands Park at an average of £276,100.
Which train stations are available in or near Roughton?
Some of the train stations available in or near Roughton are Gunton, Roughton Road and Cromer.
Property Price Paid in Roughton by Year
The average sold property price by year was:
| Year | Average Sold Price | Price Change |
Sold Properties
|
|---|---|---|---|
| 2025 | £331,263 | -23% |
19 Properties |
| 2024 | £408,788 | 2% |
26 Properties |
| 2023 | £399,369 | -13% |
23 Properties |
| 2022 | £453,241 | 16% |
23 Properties |
| 2021 | £381,477 | 7% |
60 Properties |
| 2020 | £353,652 | 11% |
42 Properties |
| 2019 | £313,532 | 10% |
34 Properties |
| 2018 | £280,734 | -7% |
33 Properties |
| 2017 | £300,647 | 13% |
38 Properties |
| 2016 | £262,689 | 1% |
42 Properties |
| 2015 | £259,464 | 21% |
51 Properties |
| 2014 | £205,914 | 1% |
49 Properties |
| 2013 | £203,125 | 0,3% |
24 Properties |
| 2012 | £202,586 | -4% |
29 Properties |
| 2011 | £211,683 | -5% |
30 Properties |
| 2010 | £221,891 | -5% |
28 Properties |
| 2009 | £233,923 | -5% |
35 Properties |
| 2008 | £245,447 | 6% |
19 Properties |
| 2007 | £230,235 | 10% |
39 Properties |
| 2006 | £207,297 | -10% |
42 Properties |
| 2005 | £227,403 | 15% |
27 Properties |
| 2004 | £192,545 | 3% |
36 Properties |
| 2003 | £185,977 | 17% |
29 Properties |
| 2002 | £154,723 | 34% |
36 Properties |
| 2001 | £102,867 | 12% |
50 Properties |
| 2000 | £90,928 | 2% |
40 Properties |
| 1999 | £89,523 | 28% |
41 Properties |
| 1998 | £64,882 | 2% |
35 Properties |
| 1997 | £63,723 | 1% |
56 Properties |
| 1996 | £63,261 | 17% |
49 Properties |
| 1995 | £52,772 | - |
26 Properties |
Property Price per Property Type in Roughton
Here you can find historic sold price data in order to help with your property search.
The average Property Paid Price for specific property types in the last three years are:
| Property Type | Average Sold Price | Sold Properties |
|---|---|---|
| Semi Detached House | £316,868.00 | 19 Semi Detached Houses |
| Detached House | £433,600.00 | 35 Detached Houses |
| Terraced House | £350,821.00 | 14 Terraced Houses |

