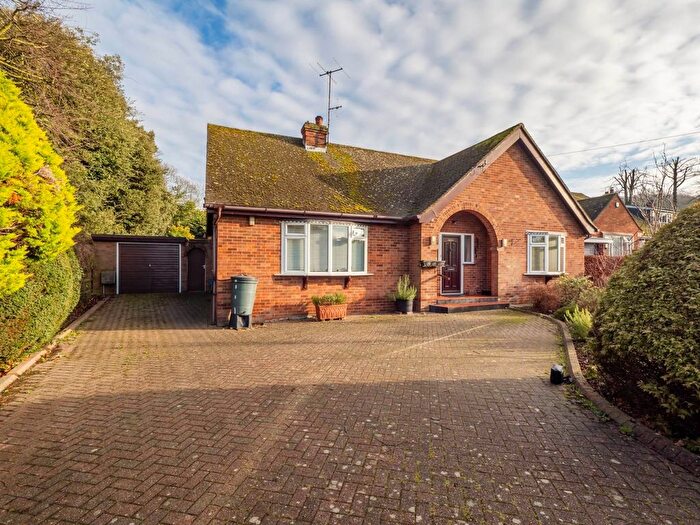
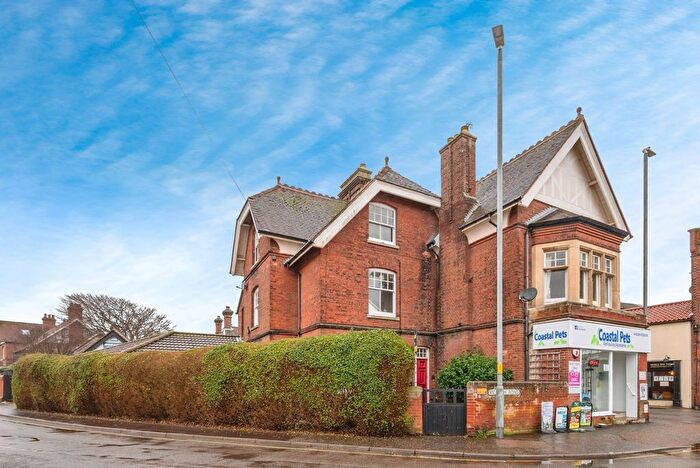
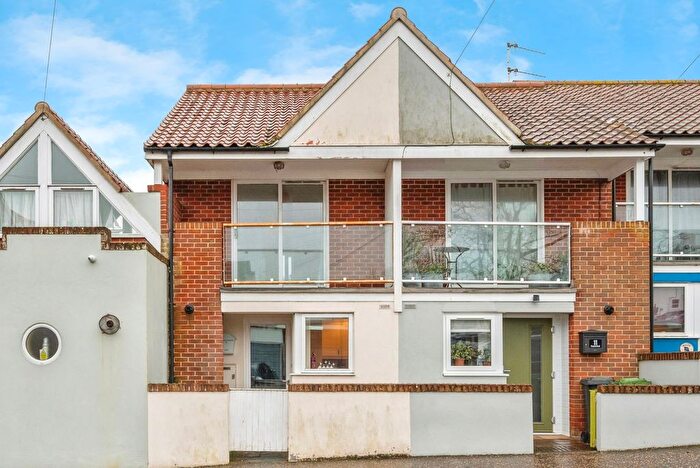
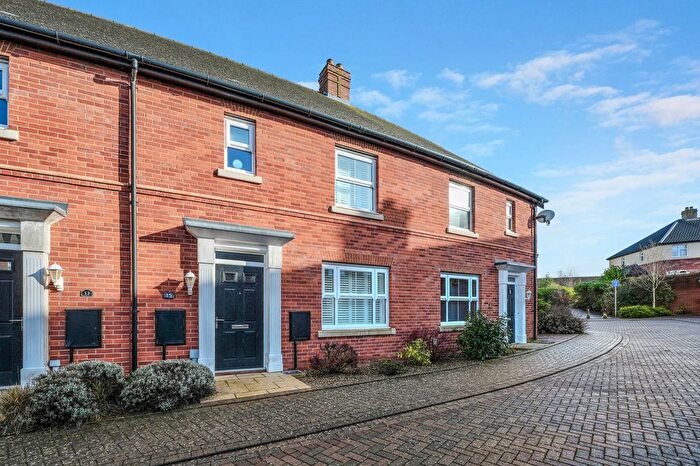
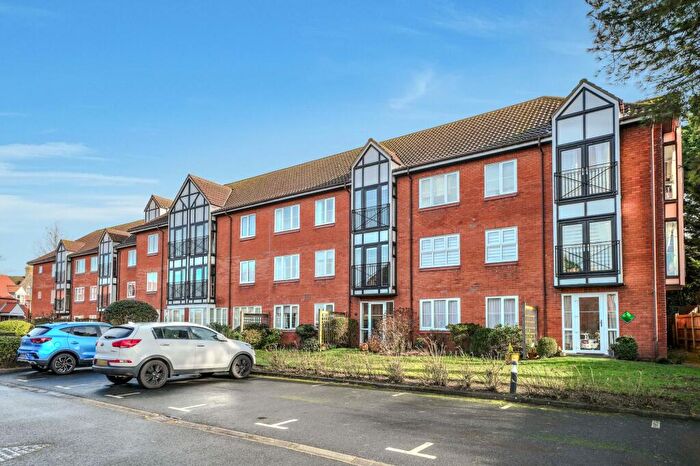
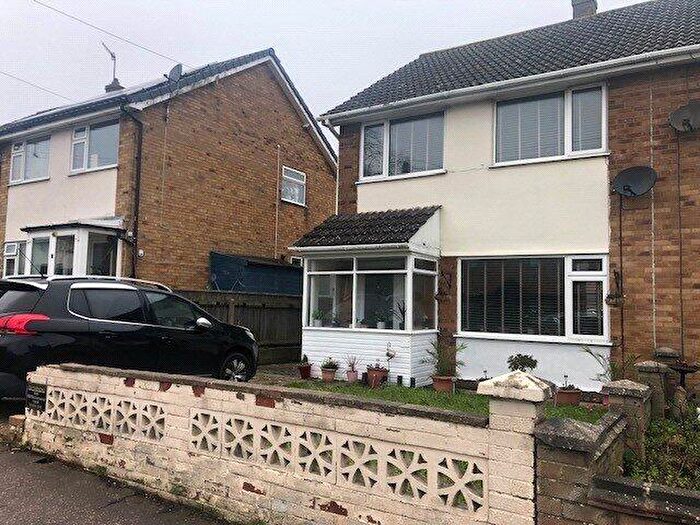
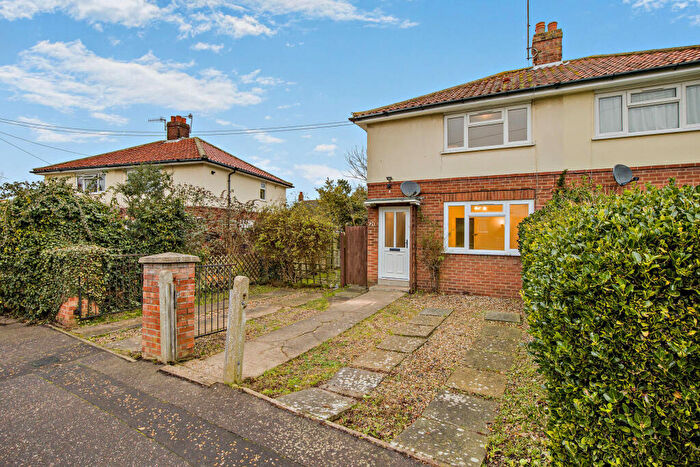
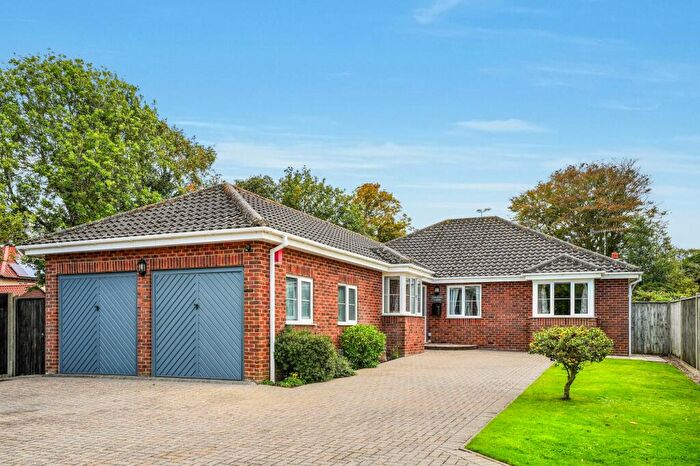
Houses for sale & to rent in Suffield Park, Cromer
House Prices in Suffield Park
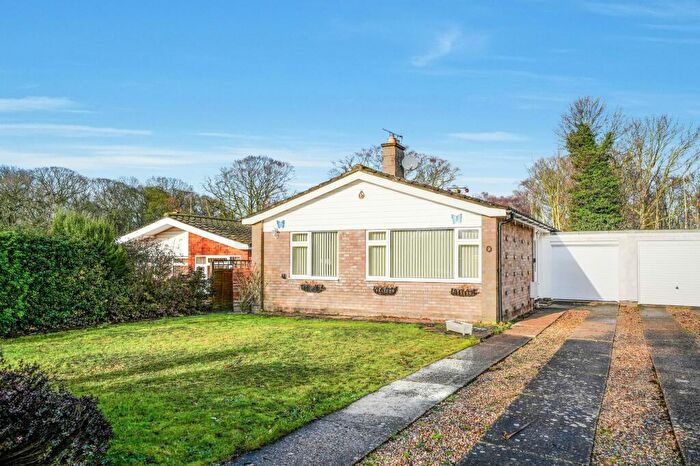
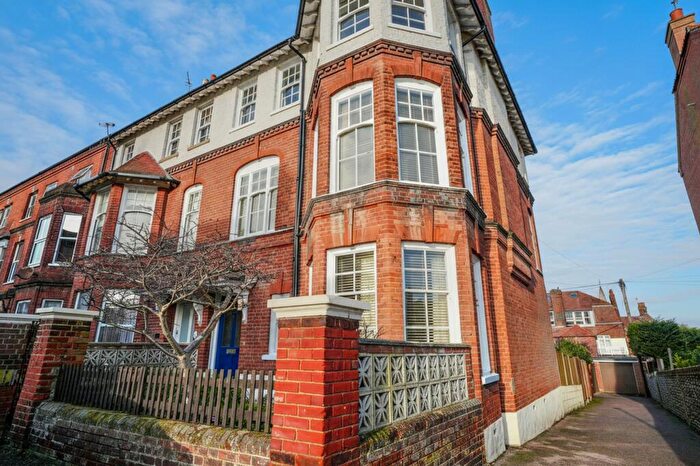
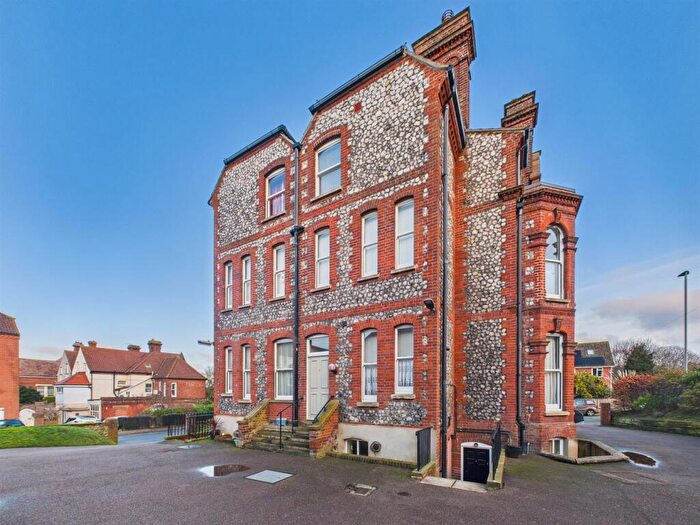
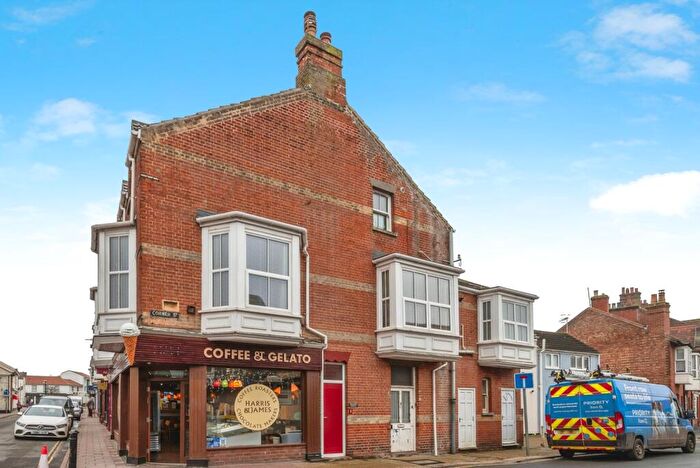
Properties in Suffield Park have an average house price of £300,796.00 and had 206 Property Transactions within the last 3 years¹.
Suffield Park is an area in Cromer, Norfolk with 1,812 households², where the most expensive property was sold for £805,000.00.
Properties for sale in Suffield Park
Roads and Postcodes in Suffield Park
Navigate through our locations to find the location of your next house in Suffield Park, Cromer for sale or to rent.
| Streets | Postcodes |
|---|---|
| Alexandra Road | NR27 0JB |
| Ashdown Court | NR27 0AE |
| Bailey Road | NR27 0JQ |
| Barclay Court Gardens | NR27 0FN NR27 0FP |
| Barclay Mews | NR27 0DP |
| Bridge Close | NR27 0FJ |
| Brownshill | NR27 0QA |
| Burnt Hills | NR27 9LW |
| Carrington Road | NR27 0DU |
| Clare Road | NR27 0DD |
| Clement Scott Mews | NR27 0DG |
| Cliff Avenue | NR27 0AF NR27 0AN |
| Cliff Drive | NR27 0AW |
| Cliff Lane | NR27 0AP |
| Cliff Road | NR27 0BU |
| Compit Hills | NR27 9LJ NR27 9LL NR27 9LP |
| Connaught Road | NR27 0BZ NR27 0DB |
| Crawford Road | NR27 0DF |
| Cromwell Close | NR27 0DE |
| Cromwell Road | NR27 0AU |
| Dixon Road | NR27 0JE |
| East Grove | NR27 0BL |
| Ellenhill | NR27 0DL |
| Fearns Close | NR27 0DZ |
| Fletcher Way | NR27 0HW |
| Francis Close | NR27 0HR |
| Furze Hill | NR27 0HU |
| Greenfield Close | NR27 0HT |
| Grove Road | NR27 0BY |
| Hampshire Gardens | NR27 0BE |
| Hanover Court | NR27 0DH |
| Harbord Road | NR27 0BP |
| Hartington Road | NR27 0EJ |
| Heartwell Road | NR27 0JD |
| Henry Blogg Road | NR27 0JG |
| Herne Court | NR27 0AG |
| High View Park | NR27 0HQ |
| Hill Close | NR27 0HX |
| Hillside | NR27 0HY |
| Jubilee Lane | NR27 0EL NR27 0EN |
| Jubilee Terrace | NR27 0EW |
| Links Avenue | NR27 0EH NR27 0EQ |
| Lynewood Close | NR27 0ER |
| Lynewood Road | NR27 0EE NR27 0EF |
| Mayfield Drive | NR27 0HN |
| Mill Road | NR27 0AD NR27 0BG NR27 0BH NR27 0BQ |
| Northrepps Road | NR27 0DR NR27 0DS NR27 0JU |
| Norwich Road | NR27 0AX NR27 0AY NR27 0AZ NR27 0BA NR27 0EX NR27 0EZ NR27 0HD NR27 0HE NR27 0JA |
| Old Coach Road | NR27 0PZ |
| Overstrand Road | NR27 0AH NR27 0AJ NR27 0AL NR27 0AQ NR27 0DJ NR27 0DN NR27 0DW NR27 0JH |
| Park Lane | NR27 0ED |
| Park Road | NR27 0EA NR27 0EB |
| Prior Bank Orchard | NR27 0PB |
| Queens Road | NR27 0EG |
| Reeve Place | NR27 0ET |
| Ridgeway | NR27 0HS |
| Rosebery Road | NR27 0BX |
| Roughton Road | NR27 0HH NR27 0HJ NR27 0HL NR27 9LN |
| Salisbury Road | NR27 0BW |
| St Margarets Lane | NR27 9BZ |
| St Martins Close | NR27 0BN |
| Station Road | NR27 0DX NR27 0DY |
| Sutherland Court Gardens | NR27 0DA |
| The Warren | NR27 0AR |
| Warnes Close | NR27 0AT |
| Warren Court | NR27 0AS |
| Whitehouse Estate | NR27 0EP |
| York Road | NR27 0BS |
| York Terrace | NR27 0BT |
Transport near Suffield Park
- FAQ
- Price Paid By Year
- Property Type Price
Frequently asked questions about Suffield Park
What is the average price for a property for sale in Suffield Park?
The average price for a property for sale in Suffield Park is £300,796. This amount is 6% lower than the average price in Cromer. There are 978 property listings for sale in Suffield Park.
What streets have the most expensive properties for sale in Suffield Park?
The streets with the most expensive properties for sale in Suffield Park are The Warren at an average of £653,333, Fletcher Way at an average of £617,500 and Northrepps Road at an average of £575,000.
What streets have the most affordable properties for sale in Suffield Park?
The streets with the most affordable properties for sale in Suffield Park are Salisbury Road at an average of £134,500, Ashdown Court at an average of £152,307 and Brownshill at an average of £184,250.
Which train stations are available in or near Suffield Park?
Some of the train stations available in or near Suffield Park are Roughton Road, Cromer and West Runton.
Property Price Paid in Suffield Park by Year
The average sold property price by year was:
| Year | Average Sold Price | Price Change |
Sold Properties
|
|---|---|---|---|
| 2025 | £313,500 | 3% |
58 Properties |
| 2024 | £304,915 | 6% |
71 Properties |
| 2023 | £287,429 | -1% |
77 Properties |
| 2022 | £288,876 | -6% |
105 Properties |
| 2021 | £306,625 | 7% |
110 Properties |
| 2020 | £286,237 | 16% |
63 Properties |
| 2019 | £240,310 | -3% |
91 Properties |
| 2018 | £247,281 | 11% |
79 Properties |
| 2017 | £220,297 | 6% |
90 Properties |
| 2016 | £207,519 | 3% |
127 Properties |
| 2015 | £201,240 | 8% |
96 Properties |
| 2014 | £184,310 | 10% |
109 Properties |
| 2013 | £166,157 | -3% |
84 Properties |
| 2012 | £171,809 | 4% |
64 Properties |
| 2011 | £164,921 | -11% |
72 Properties |
| 2010 | £182,296 | 6% |
82 Properties |
| 2009 | £170,921 | -6% |
69 Properties |
| 2008 | £181,680 | -1% |
77 Properties |
| 2007 | £184,021 | 10% |
134 Properties |
| 2006 | £165,661 | 1% |
114 Properties |
| 2005 | £164,207 | 13% |
77 Properties |
| 2004 | £143,390 | 14% |
133 Properties |
| 2003 | £123,630 | 21% |
91 Properties |
| 2002 | £97,223 | 13% |
93 Properties |
| 2001 | £85,016 | 7% |
136 Properties |
| 2000 | £78,832 | 16% |
103 Properties |
| 1999 | £65,834 | 15% |
117 Properties |
| 1998 | £56,119 | -3% |
89 Properties |
| 1997 | £57,811 | 9% |
121 Properties |
| 1996 | £52,380 | -3% |
93 Properties |
| 1995 | £54,075 | - |
77 Properties |
Property Price per Property Type in Suffield Park
Here you can find historic sold price data in order to help with your property search.
The average Property Paid Price for specific property types in the last three years are:
| Property Type | Average Sold Price | Sold Properties |
|---|---|---|
| Semi Detached House | £314,942.00 | 35 Semi Detached Houses |
| Detached House | £392,095.00 | 68 Detached Houses |
| Terraced House | £246,257.00 | 49 Terraced Houses |
| Flat | £226,148.00 | 54 Flats |

