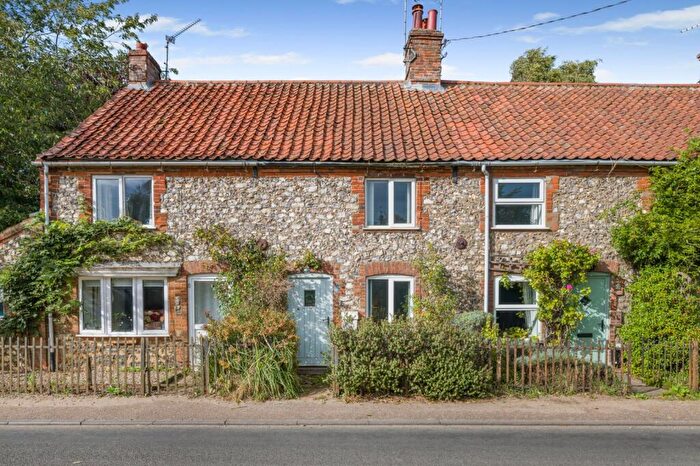
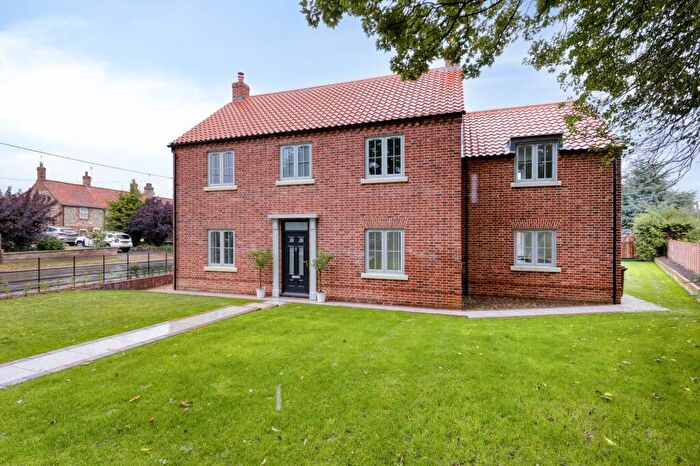
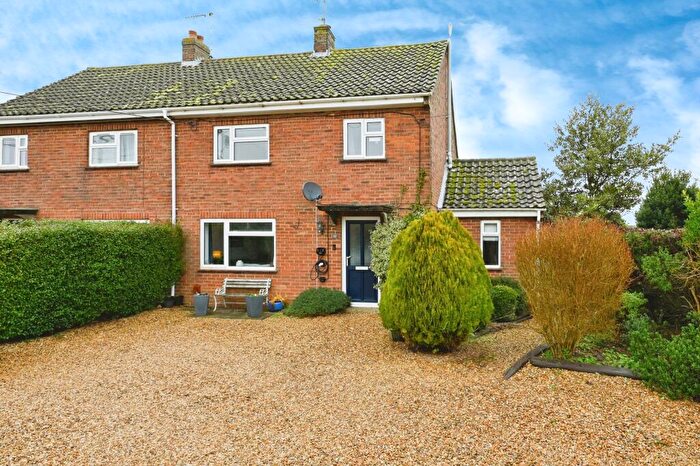
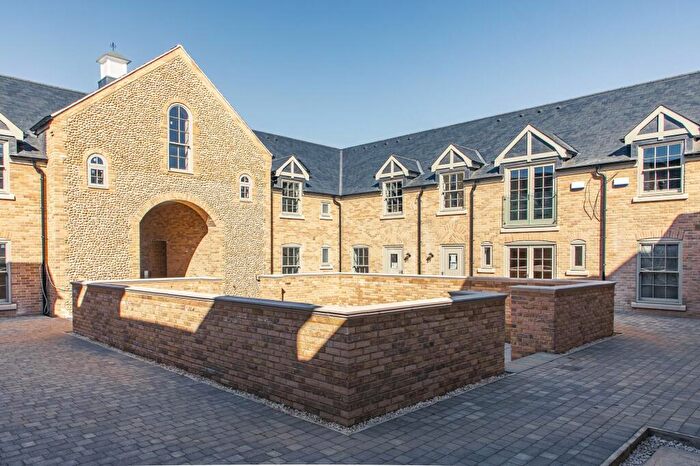
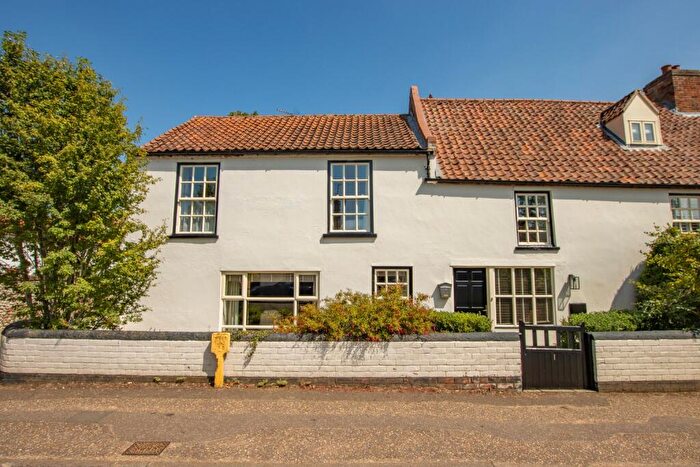
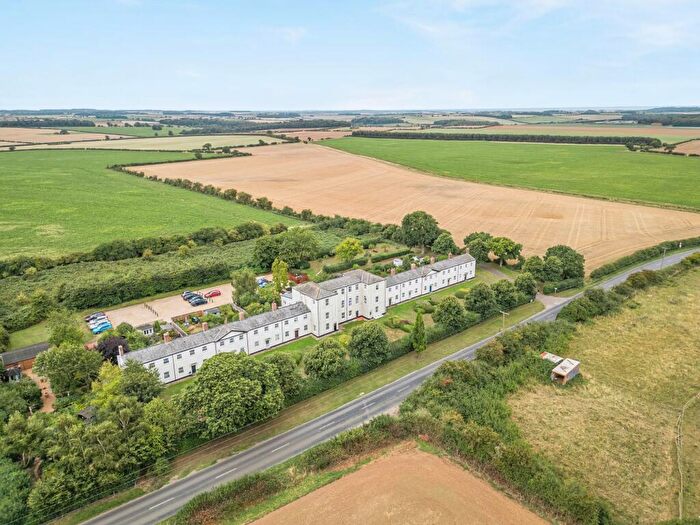
Houses for sale & to rent in Docking, Kings Lynn
House Prices in Docking
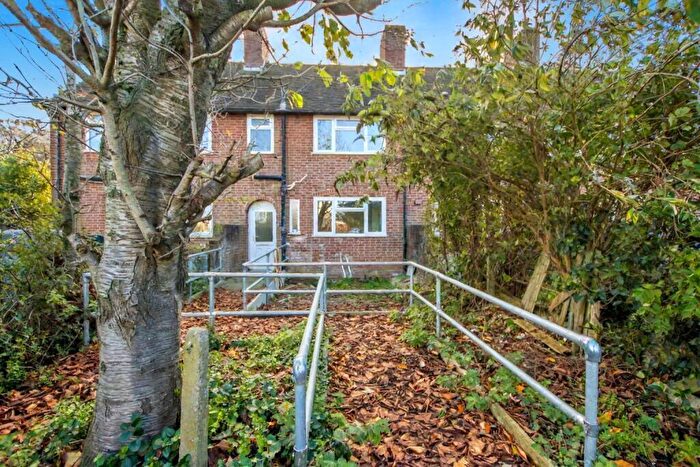
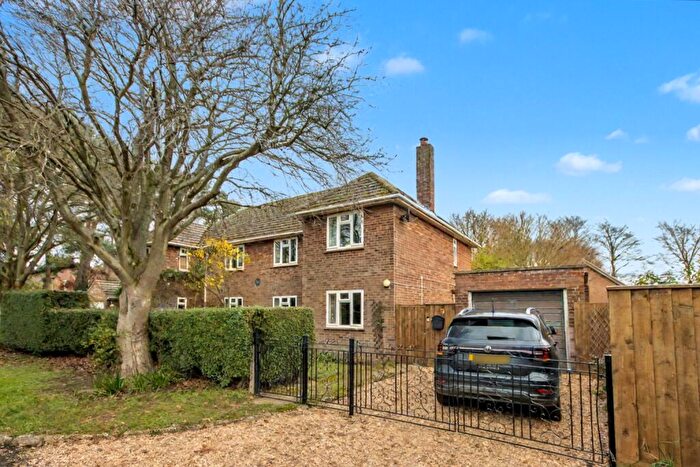
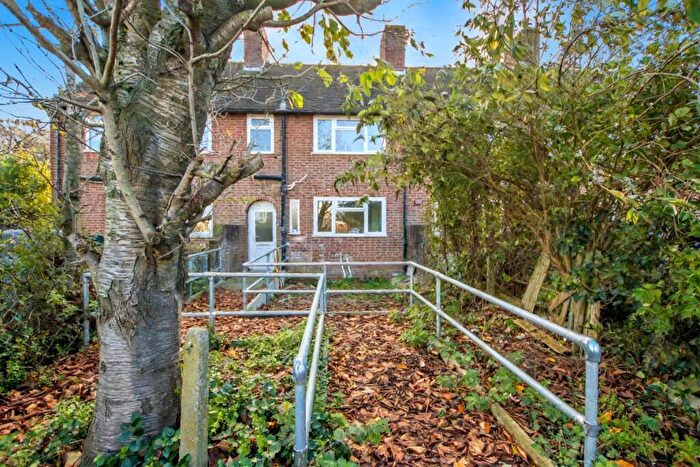
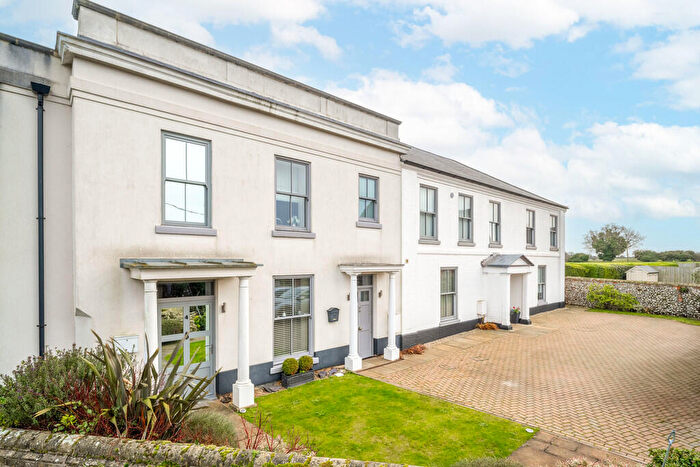
Properties in Docking have an average house price of £425,937.00 and had 69 Property Transactions within the last 3 years¹.
Docking is an area in Kings Lynn, Norfolk with 776 households², where the most expensive property was sold for £1,060,010.00.
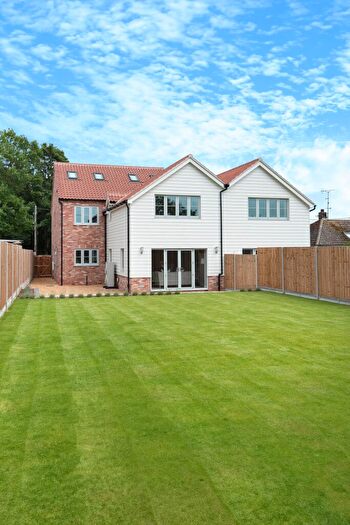
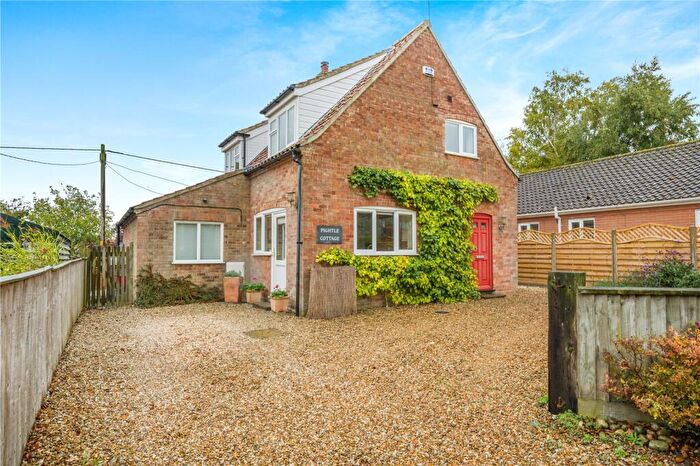
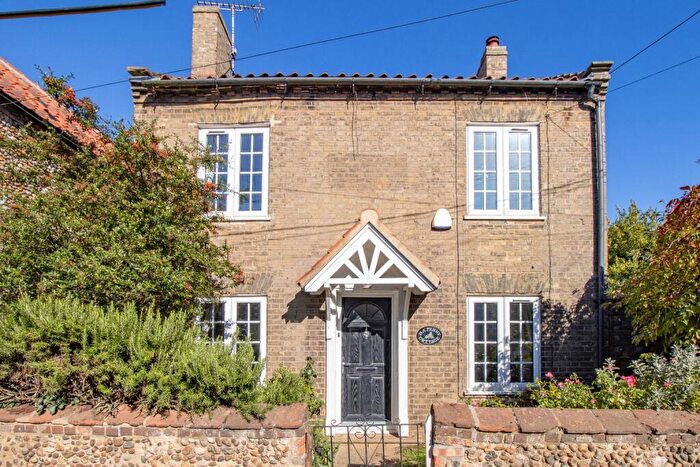
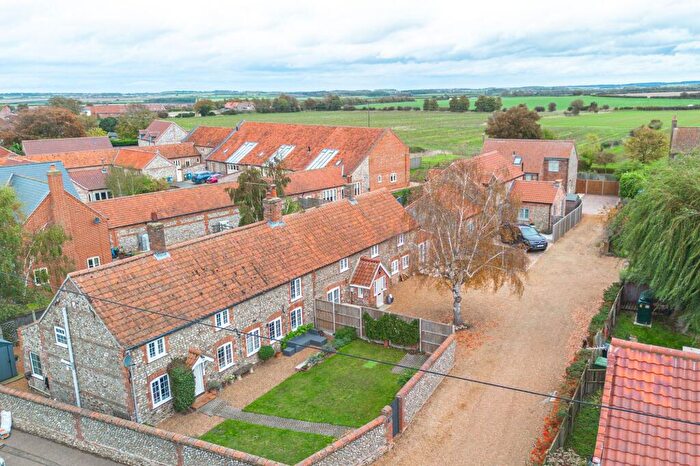
Properties for sale in Docking
Roads and Postcodes in Docking
Navigate through our locations to find the location of your next house in Docking, Kings Lynn for sale or to rent.
| Streets | Postcodes |
|---|---|
| Back Lane | PE31 6XJ |
| Bagthorpe Road | PE31 6XB |
| Barmer | PE31 8SR |
| Barwick | PE31 8PZ |
| Bell Meadows | PE31 8LA |
| Bircham Road | PE31 8PT |
| Bradmere Lane | PE31 8NQ |
| Brancaster Road | PE31 8NB PE31 8ND |
| Burnham Road | PE31 8QD |
| Carr Terrace | PE31 8UA |
| Chequers Street | PE31 8LH |
| Choseley Road | PE31 8LZ |
| Church Lane | PE31 6XS PE31 8QL |
| Church Place | PE31 8LW |
| Church Terrace | PE31 8LJ |
| Cross Lane | PE31 8PS |
| Crow Lane | PE31 6GX |
| Cuckoo Hill Road | PE31 6QX |
| Docking Road | PE31 6QP PE31 6QR PE31 8QF PE31 8QQ |
| East Lane | PE31 8NU |
| Eastwood | PE31 8NR |
| Fakenham Road | PE31 8NW PE31 8PX |
| Fring Road | PE31 6RE PE31 6XR |
| Harefields | PE31 8LL |
| Harewood | PE31 8NP |
| High Street | PE31 8LD PE31 8NG PE31 8NH |
| Hyde Close | PE31 6RB |
| Little Lane | PE31 8NT |
| Lynn Road | PE31 6QW PE31 6RJ |
| Middle Road | PE31 8NN |
| Mill Lane | PE31 8NX |
| Mission Lane | PE31 8NL |
| Monks Close | PE31 6RD |
| Norfolk Heights | PE31 8PW |
| Oddfellows Row | PE31 8NS |
| Parsons Lane | PE31 8QW |
| Pound Lane | PE31 8LP |
| Queens Crescent | PE31 6RF |
| Ringstead Road | PE31 8PL |
| Sandy Lane | PE31 8NF |
| Sedgeford Road | PE31 8PN |
| St Catherines Cross | PE31 8PJ |
| Stanhoe Road | PE31 6GP PE31 6QT PE31 8NJ PE31 8PA |
| Station Road | PE31 8LR PE31 8LS PE31 8LT PE31 8LX PE31 8LY PE31 8QN |
| Stocks Close | PE31 6QS |
| Summerfield | PE31 8PH |
| The Close | PE31 8NY |
| The Green | PE31 8QE |
| The Mount | PE31 8LN |
| Town Farm Barns | PE31 6WP |
| Well Street | PE31 8LQ |
| Winchmore Row | PE31 8NA |
| Windmill Hill | PE31 6SW |
| Woodgate Way | PE31 8PB |
| PE31 6RA PE31 8PE |
Transport near Docking
-
King's Lynn Station
-
Watlington Station
-
Skegness Station
-
Havenhouse Station
-
Wainfleet Station
-
Downham Market Station
-
Sheringham Station
-
Thorpe Culvert Station
-
West Runton Station
-
Cromer Station
- FAQ
- Price Paid By Year
- Property Type Price
Frequently asked questions about Docking
What is the average price for a property for sale in Docking?
The average price for a property for sale in Docking is £425,937. This amount is 42% higher than the average price in Kings Lynn. There are 208 property listings for sale in Docking.
What streets have the most expensive properties for sale in Docking?
The streets with the most expensive properties for sale in Docking are Parsons Lane at an average of £670,000, Sandy Lane at an average of £640,000 and Docking Road at an average of £632,487.
What streets have the most affordable properties for sale in Docking?
The streets with the most affordable properties for sale in Docking are The Close at an average of £192,500, Harewood at an average of £218,500 and Fring Road at an average of £230,000.
Which train stations are available in or near Docking?
Some of the train stations available in or near Docking are King's Lynn, Watlington and Skegness.
Property Price Paid in Docking by Year
The average sold property price by year was:
| Year | Average Sold Price | Price Change |
Sold Properties
|
|---|---|---|---|
| 2025 | £356,674 | -19% |
20 Properties |
| 2024 | £424,201 | -16% |
27 Properties |
| 2023 | £491,034 | -17% |
22 Properties |
| 2022 | £576,066 | 26% |
35 Properties |
| 2021 | £429,062 | -3% |
60 Properties |
| 2020 | £443,102 | 13% |
39 Properties |
| 2019 | £386,269 | 3% |
40 Properties |
| 2018 | £375,852 | 16% |
34 Properties |
| 2017 | £316,959 | 0,1% |
41 Properties |
| 2016 | £316,636 | 9% |
33 Properties |
| 2015 | £287,163 | -25% |
53 Properties |
| 2014 | £359,856 | 23% |
35 Properties |
| 2013 | £277,194 | 11% |
47 Properties |
| 2012 | £247,244 | -13% |
35 Properties |
| 2011 | £279,545 | 5% |
32 Properties |
| 2010 | £265,707 | -6% |
31 Properties |
| 2009 | £282,034 | -14% |
29 Properties |
| 2008 | £320,625 | 13% |
16 Properties |
| 2007 | £280,474 | 4% |
42 Properties |
| 2006 | £268,901 | 15% |
64 Properties |
| 2005 | £228,370 | 15% |
50 Properties |
| 2004 | £193,515 | -11% |
60 Properties |
| 2003 | £214,859 | 32% |
54 Properties |
| 2002 | £146,987 | 12% |
51 Properties |
| 2001 | £130,063 | 22% |
54 Properties |
| 2000 | £101,811 | -1% |
50 Properties |
| 1999 | £103,334 | 16% |
55 Properties |
| 1998 | £86,631 | 5% |
43 Properties |
| 1997 | £82,157 | 22% |
42 Properties |
| 1996 | £64,063 | 21% |
40 Properties |
| 1995 | £50,461 | - |
53 Properties |
Property Price per Property Type in Docking
Here you can find historic sold price data in order to help with your property search.
The average Property Paid Price for specific property types in the last three years are:
| Property Type | Average Sold Price | Sold Properties |
|---|---|---|
| Semi Detached House | £402,107.00 | 28 Semi Detached Houses |
| Detached House | £495,930.00 | 26 Detached Houses |
| Terraced House | £363,178.00 | 14 Terraced Houses |
| Flat | £152,000.00 | 1 Flat |

