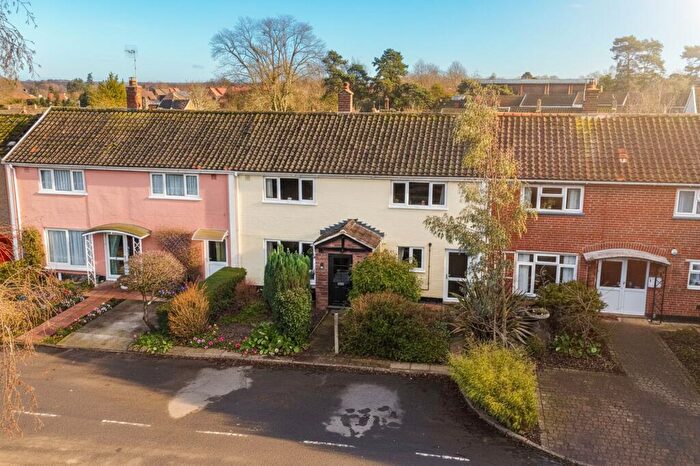
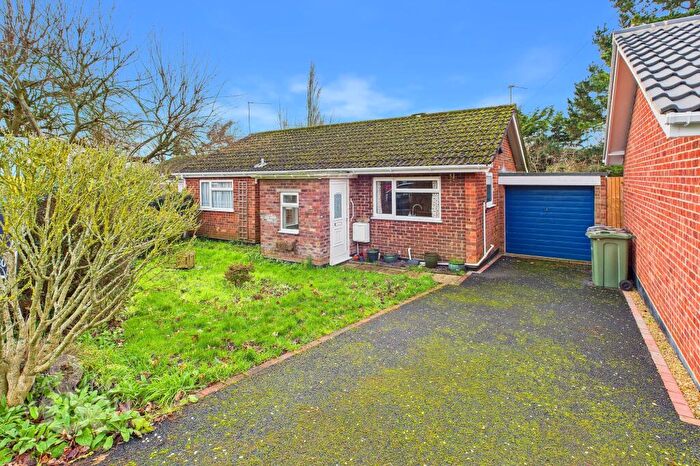
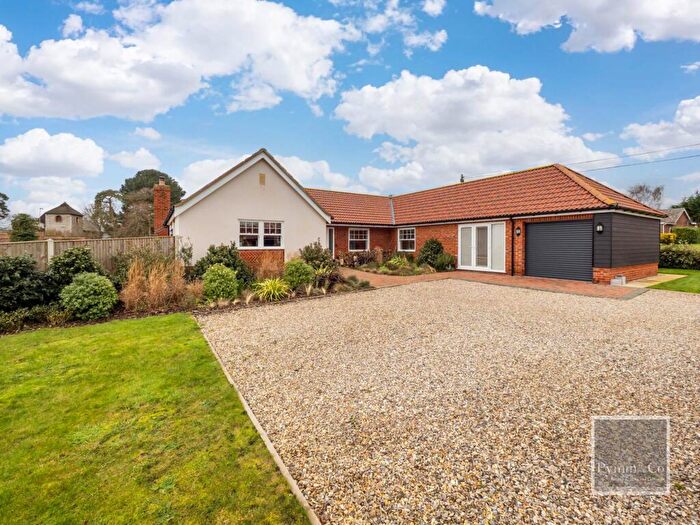
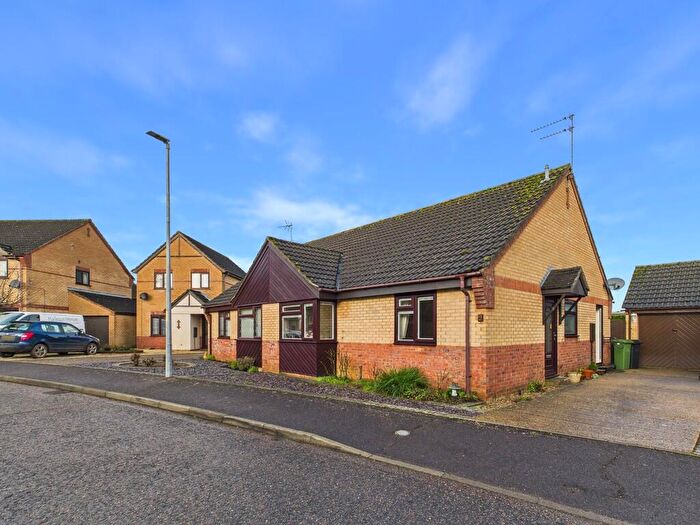
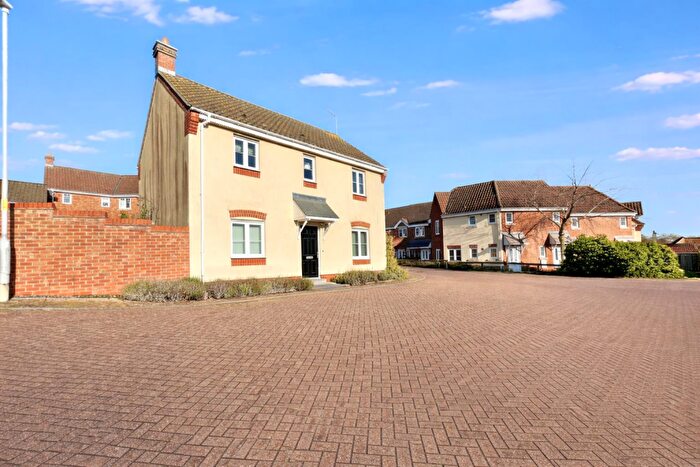
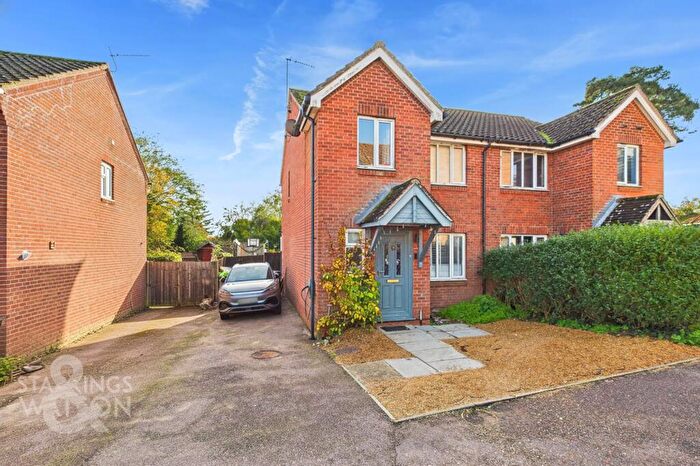
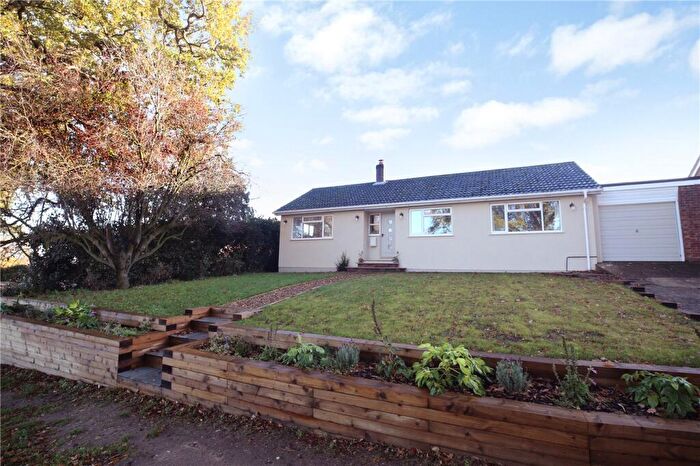
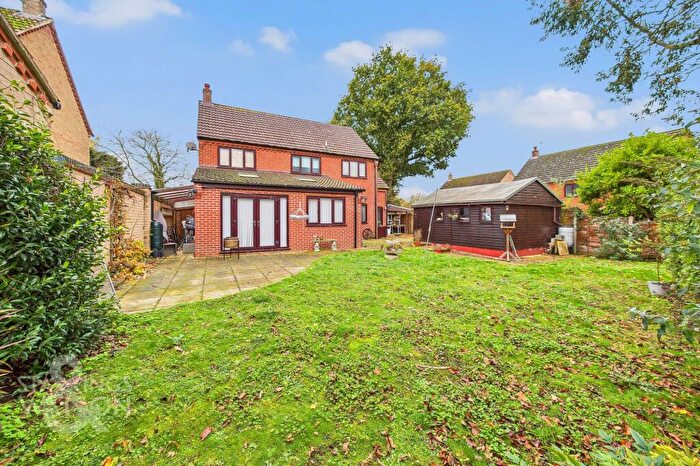
Houses for sale & to rent in Chedgrave And Thurton, Norwich
House Prices in Chedgrave And Thurton
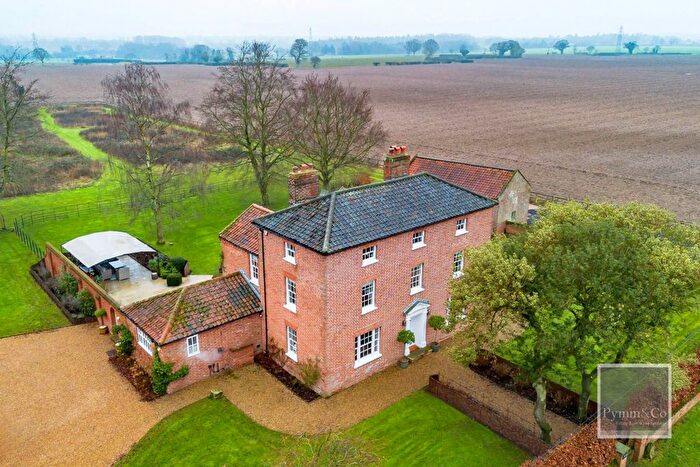
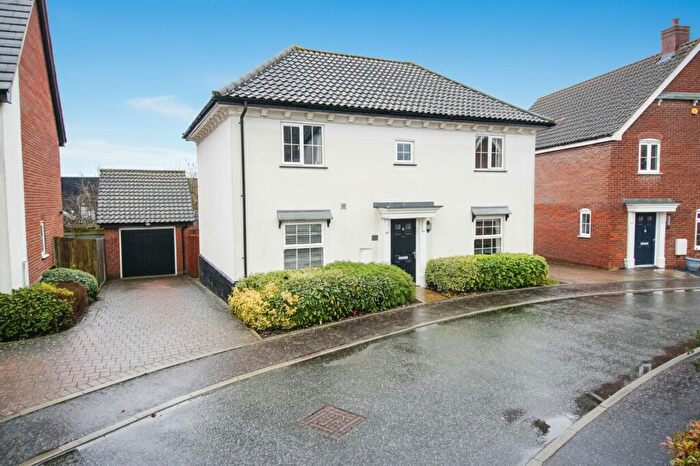
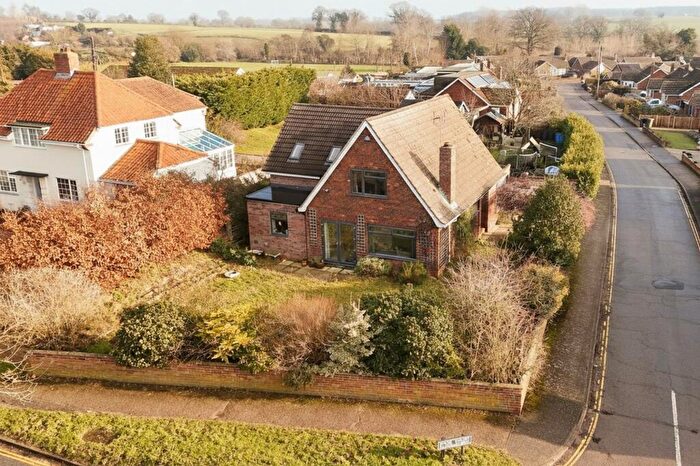
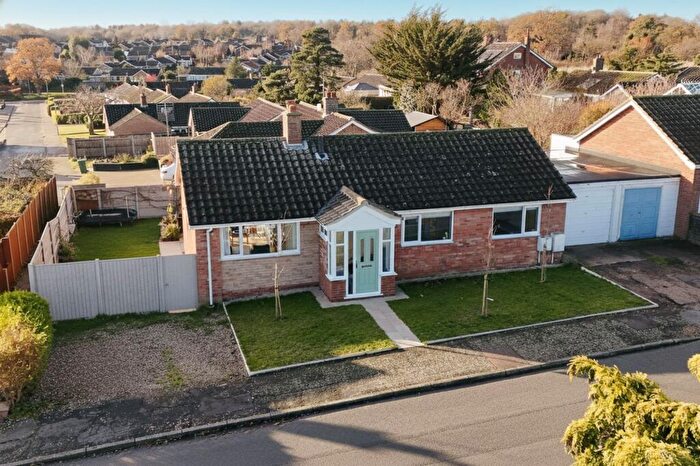
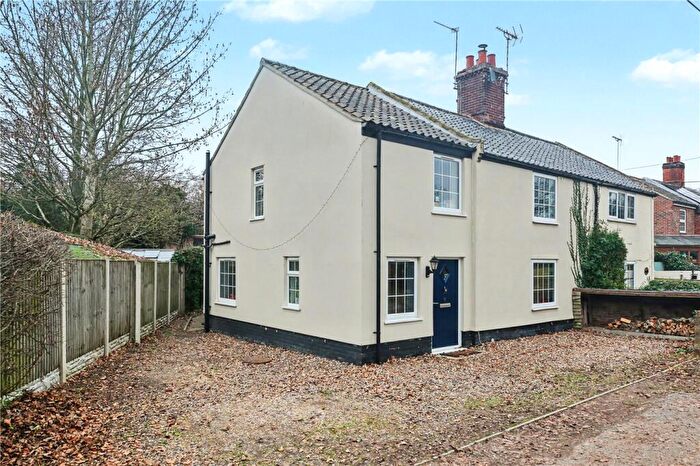
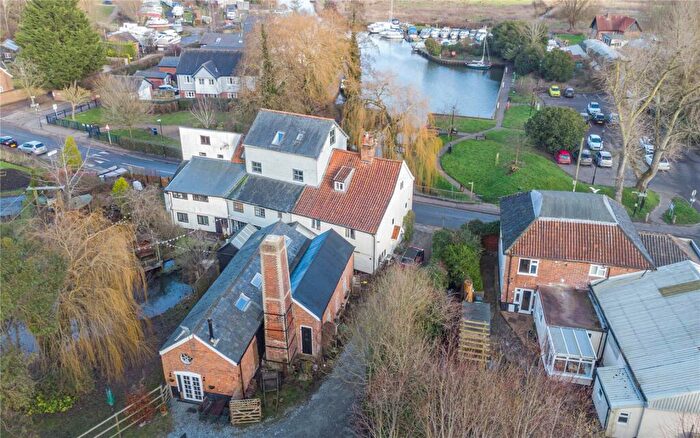
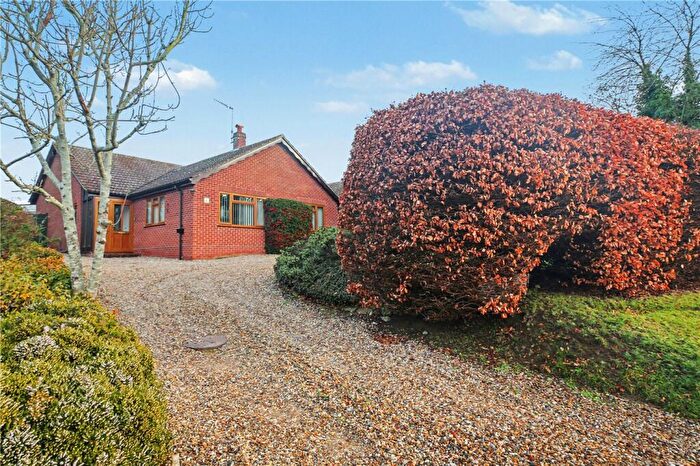
Properties in Chedgrave And Thurton have an average house price of £395,916.00 and had 87 Property Transactions within the last 3 years¹.
Chedgrave And Thurton is an area in Norwich, Norfolk with 1,070 households², where the most expensive property was sold for £930,000.00.
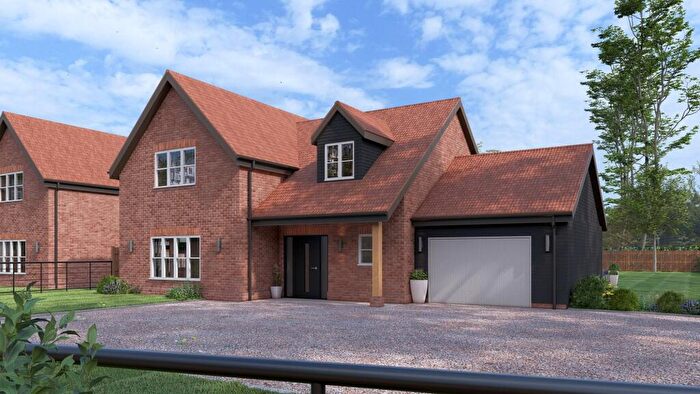
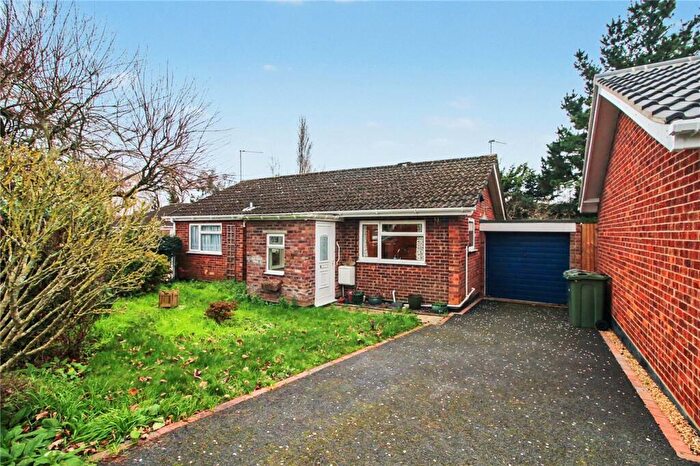
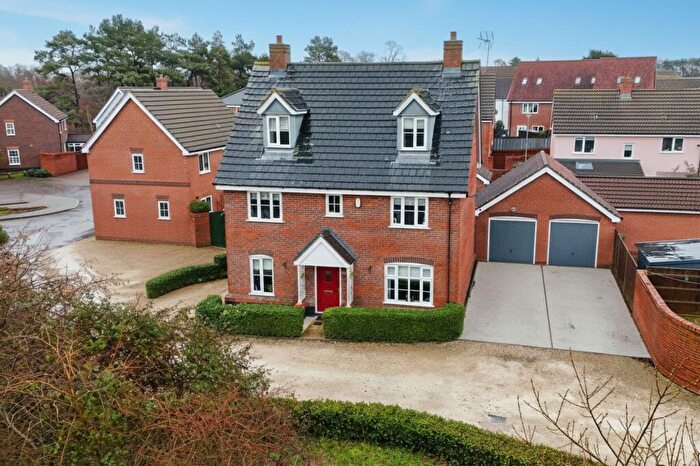
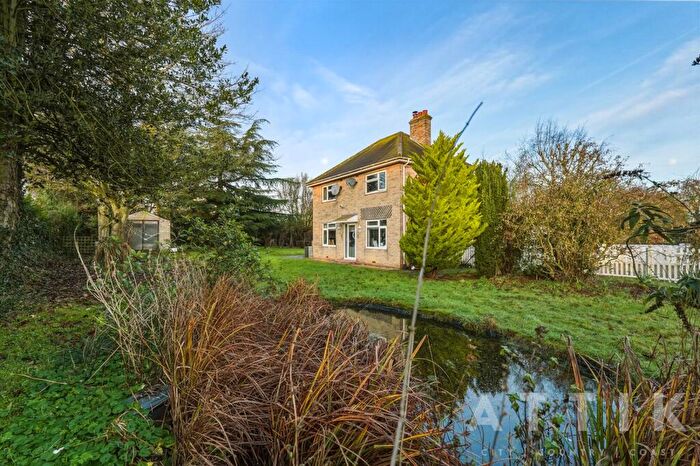
Properties for sale in Chedgrave And Thurton
Roads and Postcodes in Chedgrave And Thurton
Navigate through our locations to find the location of your next house in Chedgrave And Thurton, Norwich for sale or to rent.
| Streets | Postcodes |
|---|---|
| Ashby Road | NR14 6AT NR14 6AX |
| Beauchamp Close | NR14 6HT |
| Beauchamp Road | NR14 6HS |
| Big Back Lane | NR14 6BH |
| Chapel Lane | NR14 7AZ NR14 7BA |
| Chapel Road | NR14 7BH |
| Church Close | NR14 6NH |
| Church Lane | NR14 7HY |
| Church Road | NR14 7BJ |
| Claxton Corner | NR14 7HU |
| Claxton Mill | NR14 7UG |
| Cock Road | NR14 6BP |
| Cookes Road | NR14 6AE |
| Farm Close | NR14 6HQ |
| Ferry Road | NR14 6AQ NR14 7AY |
| Folly Lane | NR14 7AX |
| Forge Road | NR14 6BD |
| Foxglove Close | NR14 7HR |
| Gentlemans Walk | NR14 6DF |
| Grebe Drive | NR14 6GH |
| Hardley Road | NR14 6DA NR14 6NF NR14 6NG |
| Hardley Street | NR14 6BY |
| High Houses | NR14 6AG |
| Hillcrest | NR14 6HX |
| Hillside | NR14 6HZ |
| Hurst Road | NR14 6HJ |
| Langley Green | NR14 6DG |
| Langley Park | NR14 6BJ |
| Langley Road | NR14 6HD NR14 6HE NR14 6HF |
| Langley Street | NR14 6AD NR14 6DD NR14 6DE |
| Lion Lane | NR14 6HL |
| Loddon Road | NR14 6AN |
| Low Common | NR14 7BQ |
| Low Common Road | NR14 6AR |
| Mallard Close | NR14 6JB |
| Melrose Cottage | NR15 1BG |
| Mill Close | NR14 6AZ |
| Mill Common | NR14 7BW |
| Mill Lane | NR14 7AU |
| Mill Road | NR14 7BN |
| New Road | NR14 7BG |
| Norwich Road | NR14 6BG NR14 6BQ NR14 6HB NR14 6ND NR15 1AS |
| Park Close | NR14 6AU |
| Pits Lane | NR14 6NQ |
| Proctor Avenue | NR14 6HP |
| Proctor Close | NR14 6HR |
| Proctor Road | NR14 6HW |
| Rectory Lane | NR14 6NE |
| Red Lion Lane | NR15 1BU |
| Sandy Lane | NR14 7BB |
| Snows Hill | NR14 6HY |
| Snows Lane | NR14 6HU |
| St Ethelberts Close | NR14 6BA |
| St Georges Close | NR14 6AY |
| St Marys Road | NR14 7HN |
| The Common | NR14 6BE |
| The Crescent | NR14 6AS |
| The Meadows | NR14 6BB |
| The Street | NR14 6AL NR14 7AA NR14 7AS |
| The Warren | NR14 7AT |
| Vale Road | NR14 6AP |
| Wherry Close | NR14 6LS |
| Whiteheath Road | NR14 6AF |
Transport near Chedgrave And Thurton
- FAQ
- Price Paid By Year
- Property Type Price
Frequently asked questions about Chedgrave And Thurton
What is the average price for a property for sale in Chedgrave And Thurton?
The average price for a property for sale in Chedgrave And Thurton is £395,916. This amount is 29% higher than the average price in Norwich. There are 465 property listings for sale in Chedgrave And Thurton.
What streets have the most expensive properties for sale in Chedgrave And Thurton?
The streets with the most expensive properties for sale in Chedgrave And Thurton are Vale Road at an average of £700,000, Chapel Lane at an average of £570,000 and Norwich Road at an average of £556,111.
What streets have the most affordable properties for sale in Chedgrave And Thurton?
The streets with the most affordable properties for sale in Chedgrave And Thurton are Langley Road at an average of £269,500, Proctor Road at an average of £271,666 and Beauchamp Close at an average of £274,500.
Which train stations are available in or near Chedgrave And Thurton?
Some of the train stations available in or near Chedgrave And Thurton are Cantley, Buckenham and Reedham (Norfolk).
Property Price Paid in Chedgrave And Thurton by Year
The average sold property price by year was:
| Year | Average Sold Price | Price Change |
Sold Properties
|
|---|---|---|---|
| 2025 | £374,903 | -22% |
26 Properties |
| 2024 | £458,727 | 18% |
22 Properties |
| 2023 | £374,492 | -10% |
39 Properties |
| 2022 | £411,206 | 9% |
29 Properties |
| 2021 | £375,935 | 7% |
45 Properties |
| 2020 | £351,483 | 23% |
30 Properties |
| 2019 | £271,800 | -31% |
32 Properties |
| 2018 | £356,469 | 17% |
33 Properties |
| 2017 | £296,388 | 5% |
36 Properties |
| 2016 | £282,300 | 6% |
44 Properties |
| 2015 | £265,062 | 18% |
32 Properties |
| 2014 | £218,307 | -3% |
42 Properties |
| 2013 | £224,605 | -2% |
40 Properties |
| 2012 | £229,851 | 8% |
27 Properties |
| 2011 | £210,693 | -24% |
36 Properties |
| 2010 | £260,723 | 13% |
29 Properties |
| 2009 | £226,630 | 5% |
40 Properties |
| 2008 | £215,518 | -9% |
39 Properties |
| 2007 | £234,015 | 4% |
39 Properties |
| 2006 | £225,455 | 5% |
58 Properties |
| 2005 | £214,155 | 12% |
27 Properties |
| 2004 | £189,304 | -1% |
34 Properties |
| 2003 | £190,728 | 2% |
35 Properties |
| 2002 | £187,448 | 40% |
55 Properties |
| 2001 | £111,974 | 18% |
49 Properties |
| 2000 | £91,599 | 7% |
39 Properties |
| 1999 | £85,029 | 2% |
52 Properties |
| 1998 | £83,339 | 4% |
37 Properties |
| 1997 | £79,649 | 13% |
50 Properties |
| 1996 | £69,553 | 6% |
42 Properties |
| 1995 | £65,708 | - |
25 Properties |
Property Price per Property Type in Chedgrave And Thurton
Here you can find historic sold price data in order to help with your property search.
The average Property Paid Price for specific property types in the last three years are:
| Property Type | Average Sold Price | Sold Properties |
|---|---|---|
| Semi Detached House | £293,067.00 | 14 Semi Detached Houses |
| Detached House | £432,789.00 | 63 Detached Houses |
| Terraced House | £307,600.00 | 10 Terraced Houses |

