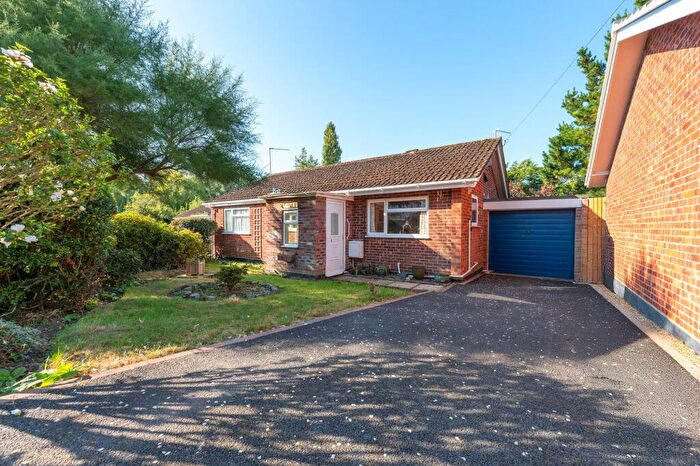
Houses for sale & to rent in Loddon, Norwich
House Prices in Loddon
Properties in Loddon have an average house price of £309,167.00 and had 97 Property Transactions within the last 3 years¹.
Loddon is an area in Norwich, Norfolk with 1,129 households², where the most expensive property was sold for £1,140,000.00.
Properties for sale in Loddon
Roads and Postcodes in Loddon
Navigate through our locations to find the location of your next house in Loddon, Norwich for sale or to rent.
| Streets | Postcodes |
|---|---|
| Alfric Close | NR14 6TW |
| Beccles Road | NR14 6JL NR14 6JQ |
| Beck Way | NR14 6UZ |
| Beech Close | NR14 6JF |
| Bridge Street | NR14 6EZ NR14 6LZ NR14 6NA |
| Bungay Road | NR14 6DZ |
| Cannell Road | NR14 6DW NR14 6TP |
| Captains Walk | NR14 6DJ |
| Cedar Drive | NR14 6LE |
| Church Plain | NR14 6EX NR14 6LX |
| Clay Court | NR14 6ES |
| Crossway Terrace | NR14 6JY |
| Davy Place | NR14 6JP |
| Drury Lane | NR14 6LB |
| Elm Close | NR14 6LG |
| Farthing Close | NR14 6DL |
| Filbert Road | NR14 6LW |
| Foxes Loke | NR14 6UL |
| Freeman Close | NR14 6UD |
| Garden Court | NR14 6LP |
| George Lane | NR14 6JZ NR14 6NB |
| Gilbert Grove | NR14 6UA |
| Gunton Road | NR14 6DP |
| Halfpenny Court | NR14 6DN |
| Harvey Green | NR14 6UB |
| Hawthorne Close | NR14 6UX |
| High Bungay Road | NR14 6DX NR14 6JR NR14 6JS NR14 6JT |
| High Street | NR14 6AH NR14 6ET |
| Hobart Road | NR14 6LA NR14 6LD |
| Homebred Lane | NR14 6UY |
| Ingloss Lane | NR14 6ED |
| Kingfisher Walk | NR14 6FB |
| Kings Wood | NR14 6UN |
| Kittens Lane | NR14 6JU NR14 6JX |
| Leman Close | NR14 6LJ |
| Leman Grove | NR14 6LH NR14 6LQ |
| Longfield Close | NR14 6UU |
| Low Bungay Road | NR14 6JW |
| Market Place | NR14 6EY |
| Mill Road | NR14 6DR |
| Mundham Road | NR14 6EB |
| Norton Road | NR14 6DT NR14 6DU NR14 6JN |
| Oakfields | NR14 6UT |
| Old Market Green | NR14 6QG |
| Poppy Close | NR14 6UR |
| Princess Anne Terrace | NR14 6LL |
| Pyes Mill Road | NR14 6DS |
| Reeds Way | NR14 6FE |
| Sale Court | NR14 6QF |
| Sisland | NR14 6EE NR14 6EF |
| Stubbs Green | NR14 6EA |
| Stubbs Green Lane | NR14 6DY |
| Sycamore Close | NR14 6LF |
| The Walks | NR14 6LN |
| Town Farm Drive | NR14 6FF |
| Transport Lane | NR14 6QW |
| Trinity Square | NR14 6FG |
| Warren View | NR14 6ER |
| Water Meadow Close | NR14 6UP |
Transport near Loddon
- FAQ
- Price Paid By Year
- Property Type Price
Frequently asked questions about Loddon
What is the average price for a property for sale in Loddon?
The average price for a property for sale in Loddon is £309,167. This amount is 0.42% higher than the average price in Norwich. There are 345 property listings for sale in Loddon.
What streets have the most expensive properties for sale in Loddon?
The streets with the most expensive properties for sale in Loddon are Town Farm Drive at an average of £574,333, Market Place at an average of £535,000 and Beccles Road at an average of £508,200.
What streets have the most affordable properties for sale in Loddon?
The streets with the most affordable properties for sale in Loddon are Trinity Square at an average of £132,250, Beck Way at an average of £146,500 and Warren View at an average of £172,000.
Which train stations are available in or near Loddon?
Some of the train stations available in or near Loddon are Cantley, Reedham (Norfolk) and Buckenham.
Property Price Paid in Loddon by Year
The average sold property price by year was:
| Year | Average Sold Price | Price Change |
Sold Properties
|
|---|---|---|---|
| 2025 | £270,583 | -24% |
30 Properties |
| 2024 | £336,711 | 7% |
39 Properties |
| 2023 | £312,142 | 4% |
28 Properties |
| 2022 | £298,570 | -3% |
44 Properties |
| 2021 | £306,690 | 16% |
60 Properties |
| 2020 | £256,786 | 7% |
40 Properties |
| 2019 | £237,596 | 8% |
45 Properties |
| 2018 | £219,134 | -7% |
50 Properties |
| 2017 | £233,555 | 15% |
39 Properties |
| 2016 | £199,613 | -16% |
52 Properties |
| 2015 | £231,874 | 8% |
72 Properties |
| 2014 | £213,810 | 8% |
71 Properties |
| 2013 | £197,404 | -2% |
53 Properties |
| 2012 | £202,169 | -2% |
36 Properties |
| 2011 | £205,256 | 14% |
44 Properties |
| 2010 | £177,341 | -5% |
23 Properties |
| 2009 | £187,013 | -40% |
26 Properties |
| 2008 | £262,133 | 17% |
21 Properties |
| 2007 | £216,283 | 13% |
71 Properties |
| 2006 | £187,396 | 3% |
76 Properties |
| 2005 | £181,233 | 6% |
60 Properties |
| 2004 | £170,939 | 20% |
53 Properties |
| 2003 | £137,456 | 11% |
63 Properties |
| 2002 | £122,909 | 21% |
71 Properties |
| 2001 | £97,606 | 1% |
50 Properties |
| 2000 | £96,349 | 27% |
73 Properties |
| 1999 | £70,146 | 11% |
69 Properties |
| 1998 | £62,269 | 11% |
70 Properties |
| 1997 | £55,595 | -2% |
79 Properties |
| 1996 | £56,683 | -0,1% |
80 Properties |
| 1995 | £56,753 | - |
74 Properties |
Property Price per Property Type in Loddon
Here you can find historic sold price data in order to help with your property search.
The average Property Paid Price for specific property types in the last three years are:
| Property Type | Average Sold Price | Sold Properties |
|---|---|---|
| Semi Detached House | £271,616.00 | 30 Semi Detached Houses |
| Detached House | £432,514.00 | 34 Detached Houses |
| Terraced House | £239,528.00 | 26 Terraced Houses |
| Flat | £129,642.00 | 7 Flats |

