
Houses for sale in Gillingham, Norwich
House Prices in Gillingham
Properties in Gillingham have an average house price of £331k and had 19 Property Transactions within the last 3 years¹.
Gillingham is an area in Norwich, Norfolk with 258 households², where the most expensive property was sold for £685k.
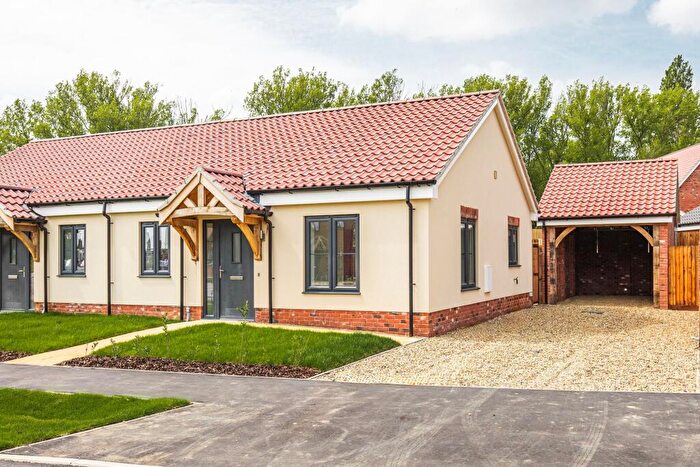
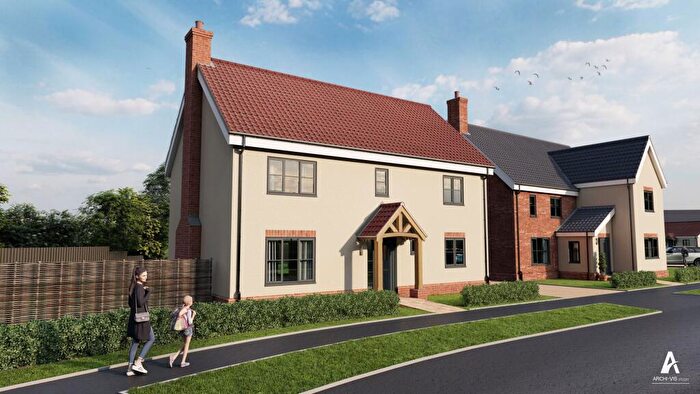
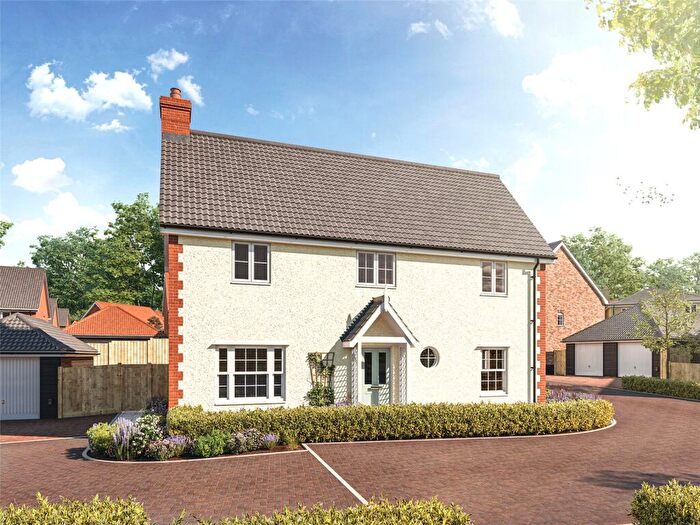
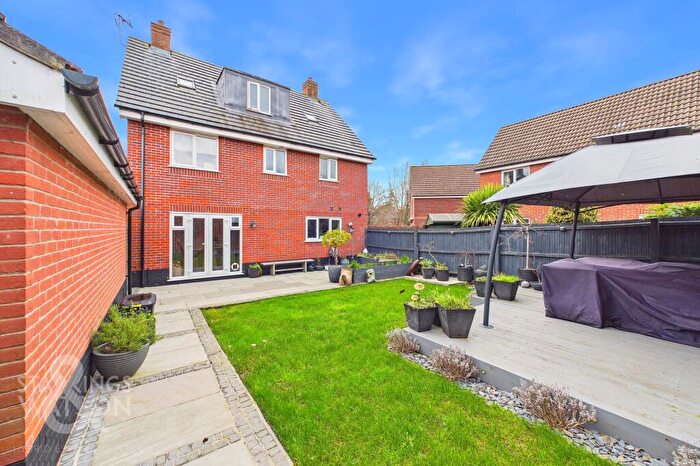
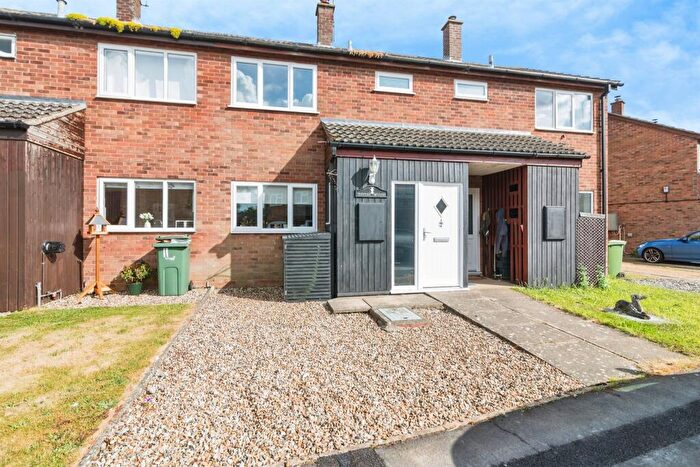
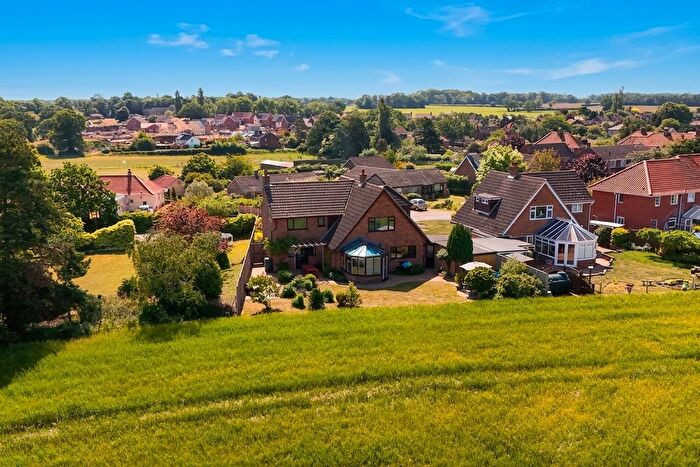
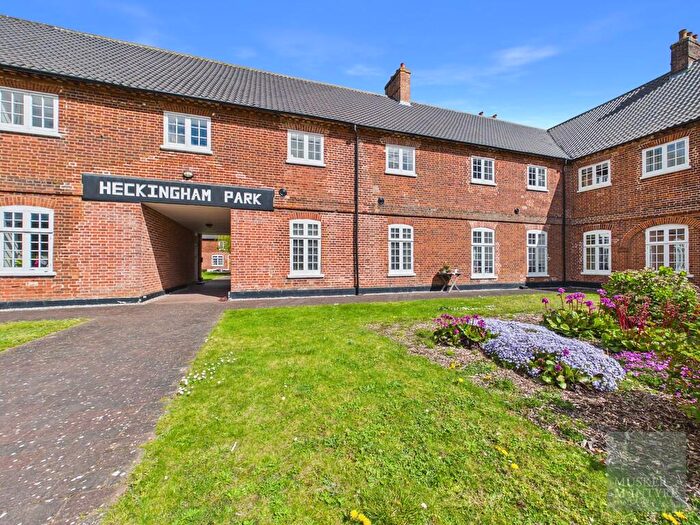
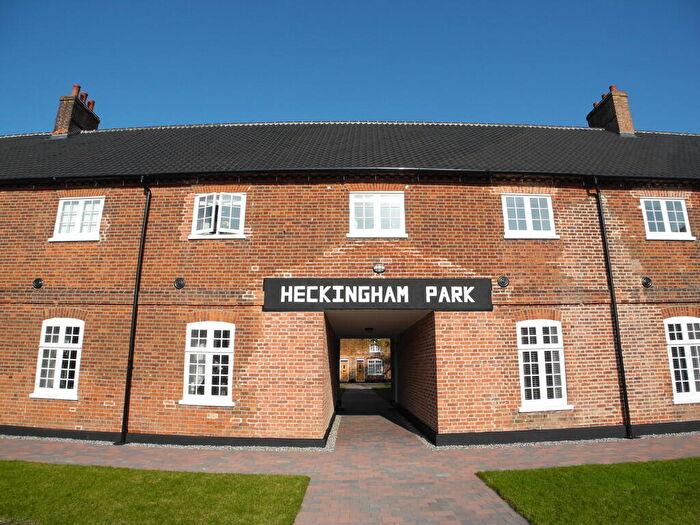
Properties for sale in Gillingham
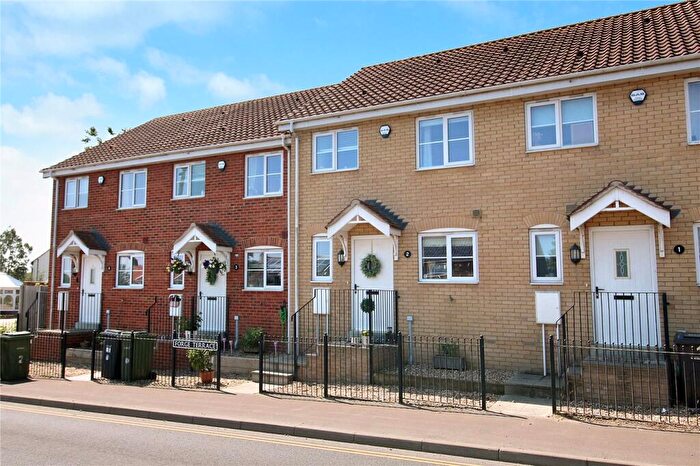
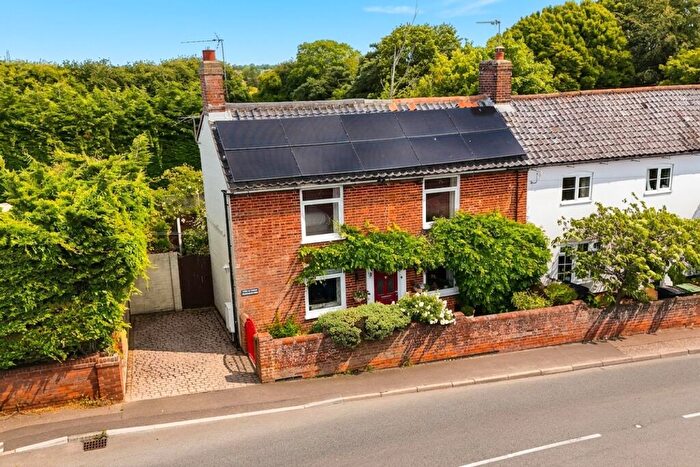


![]()
If you are looking to sell your house, let it out, or receive a property valuation, an expert can help you.
Click the button below to get started.

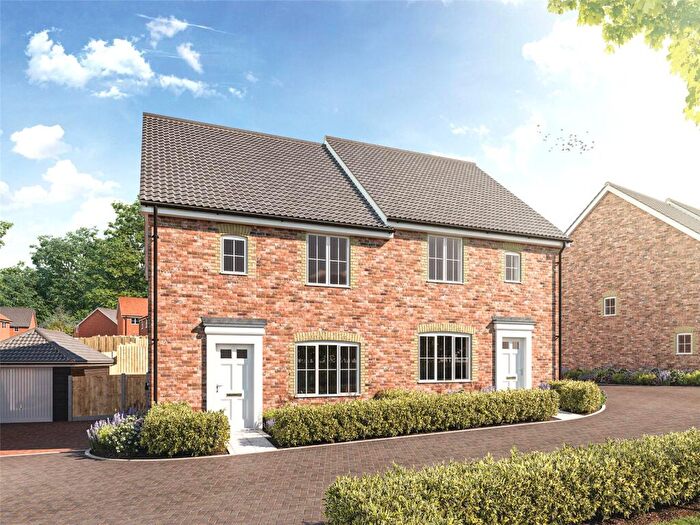
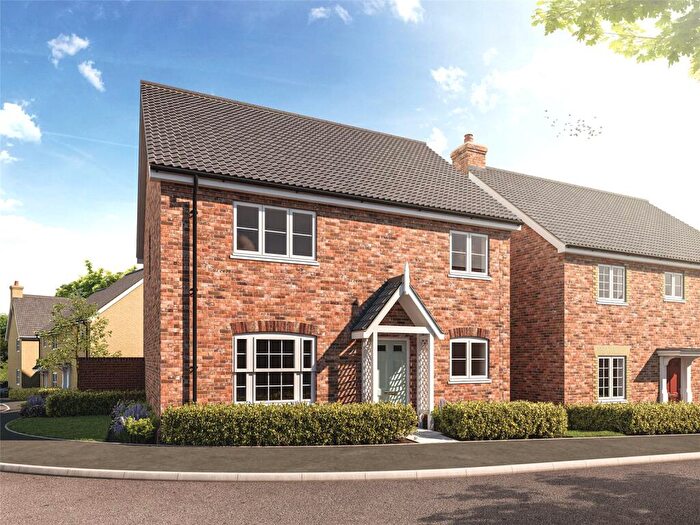
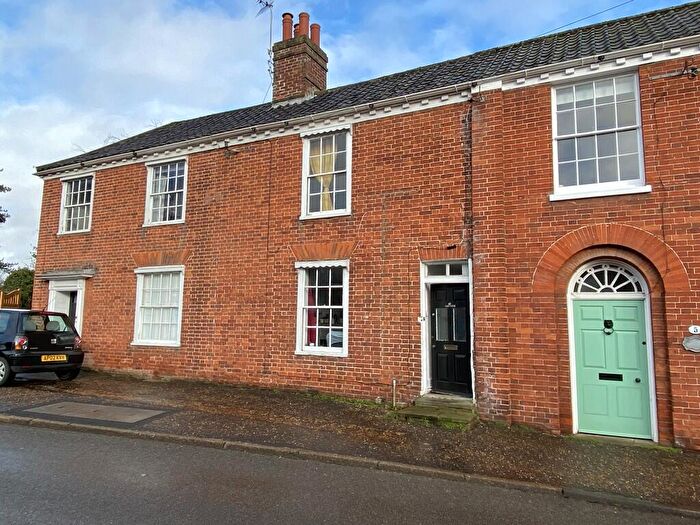
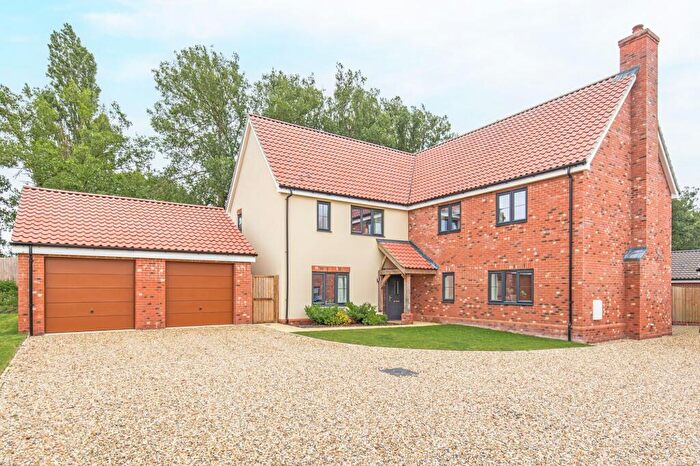
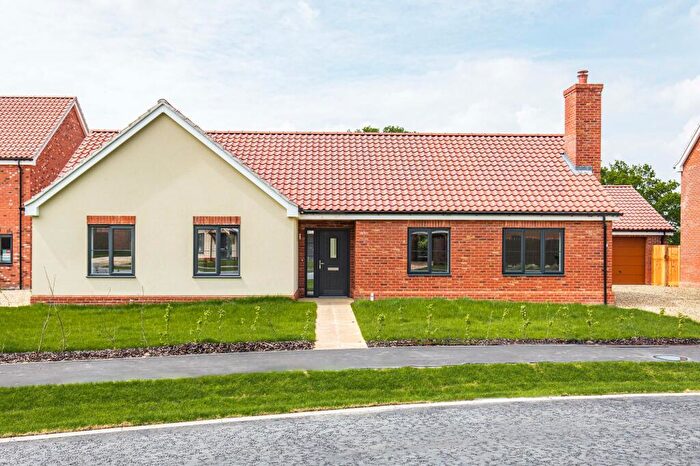
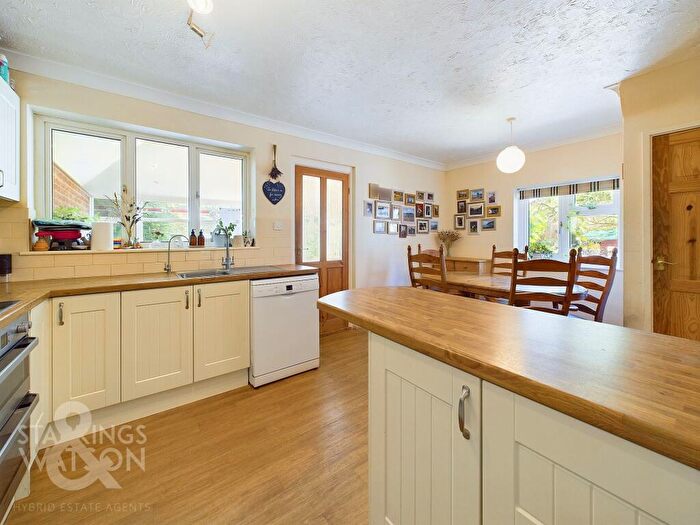
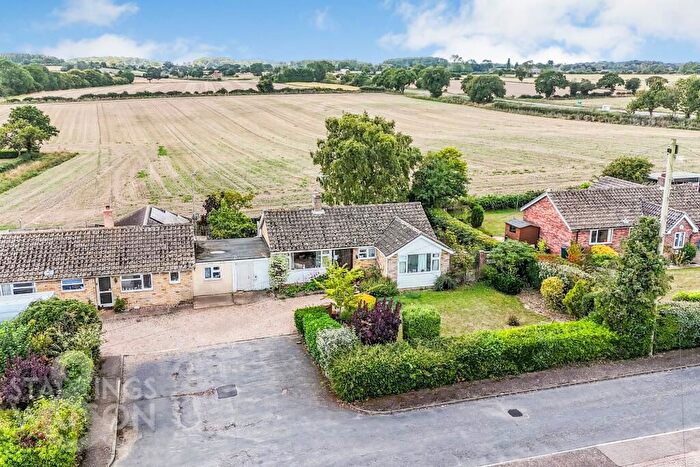
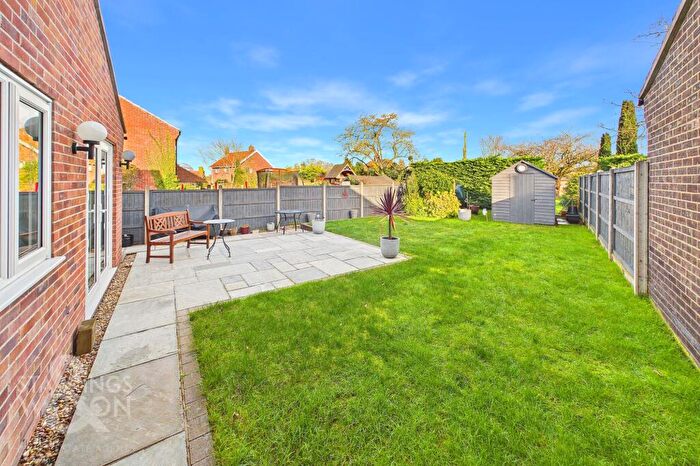
Previously listed properties in Gillingham
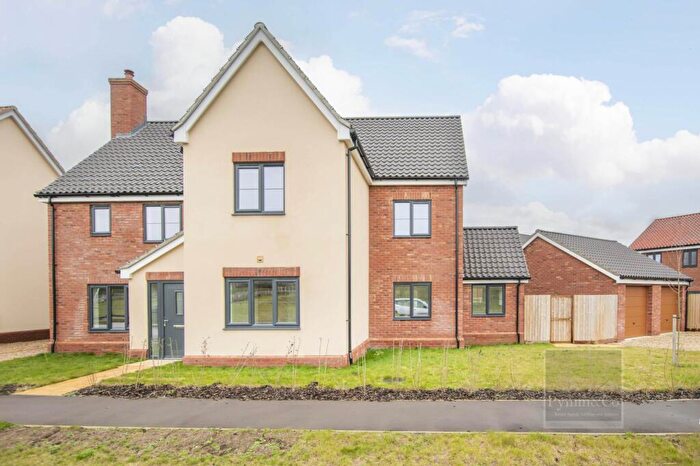
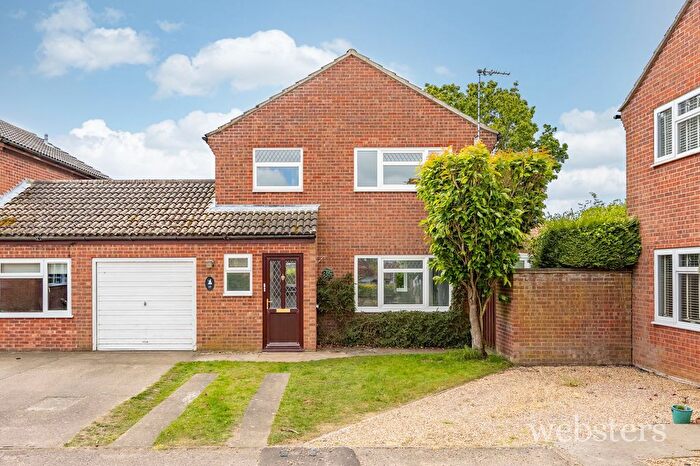
![]()
If you are looking to sell your house, let it out, or receive a property valuation, an expert can help you.
Click the button below to get started.
Roads and Postcodes in Gillingham
Navigate through our locations to find the location of your next house in Gillingham, Norwich for sale or to rent.
| Streets | Postcodes |
|---|---|
| Beccles Road | NR14 6NX NR14 6QJ NR14 6SR |
| Briar Lane | NR14 6SY |
| Church Lane | NR14 6QL |
| Gale Close | NR14 6SN |
| Green Lane | NR14 6TA |
| Green Road | NR14 6TB |
| Hales Green | NR14 6GZ |
| Heckingham Holes | NR14 6QS |
| Millside | NR14 6SW |
| Norton Road | NR14 6QR |
| Preston Lane | NR14 6ST |
| Readscross Lane | NR14 6TD |
| School Lane | NR14 6QP NR14 6SL NR14 6SU |
| The Boltons | NR14 6SS |
| Wood End Close | NR14 6SZ |
| Yarmouth Road | NR14 6AB NR14 6SP NR14 6SX |
Property price trends in Gillingham
According to the latest Land Registry data, the average home in Gillingham sold for £205,000 in 2026. That figure comes from 294 sales logged over the past 31 years.
Prices have fallen back over the last three years. Compared with 2023, when the typical sale came in around £335,857, that's a fall of roughly 39%.
Looking back five years, average prices are down about 30% since 2021, a drop of around £87,750 in cash terms.
Zoom out to the past decade for the fuller picture. Back in 2016, homes here averaged £289,450, so the typical sold price has fallen about 29.2% since then, around 3.4% a year lower. Stretch the view to fifteen years and that annual pace edges up closer to -0.6%.
Frequently asked questions about Gillingham
What is the average price for a property for sale in Gillingham?
The average price for a property for sale in Gillingham is £330,973. This amount is 7% higher than the average price in Norwich. There are 129 property listings for sale in Gillingham.
What streets have the most expensive properties for sale in Gillingham?
The streets with the most expensive properties for sale in Gillingham are Hales Green at an average of £685,000, School Lane at an average of £445,000 and Yarmouth Road at an average of £410,000.
What streets have the most affordable properties for sale in Gillingham?
The streets with the most affordable properties for sale in Gillingham are Wood End Close at an average of £221,000, Millside at an average of £241,600 and Preston Lane at an average of £270,000.
Which train stations are available in or near Gillingham?
Some of the train stations available in or near Gillingham are Reedham (Norfolk), Cantley and Haddiscoe.
Property Price Paid in Gillingham by Year
The average sold property price by year was:
| Year | Average Sold Price | Price Change |
Sold Properties
|
|---|---|---|---|
| 2026 | £205,000 | -89% |
1 Property |
| 2025 | £387,916 | 28% |
6 Properties |
| 2024 | £281,000 | -20% |
5 Properties |
| 2023 | £335,857 | 11% |
7 Properties |
| 2022 | £299,650 | 2% |
10 Properties |
| 2021 | £292,750 | 9% |
6 Properties |
| 2020 | £266,346 | 15% |
13 Properties |
| 2019 | £227,714 | -19% |
7 Properties |
| 2018 | £271,625 | 14% |
8 Properties |
| 2017 | £233,433 | -24% |
15 Properties |
Property Price per Property Type in Gillingham
Here you can find historic sold price data in order to help with your property search.
The average Property Paid Price for specific property types in the last three years are:
| Property Type | Average Sold Price | Sold Properties |
|---|---|---|
| Semi Detached House | £271,285.00 | 7 Semi Detached Houses |
| Terraced House | £211,250.00 | 4 Terraced Houses |
| Detached House | £443,062.00 | 8 Detached Houses |
