
Houses for sale & to rent in DN39 6SR, Thornton Lane, Ferry, Ulceby
House Prices in DN39 6SR, Thornton Lane, Ferry
Properties in DN39 6SR have no sales history available within the last 3 years. DN39 6SR is a postcode in Thornton Lane located in Ferry, an area in Ulceby, North Lincolnshire, with 3 households².
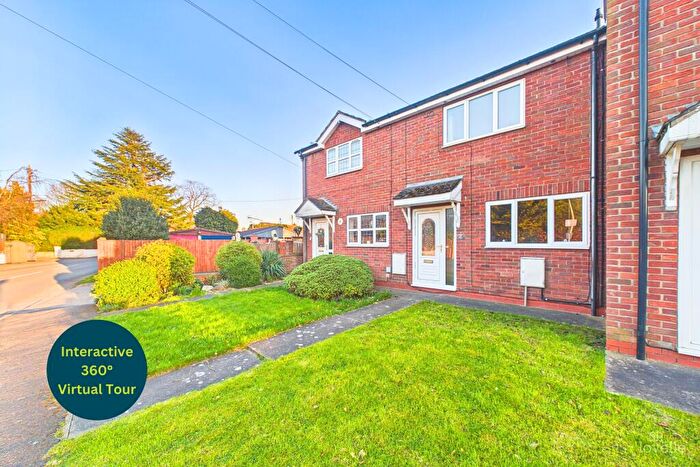
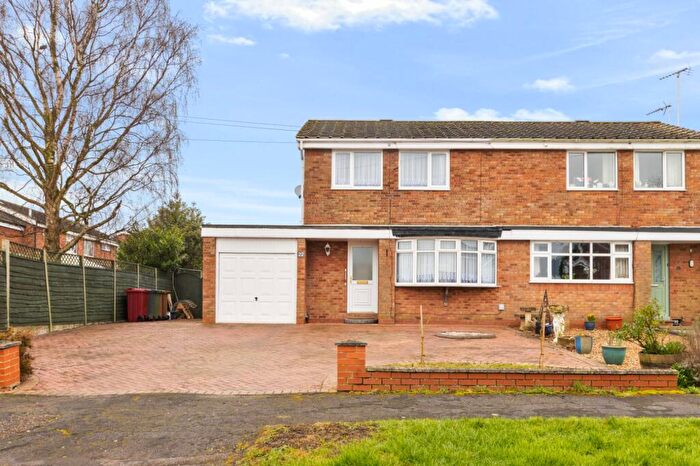
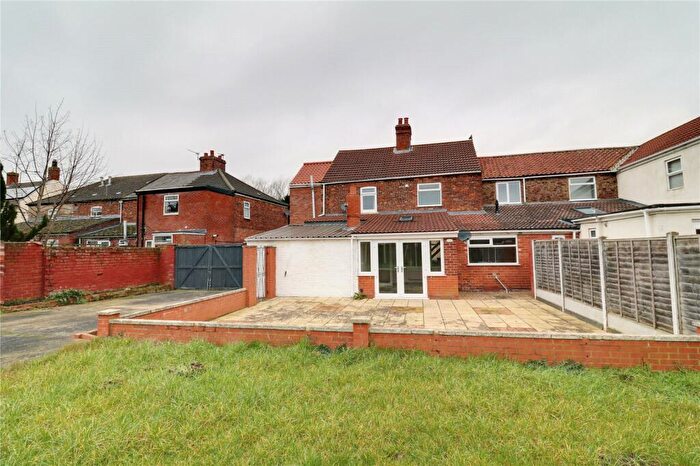
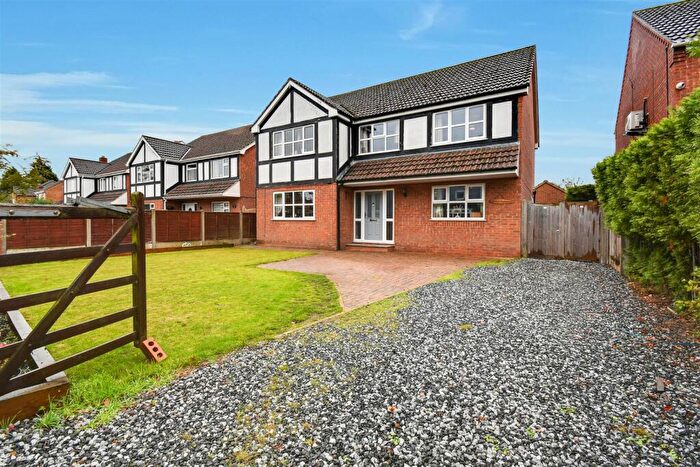
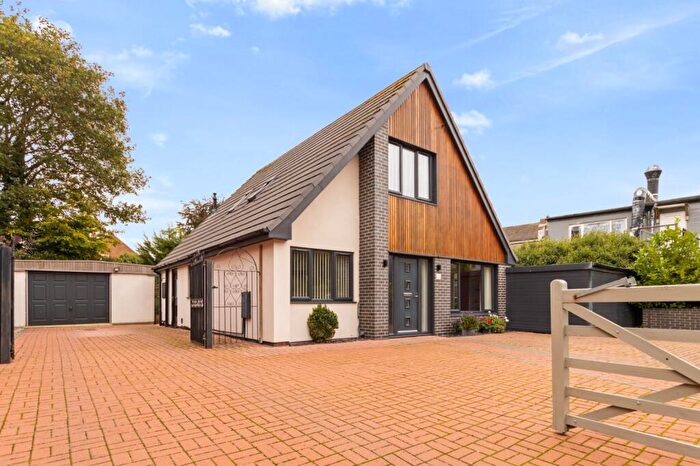
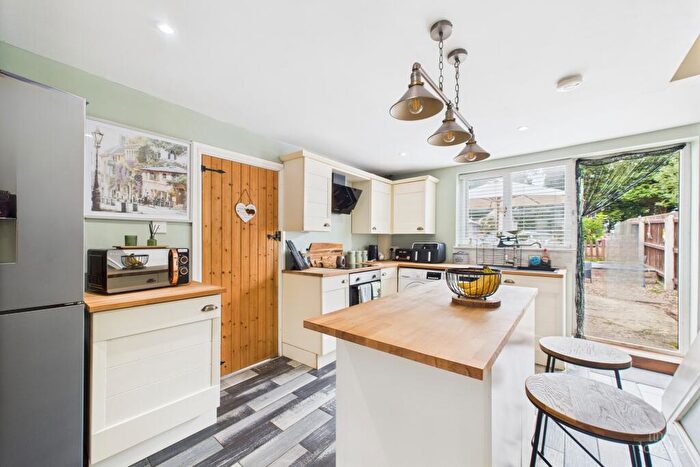
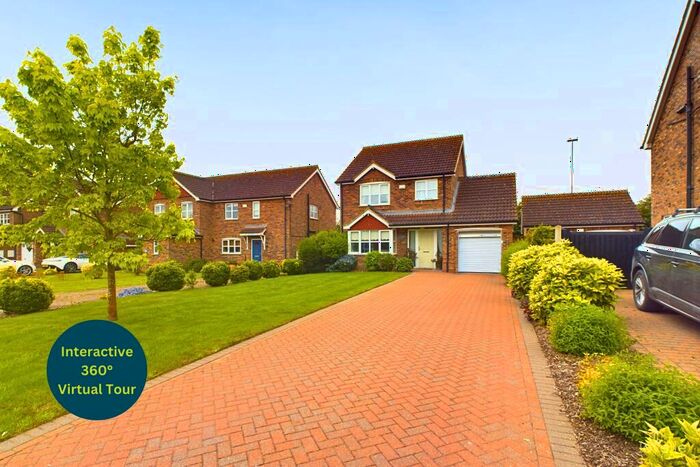
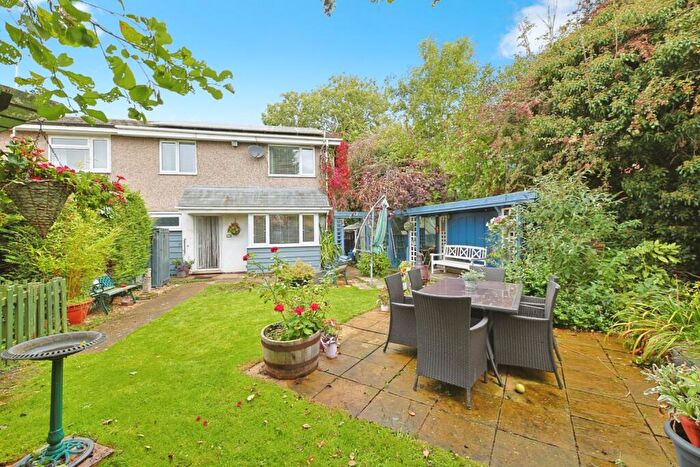
Properties for sale near DN39 6SR, Thornton Lane
![]()
If you are looking to sell your house, let it out, or receive a property valuation, an expert can help you.
Click the button below to get started.
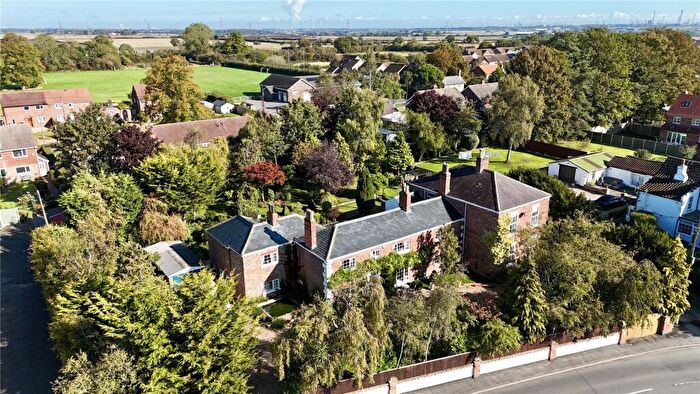
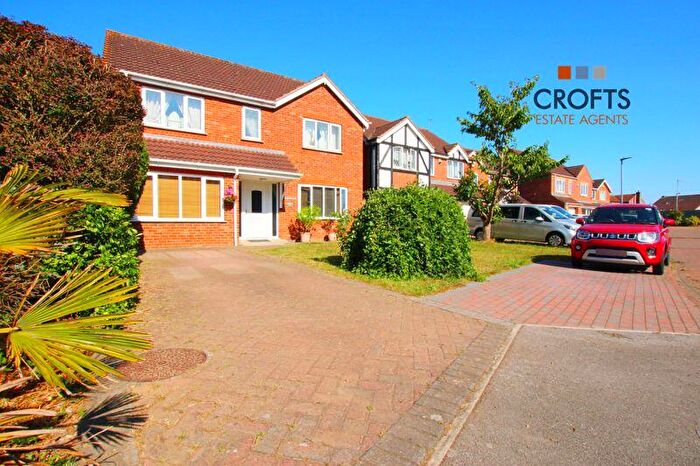
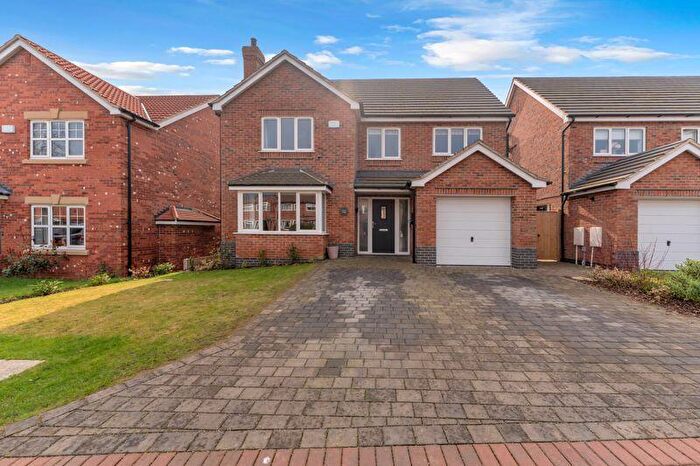
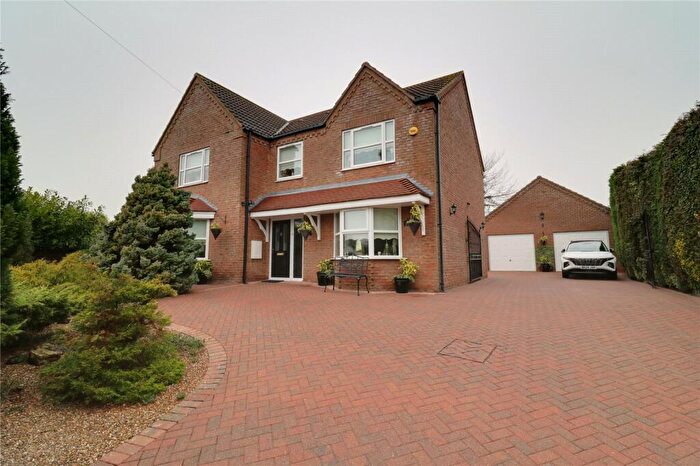
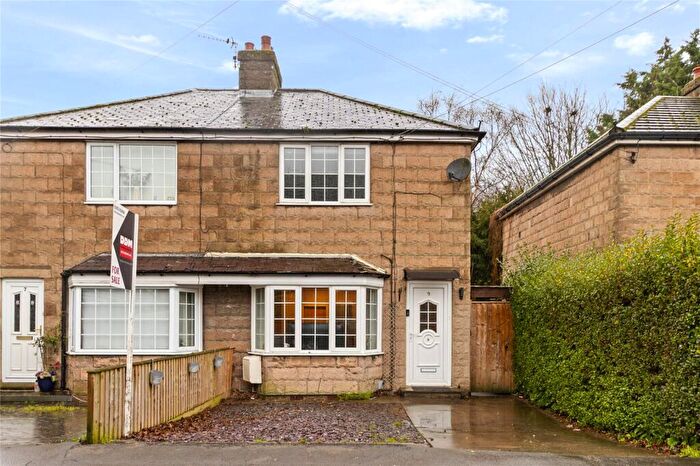
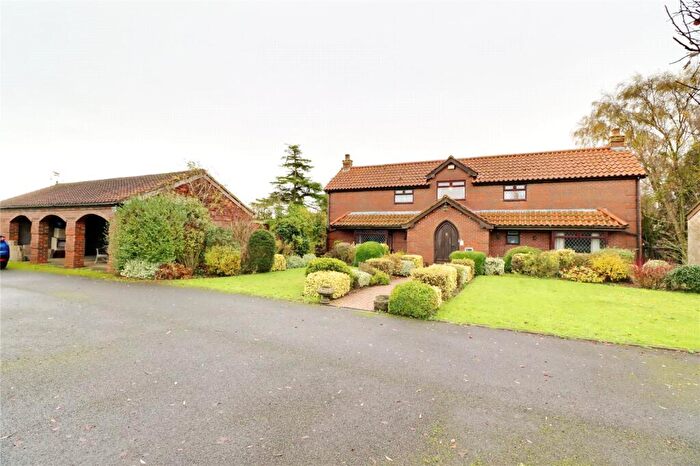
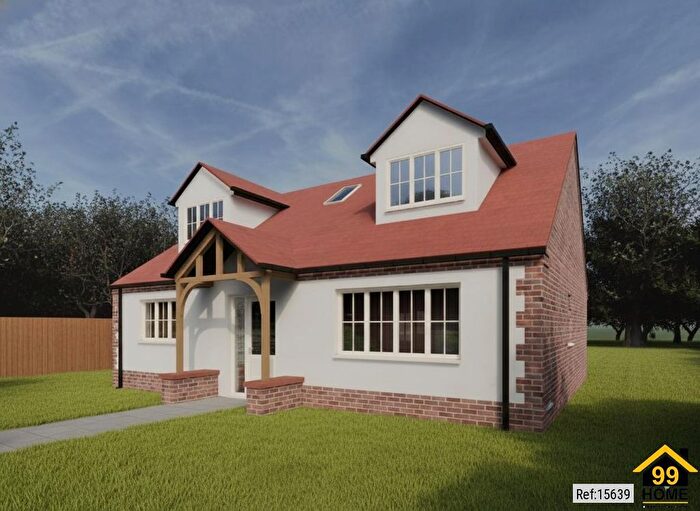
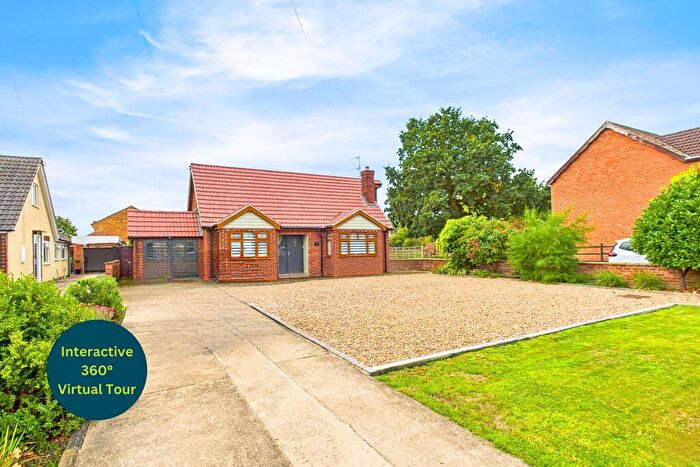
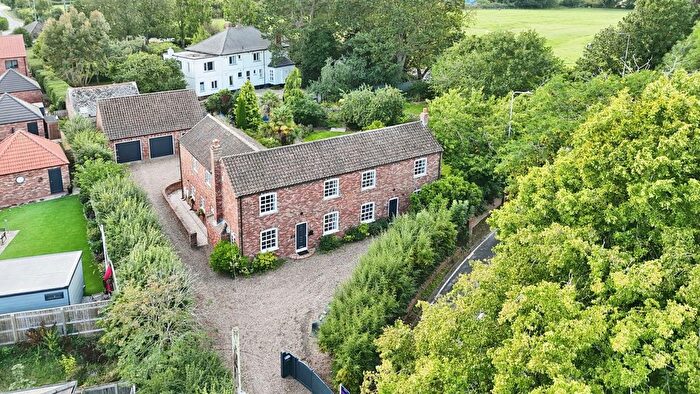
Previously listed properties near DN39 6SR, Thornton Lane
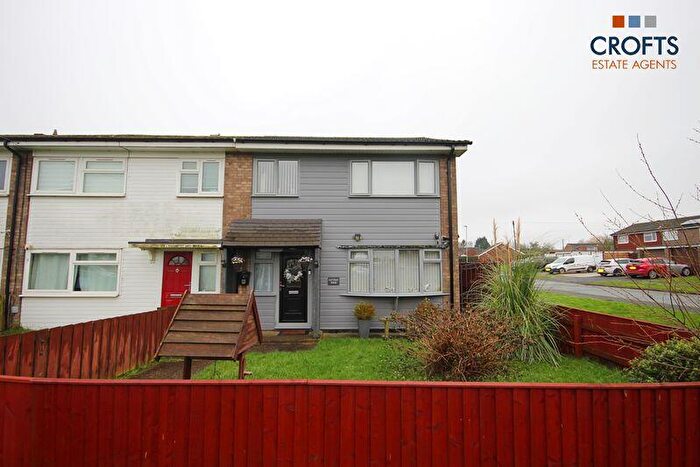
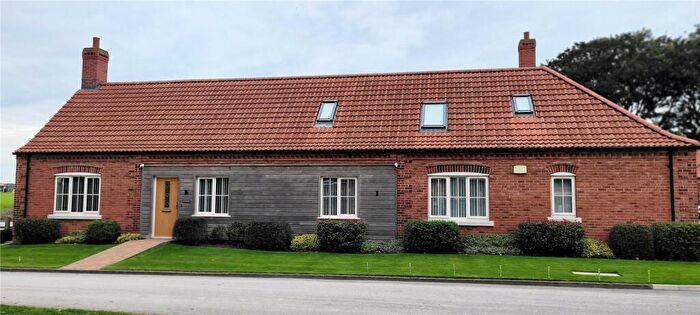
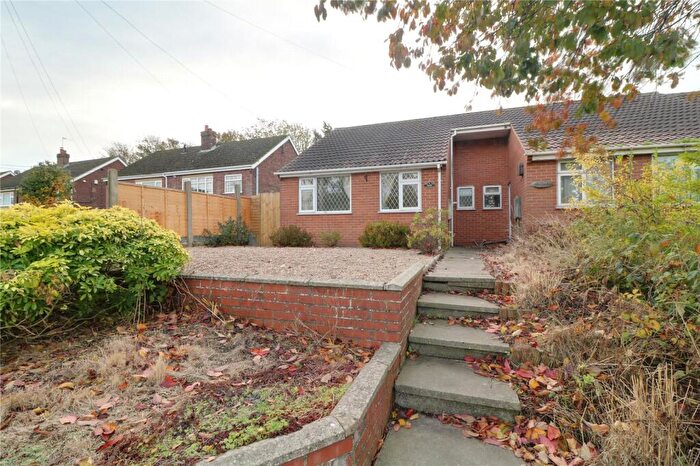

![]()
If you are looking to sell your house, let it out, or receive a property valuation, an expert can help you.
Click the button below to get started.

Price Paid in Thornton Lane, DN39 6SR, Ferry
2 Thornton Lane, DN39 6SR, Ferry Ulceby
Property 2 has been sold 1 time. The last time it was sold was in 09/09/2021 and the sold price was £350,000.00.
This detached house, sold as a freehold on 09/09/2021, is a 191 sqm detached house with an EPC rating of D.
| Date | Price | Property Type | Tenure | Classification |
|---|---|---|---|---|
| 09/09/2021 | £350,000.00 | Detached House | freehold | Established Building |
4 Thornton Lane, DN39 6SR, Ferry Ulceby
Property 4 has been sold 3 times. The last time it was sold was in 20/04/2018 and the sold price was £262,500.00.
This detached house, sold as a freehold on 20/04/2018, is a 142 sqm detached bungalow with an EPC rating of D.
| Date | Price | Property Type | Tenure | Classification |
|---|---|---|---|---|
| 20/04/2018 | £262,500.00 | Detached House | freehold | Established Building |
| 04/12/2012 | £217,500.00 | Detached House | freehold | Established Building |
| 17/11/2006 | £248,750.00 | Detached House | freehold | New Build |
6 Thornton Lane, DN39 6SR, Ferry Ulceby
Property 6 has been sold 1 time. The last time it was sold was in 16/08/2011 and the sold price was £140,000.00.
This is a Detached House which was sold as a freehold in 16/08/2011
| Date | Price | Property Type | Tenure | Classification |
|---|---|---|---|---|
| 16/08/2011 | £140,000.00 | Detached House | freehold | Established Building |
Transport near DN39 6SR, Thornton Lane

House price paid reports for DN39 6SR, Thornton Lane
Click on the buttons below to see price paid reports by year or property price:
- Price Paid By Year
Property Price Paid in DN39 6SR, Thornton Lane by Year
The average sold property price by year was:
| Year | Average Sold Price | Price Change |
Sold Properties
|
|---|---|---|---|
| 2021 | £350,000 | 25% |
1 Property |
| 2018 | £262,500 | 17% |
1 Property |
| 2012 | £217,500 | 36% |
1 Property |
| 2011 | £140,000 | -78% |
1 Property |
| 2006 | £248,750 | - |
1 Property |