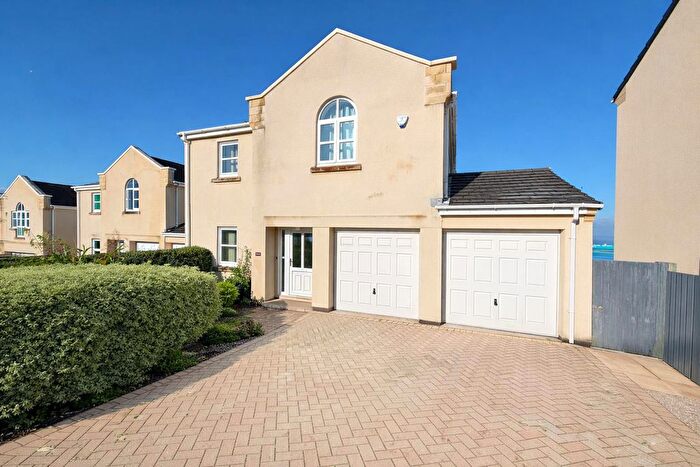
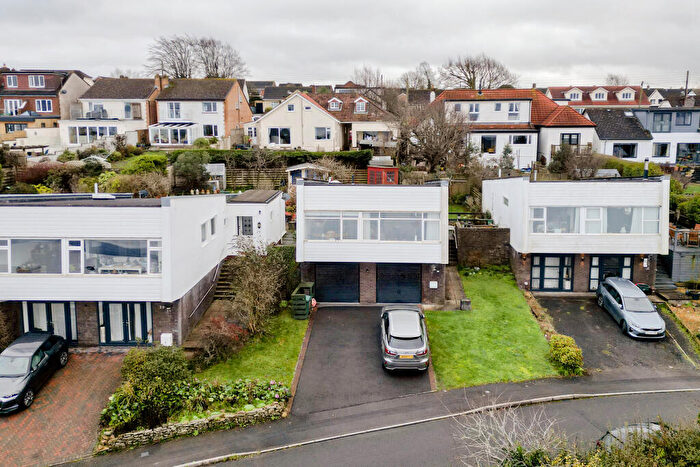
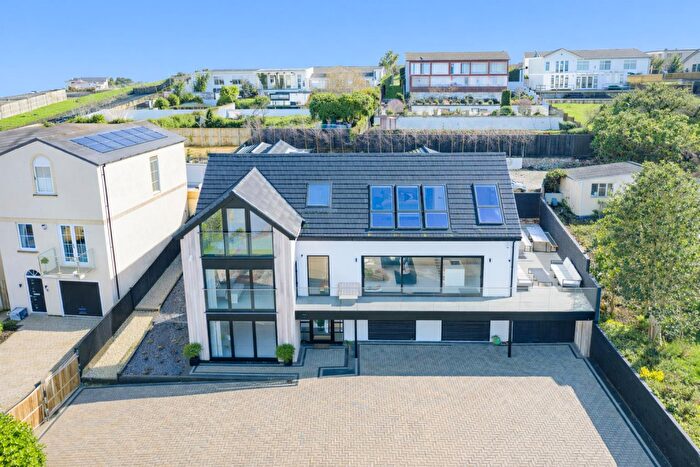
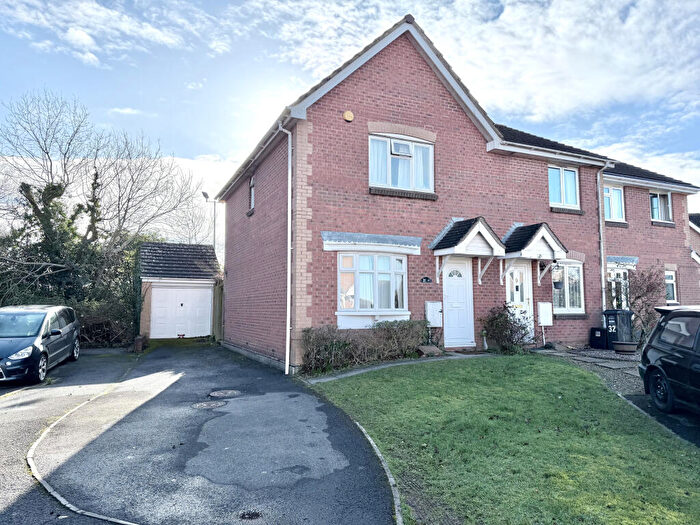
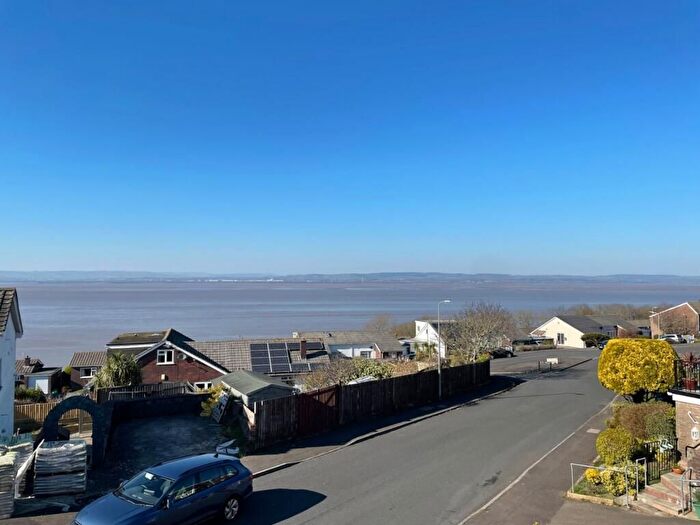
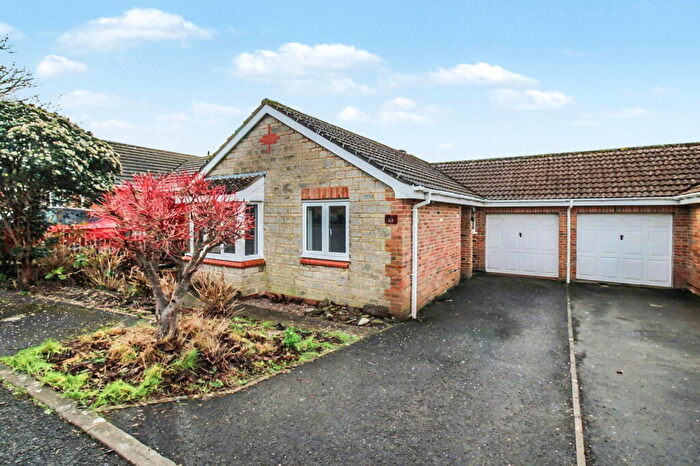
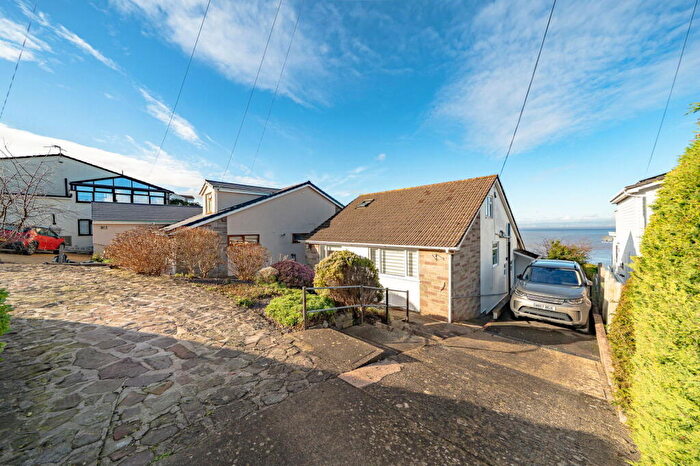
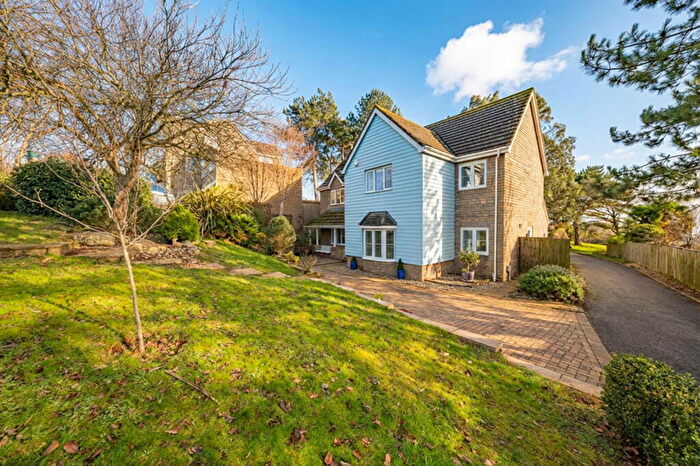
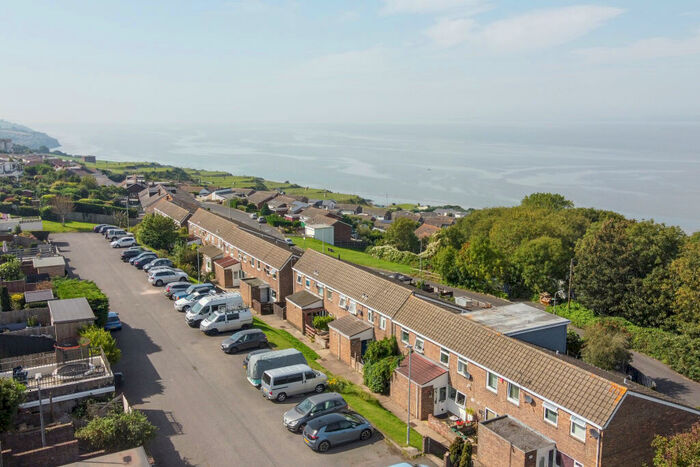
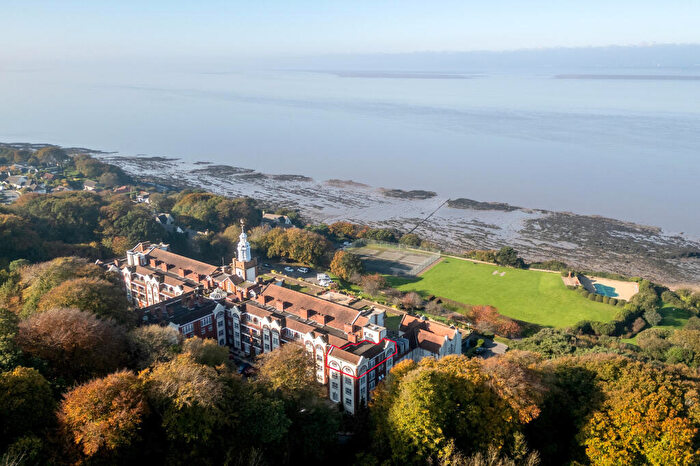
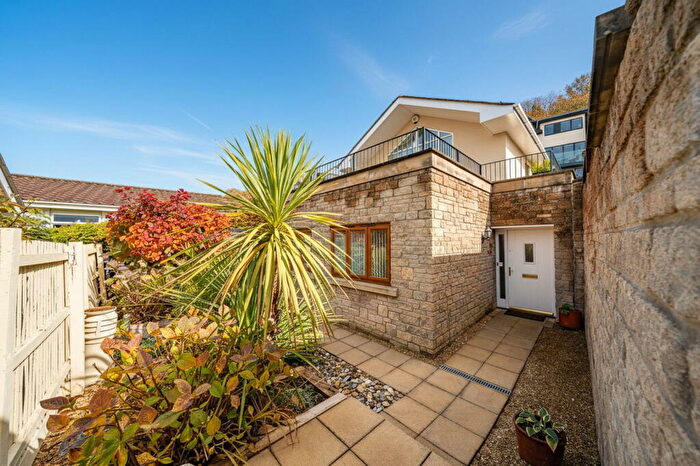
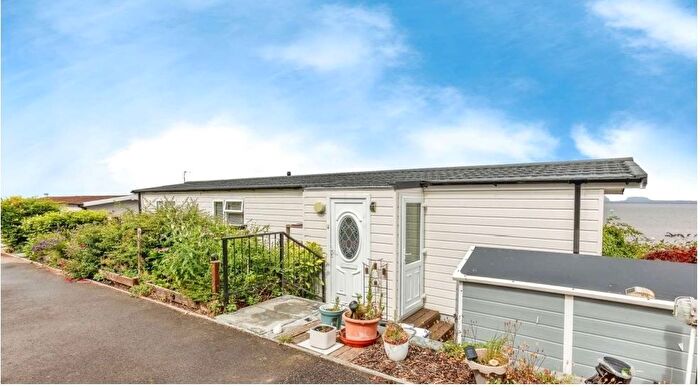
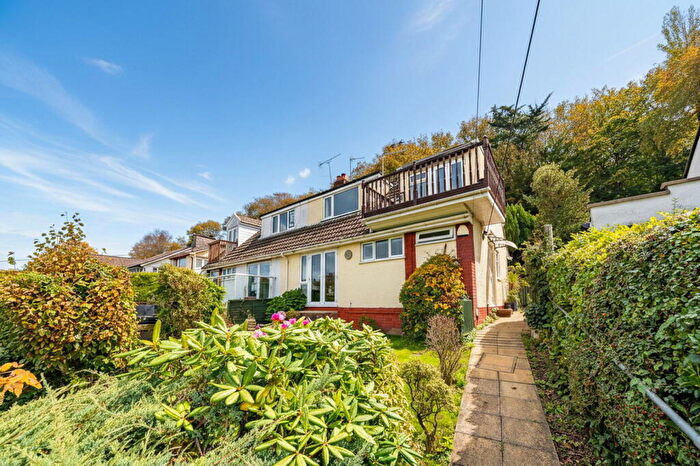
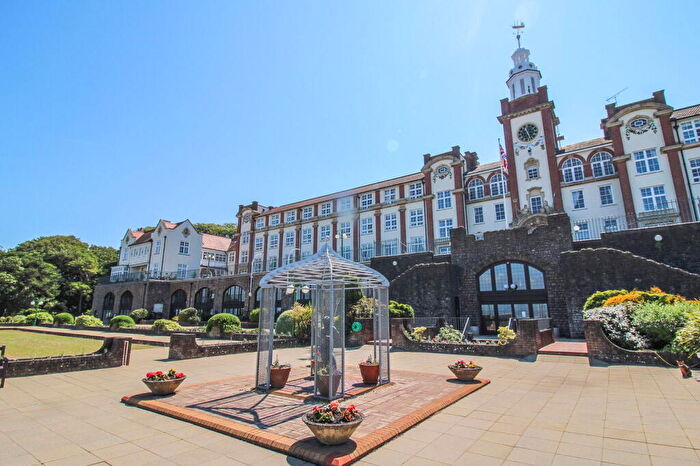
Houses for sale & to rent in Portishead Redcliffe Bay, Bristol
House Prices in Portishead Redcliffe Bay
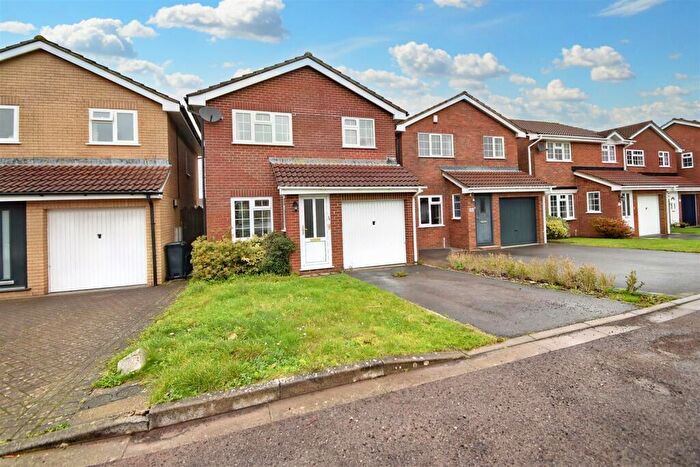
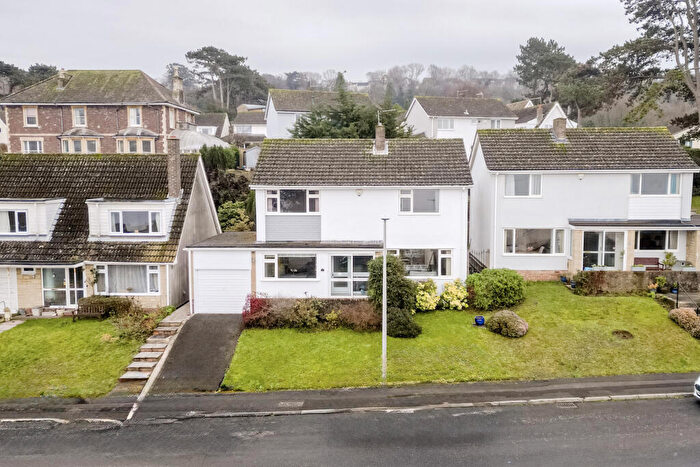
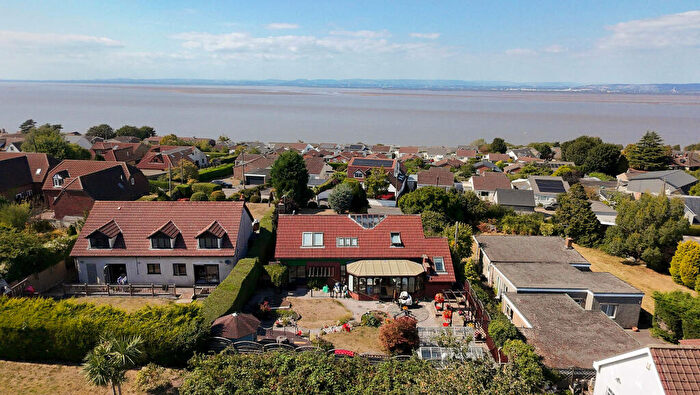
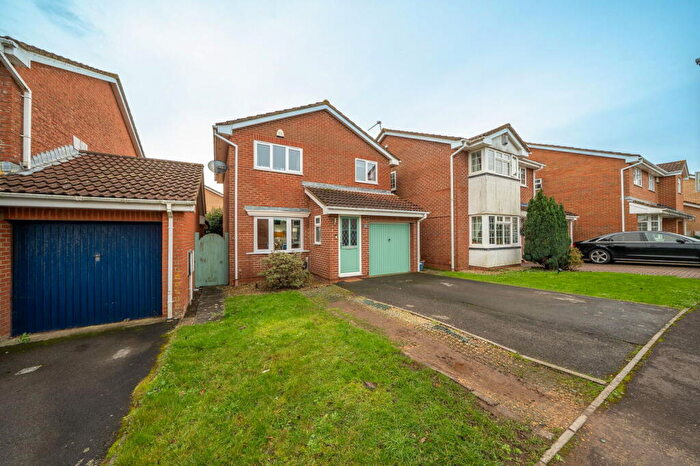
Properties in Portishead Redcliffe Bay have an average house price of £540,511.00 and had 145 Property Transactions within the last 3 years¹.
Portishead Redcliffe Bay is an area in Bristol, North Somerset with 1,384 households², where the most expensive property was sold for £1,400,000.00.
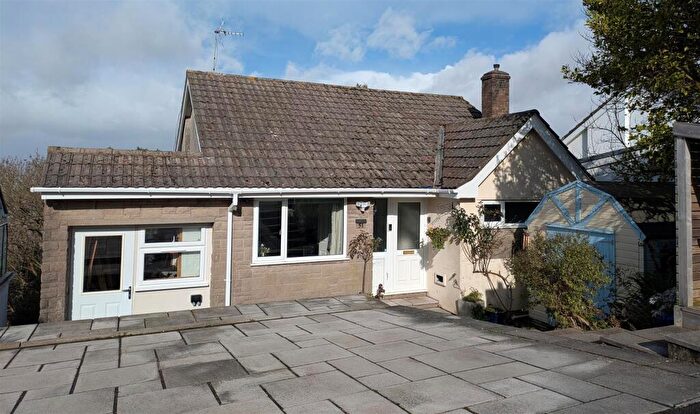
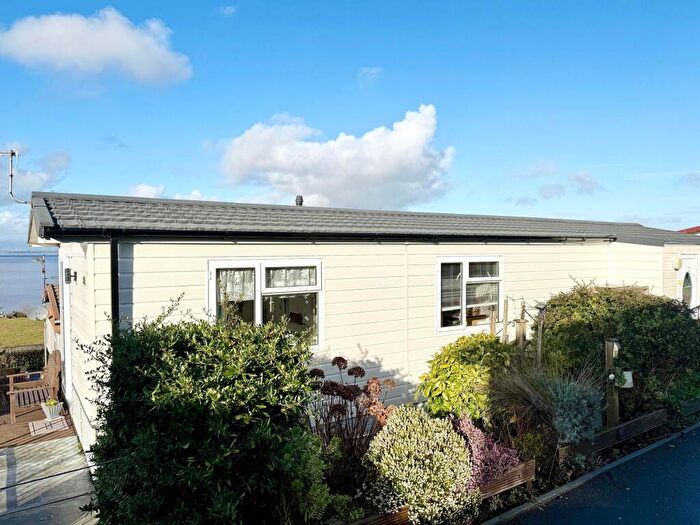
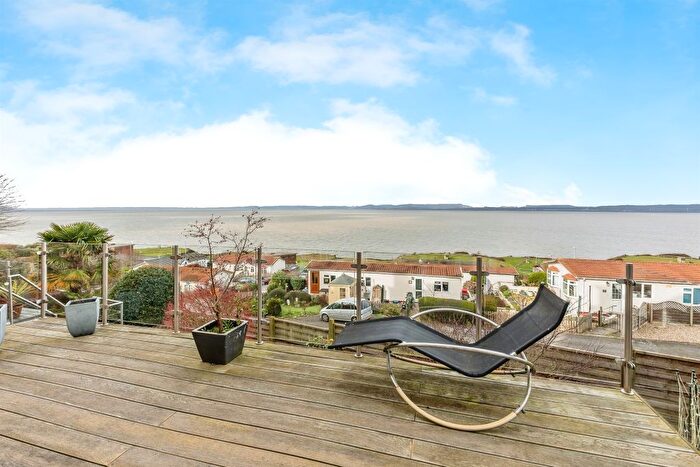
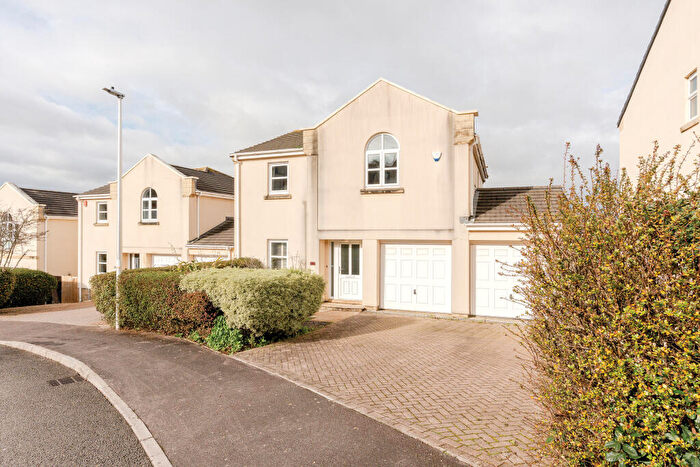
Properties for sale in Portishead Redcliffe Bay
Roads and Postcodes in Portishead Redcliffe Bay
Navigate through our locations to find the location of your next house in Portishead Redcliffe Bay, Bristol for sale or to rent.
| Streets | Postcodes |
|---|---|
| Badger Rise | BS20 8AX BS20 8LU BS20 8NN |
| Branscombe Walk | BS20 8LP |
| Brock End | BS20 8AS BS20 8LS |
| Cedarhurst Road | BS20 8HG |
| Charlcombe Rise | BS20 8NB BS20 8ND |
| Chesle Close | BS20 8JE |
| Chesle Way | BS20 8JB |
| Cheslefield | BS20 8JA |
| Crest Heights | BS20 8FE |
| Down Road | BS20 8DF BS20 8DG BS20 8HU BS20 8HY BS20 8HZ BS20 8JT |
| Gaunts Close | BS20 8BL |
| Halliwell Road | BS20 8JP |
| Harmony Drive | BS20 8DH |
| Highfield Drive | BS20 8JD BS20 8JG |
| Hillcrest Road | BS20 8HN BS20 8HP BS20 8HS |
| Hillgay Close | BS20 8HX |
| Hillside Road | BS20 8EU BS20 8EW BS20 8JR BS20 8JW BS20 8LF BS20 8LG BS20 8LJ BS20 8LQ |
| Homestead | BS20 8JF |
| Kings Road | BS20 8HH |
| Kingsway | BS20 8HW |
| Lindsey Close | BS20 8RR |
| Little Halt | BS20 8JQ |
| Newhaven Place | BS20 8EG |
| Newhaven Road | BS20 8LH |
| Nightingale Rise | BS20 8LN BS20 8LX |
| Nore Road | BS20 8EN BS20 8EX BS20 8EY BS20 8EZ BS20 8HA |
| Northfield Road | BS20 8LE |
| Pembroke Road | BS20 8HE BS20 8HF |
| Queens Road | BS20 8HT |
| Queensway | BS20 8HR |
| Ranchway | BS20 8DQ |
| Redcliffe Bay | BS20 8JL |
| Redcliffe Close | BS20 8HB |
| Sage Close | BS20 8ET |
| Seaview Road | BS20 8HJ BS20 8HL |
| St Augustines Close | BS20 8JH |
| Valley Road | BS20 8JU BS20 8JZ BS20 8QY |
| Waterside Park | BS20 8LL |
| Woodside Gardens | BS20 8EQ |
Transport near Portishead Redcliffe Bay
-
Nailsea and Backwell Station
-
Avonmouth Station
-
St.Andrew's Road Station
-
Shirehampton Station
-
Yatton Station
-
Sea Mills Station
-
Severn Tunnel Junction Station
-
Caldicot Station
-
Clifton Down Station
-
Severn Beach Station
- FAQ
- Price Paid By Year
- Property Type Price
Frequently asked questions about Portishead Redcliffe Bay
What is the average price for a property for sale in Portishead Redcliffe Bay?
The average price for a property for sale in Portishead Redcliffe Bay is £540,511. This amount is 18% higher than the average price in Bristol. There are 352 property listings for sale in Portishead Redcliffe Bay.
What streets have the most expensive properties for sale in Portishead Redcliffe Bay?
The streets with the most expensive properties for sale in Portishead Redcliffe Bay are Ranchway at an average of £900,000, Hillgay Close at an average of £835,000 and Charlcombe Rise at an average of £762,812.
What streets have the most affordable properties for sale in Portishead Redcliffe Bay?
The streets with the most affordable properties for sale in Portishead Redcliffe Bay are Newhaven Place at an average of £205,000, Gaunts Close at an average of £253,500 and Lindsey Close at an average of £313,750.
Which train stations are available in or near Portishead Redcliffe Bay?
Some of the train stations available in or near Portishead Redcliffe Bay are Nailsea and Backwell, Avonmouth and St.Andrew's Road.
Property Price Paid in Portishead Redcliffe Bay by Year
The average sold property price by year was:
| Year | Average Sold Price | Price Change |
Sold Properties
|
|---|---|---|---|
| 2025 | £499,929 | -12% |
47 Properties |
| 2024 | £560,047 | - |
53 Properties |
| 2023 | £559,888 | -0,1% |
45 Properties |
| 2022 | £560,308 | 10% |
76 Properties |
| 2021 | £503,359 | 12% |
90 Properties |
| 2020 | £444,030 | 3% |
64 Properties |
| 2019 | £430,767 | 1% |
62 Properties |
| 2018 | £424,524 | -3% |
55 Properties |
| 2017 | £436,800 | 9% |
57 Properties |
| 2016 | £396,853 | 13% |
87 Properties |
| 2015 | £346,052 | 6% |
72 Properties |
| 2014 | £323,938 | 10% |
89 Properties |
| 2013 | £290,899 | 3% |
69 Properties |
| 2012 | £282,248 | 3% |
54 Properties |
| 2011 | £274,025 | 6% |
47 Properties |
| 2010 | £256,888 | 3% |
59 Properties |
| 2009 | £248,081 | -20% |
62 Properties |
| 2008 | £298,640 | 2% |
29 Properties |
| 2007 | £292,688 | -3% |
60 Properties |
| 2006 | £300,549 | -3% |
103 Properties |
| 2005 | £308,199 | 15% |
93 Properties |
| 2004 | £263,135 | 20% |
107 Properties |
| 2003 | £211,667 | 15% |
83 Properties |
| 2002 | £179,152 | 26% |
87 Properties |
| 2001 | £132,019 | 6% |
96 Properties |
| 2000 | £124,229 | 0,3% |
73 Properties |
| 1999 | £123,884 | 19% |
85 Properties |
| 1998 | £99,958 | 6% |
75 Properties |
| 1997 | £94,394 | 11% |
91 Properties |
| 1996 | £83,655 | -5% |
123 Properties |
| 1995 | £87,866 | - |
122 Properties |
Property Price per Property Type in Portishead Redcliffe Bay
Here you can find historic sold price data in order to help with your property search.
The average Property Paid Price for specific property types in the last three years are:
| Property Type | Average Sold Price | Sold Properties |
|---|---|---|
| Semi Detached House | £430,255.00 | 33 Semi Detached Houses |
| Detached House | £615,674.00 | 96 Detached Houses |
| Terraced House | £343,153.00 | 13 Terraced Houses |
| Flat | £203,333.00 | 3 Flats |

