Houses for sale & to rent in Cropton, Pickering
House Prices in Cropton
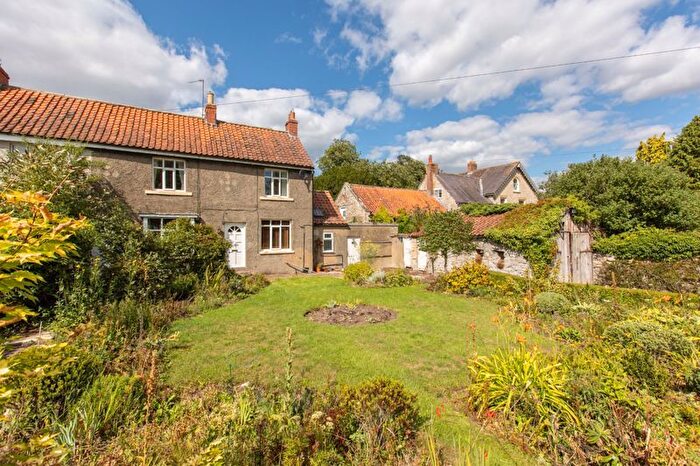
Properties in Cropton have an average house price of £381,016.00 and had 43 Property Transactions within the last 3 years¹.
Cropton is an area in Pickering, North Yorkshire with 511 households², where the most expensive property was sold for £715,000.00.
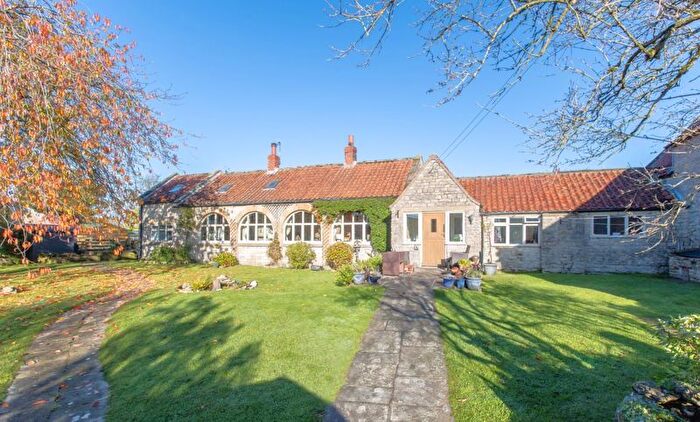
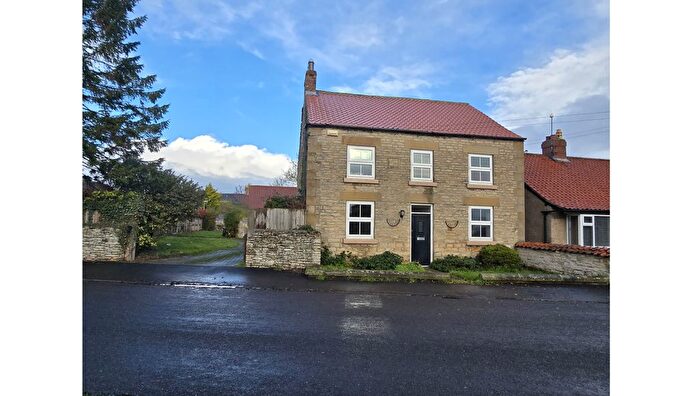
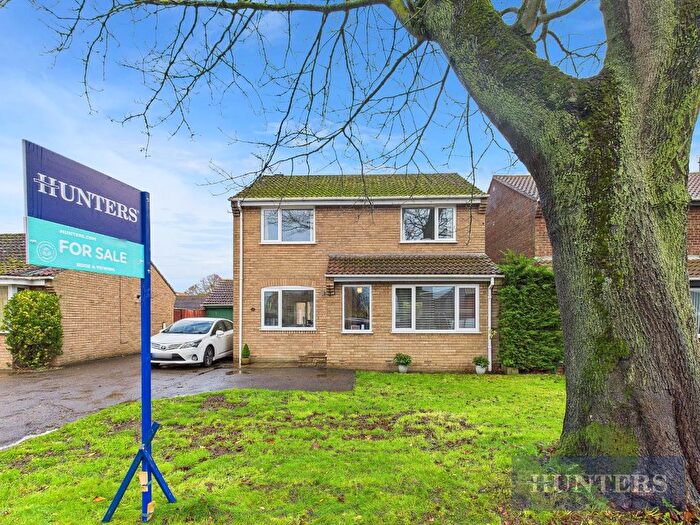
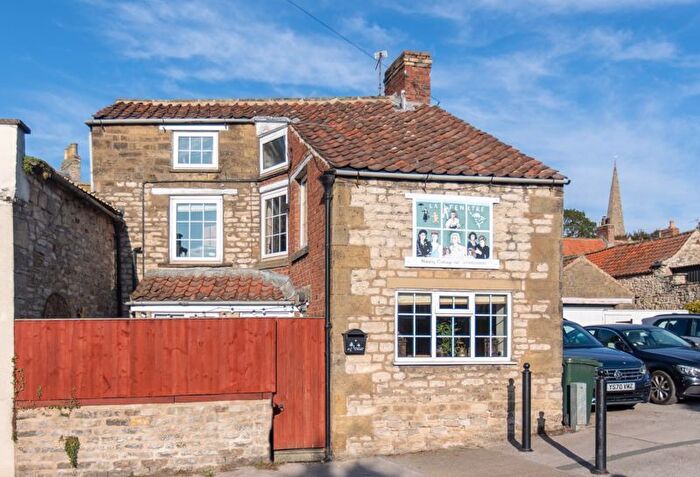
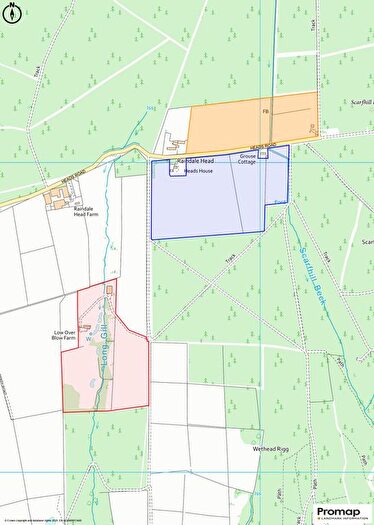
Properties for sale in Cropton
Previously listed properties in Cropton
Roads and Postcodes in Cropton
Navigate through our locations to find the location of your next house in Cropton, Pickering for sale or to rent.
| Streets | Postcodes |
|---|---|
| Back Lane South | YO18 8NU YO18 8PD |
| Carr Lane | YO18 8PU |
| Cawthorne Lane | YO18 8PQ |
| Church Street | YO18 8QB |
| Cliff Lane | YO18 8LS |
| Coppice Lane | YO18 8HD |
| Costa Lane | YO18 8LP |
| Cropton Lane | YO18 8HG YO18 8HB YO18 8HQ |
| East Brow Road | YO18 8JT |
| Forestry Bungalows | YO18 8EU |
| Gallow Heads Lane | YO18 8LT |
| Headlands Lane | YO18 8JR |
| Heads Road | YO18 8HX |
| High Back Side | YO18 8FB |
| Holly Close | YO18 8PL |
| Marton Lane | YO18 8LW |
| New Lane | YO18 8PT |
| Newton Dale | YO18 8HU YO18 8QN |
| Toftly View | YO18 8QD |
| West View | YO18 8NT |
| West View Lane | YO18 8NY |
| Wrelton Cliff Road | YO18 8PJ |
| Wrelton Court | YO18 8PX |
| Yatts Road | YO18 8JP |
| YO18 8ET YO18 8HE YO18 8HH YO18 8HJ YO18 8HL YO18 8HP YO18 8HR YO18 8HS YO18 8HT YO18 8HZ YO18 8JA YO18 8NX YO18 8PA YO18 8PB YO18 8PE YO18 8PF YO18 8PG YO18 8PN YO18 8QA YO18 8QE YO18 8QG YO18 8EH YO18 8EJ YO18 8EP YO18 8ES YO18 8EX YO18 8HF YO18 8HN YO18 8HW YO18 8HY YO18 8LR YO18 8LU YO18 8NS YO18 8PH YO18 8QF YO18 8QH YO18 8QJ |
Transport near Cropton
-
Malton Station
-
Egton Station
-
Glaisdale Station
-
Grosmont Station
-
Lealholm Station
-
Danby Station
-
Sleights Station
-
Castleton Moor Station
-
Ruswarp Station
- FAQ
- Price Paid By Year
- Property Type Price
Frequently asked questions about Cropton
What is the average price for a property for sale in Cropton?
The average price for a property for sale in Cropton is £381,016. This amount is 23% higher than the average price in Pickering. There are 354 property listings for sale in Cropton.
Which train stations are available in or near Cropton?
Some of the train stations available in or near Cropton are Malton, Egton and Glaisdale.
Property Price Paid in Cropton by Year
The average sold property price by year was:
| Year | Average Sold Price | Price Change |
Sold Properties
|
|---|---|---|---|
| 2025 | £399,663 | -3% |
16 Properties |
| 2024 | £413,181 | 18% |
11 Properties |
| 2023 | £340,254 | 3% |
16 Properties |
| 2022 | £329,548 | -21% |
13 Properties |
| 2021 | £398,437 | 33% |
25 Properties |
| 2020 | £266,518 | -10% |
22 Properties |
| 2019 | £294,176 | -4% |
17 Properties |
| 2018 | £306,000 | -20% |
12 Properties |
| 2017 | £367,080 | 19% |
15 Properties |
| 2016 | £298,045 | 4% |
21 Properties |
| 2015 | £286,266 | -4% |
15 Properties |
| 2014 | £297,696 | 22% |
15 Properties |
| 2013 | £231,678 | -24% |
19 Properties |
| 2012 | £287,933 | 5% |
15 Properties |
| 2011 | £274,334 | -14% |
22 Properties |
| 2010 | £313,628 | -4% |
22 Properties |
| 2009 | £324,850 | -14% |
10 Properties |
| 2008 | £371,722 | 19% |
9 Properties |
| 2007 | £300,132 | -4% |
21 Properties |
| 2006 | £311,307 | 24% |
13 Properties |
| 2005 | £237,466 | -5% |
15 Properties |
| 2004 | £250,202 | -1% |
18 Properties |
| 2003 | £253,852 | 24% |
17 Properties |
| 2002 | £191,987 | 32% |
26 Properties |
| 2001 | £131,113 | 11% |
12 Properties |
| 2000 | £116,350 | -20% |
28 Properties |
| 1999 | £139,672 | 28% |
26 Properties |
| 1998 | £100,850 | 8% |
24 Properties |
| 1997 | £92,390 | -12% |
23 Properties |
| 1996 | £103,335 | 24% |
30 Properties |
| 1995 | £78,485 | - |
25 Properties |
Property Price per Property Type in Cropton
Here you can find historic sold price data in order to help with your property search.
The average Property Paid Price for specific property types in the last three years are:
| Property Type | Average Sold Price | Sold Properties |
|---|---|---|
| Semi Detached House | £323,575.00 | 10 Semi Detached Houses |
| Detached House | £453,616.00 | 21 Detached Houses |
| Terraced House | £301,833.00 | 12 Terraced Houses |

