
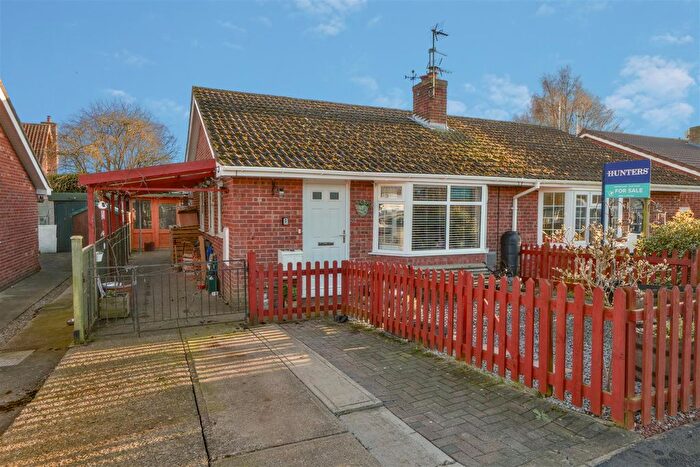
Houses for sale & to rent in YO61 1QP, Forge Lane, Tollerton, York
House Prices in YO61 1QP, Forge Lane, Tollerton
Properties in YO61 1QP have no sales history available within the last 3 years. YO61 1QP is a postcode in Forge Lane located in Tollerton, an area in York, North Yorkshire, with 7 households².
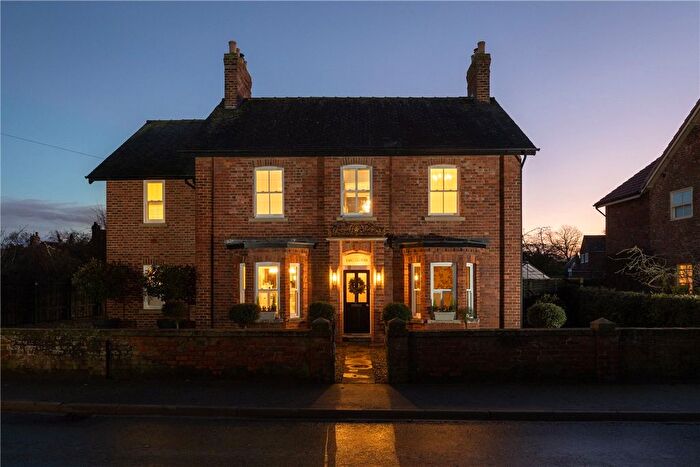
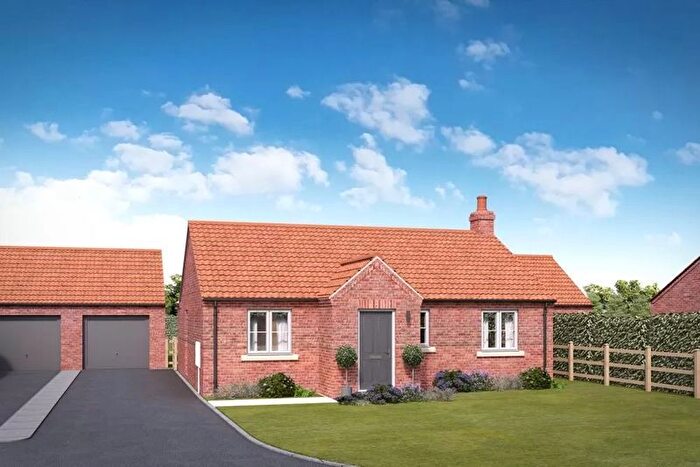
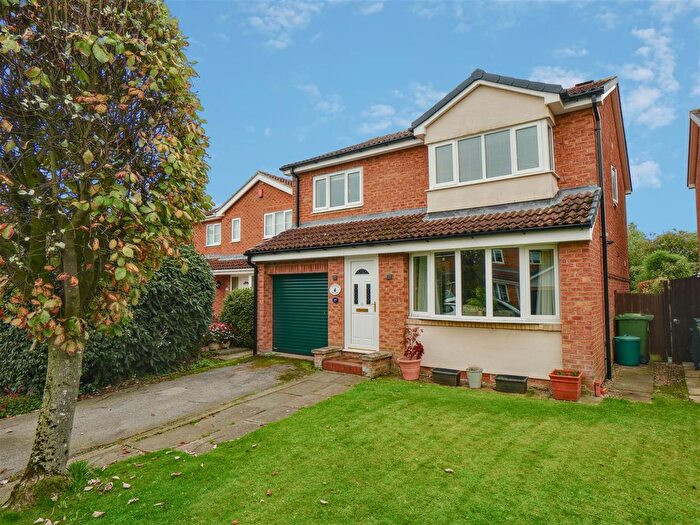
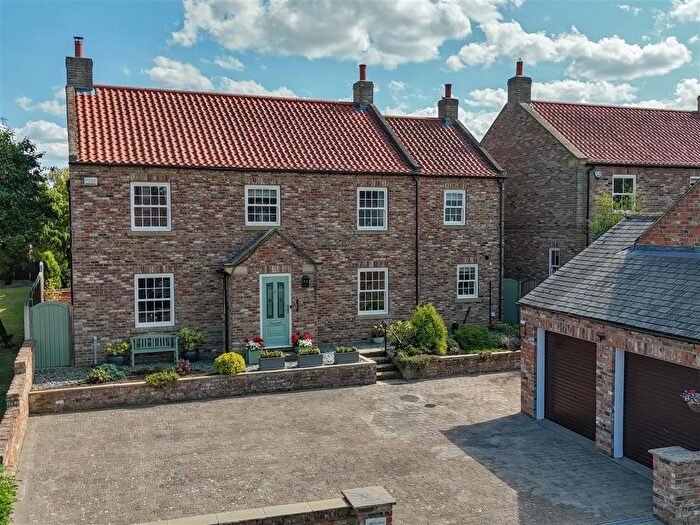
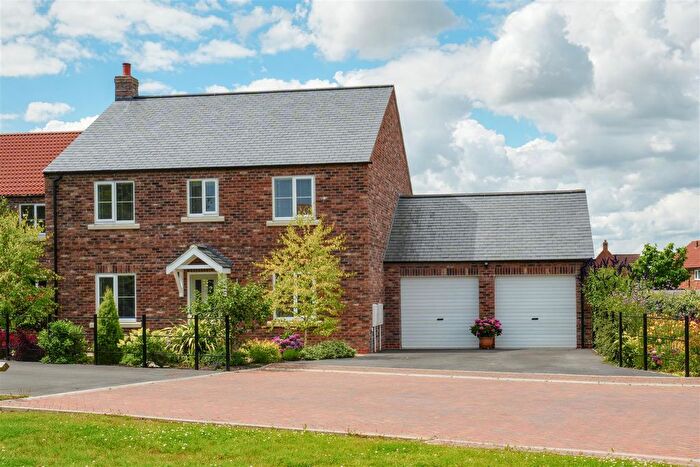
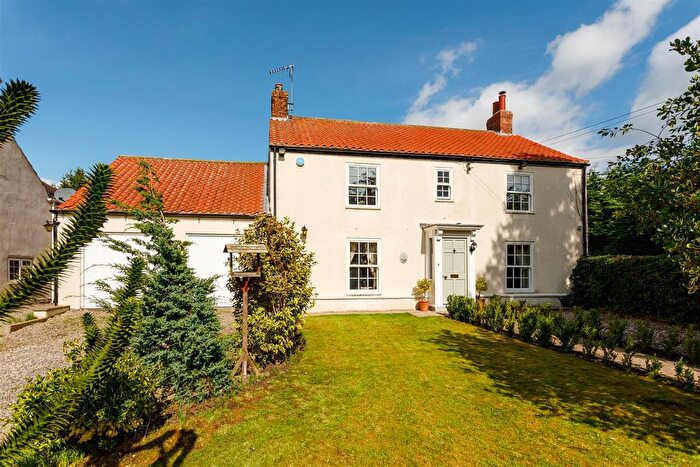
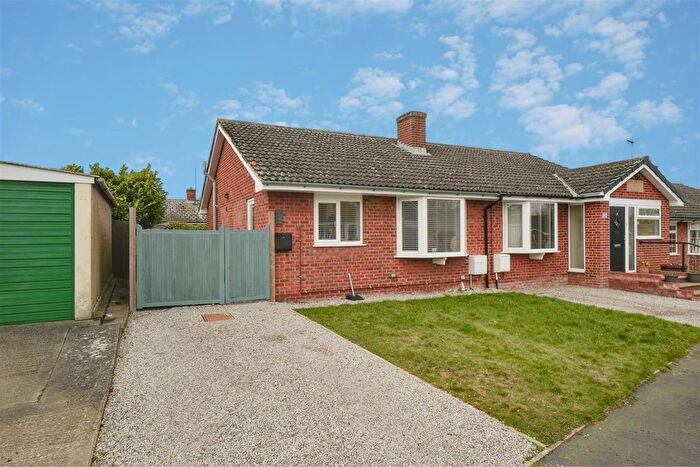
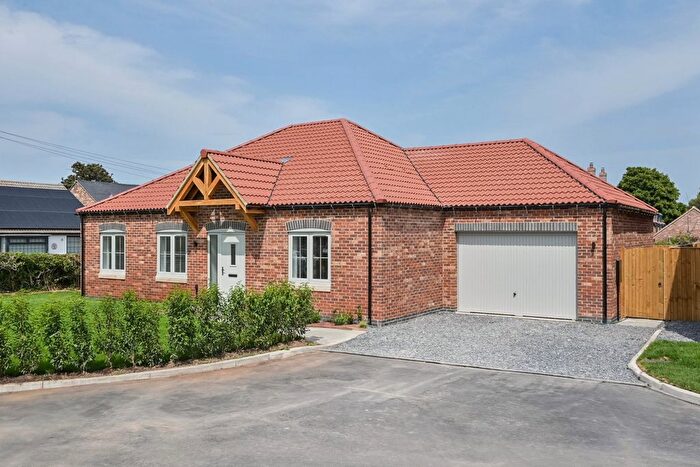
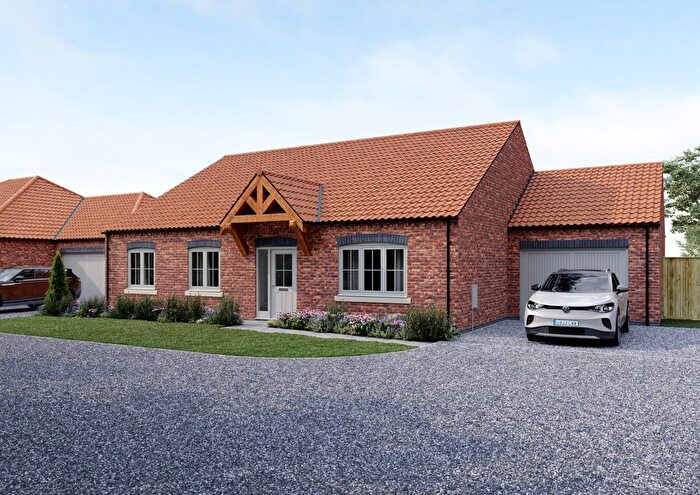
Properties for sale near YO61 1QP, Forge Lane
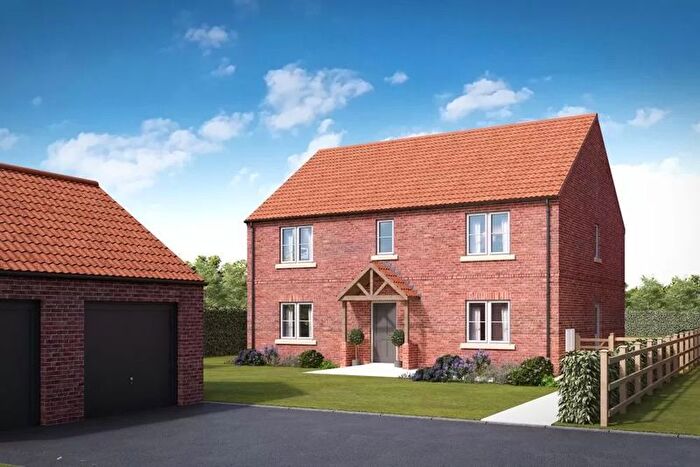
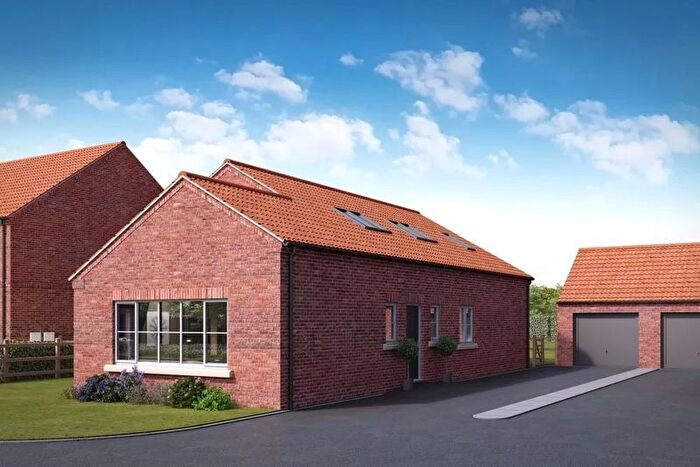
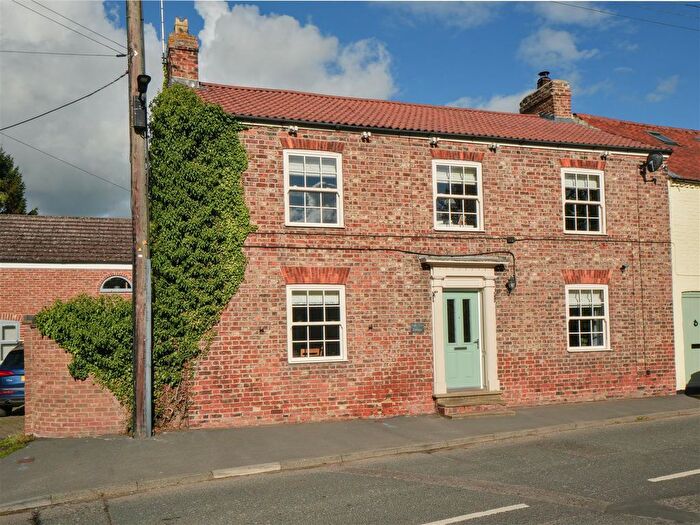
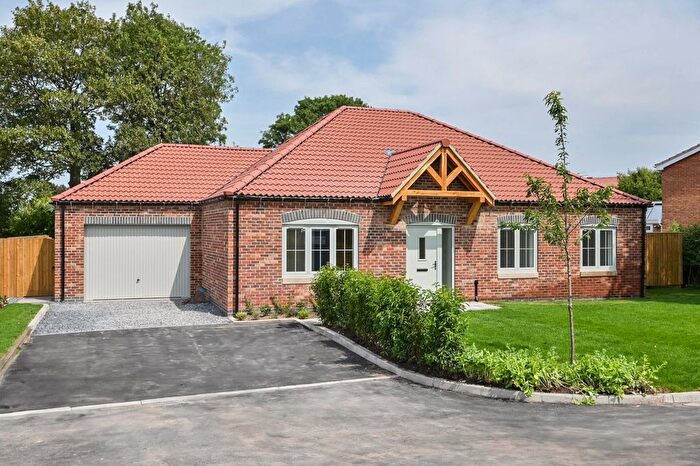
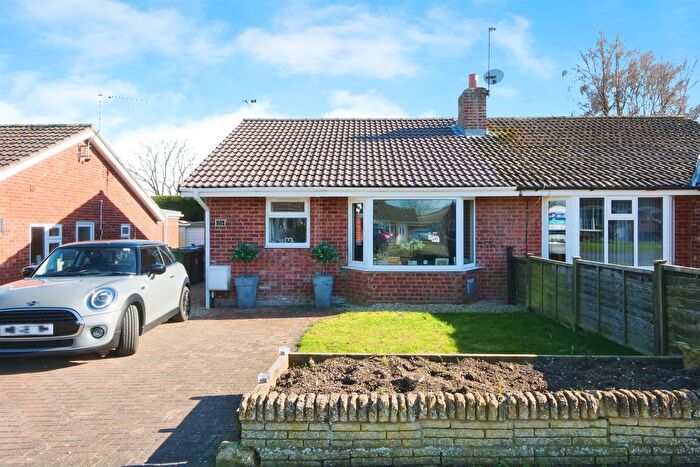
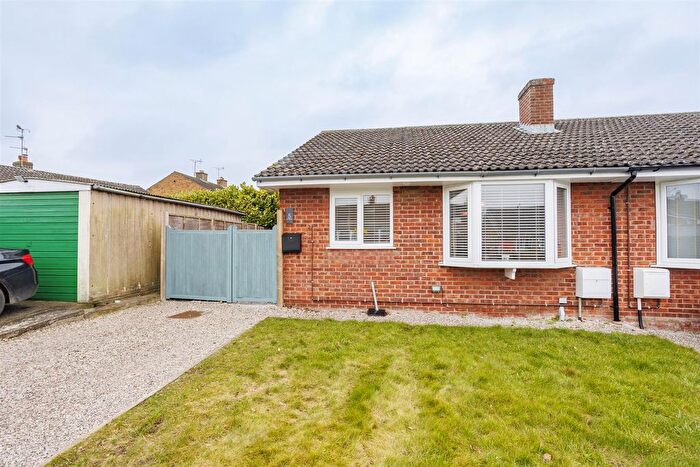
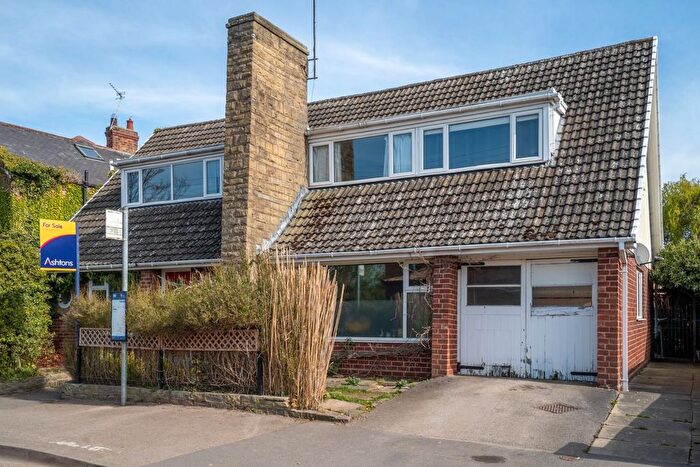
Previously listed properties near YO61 1QP, Forge Lane
![]()
If you are looking to sell your house, let it out, or receive a property valuation, an expert can help you.
Click the button below to get started.
Price Paid in Forge Lane, YO61 1QP, Tollerton
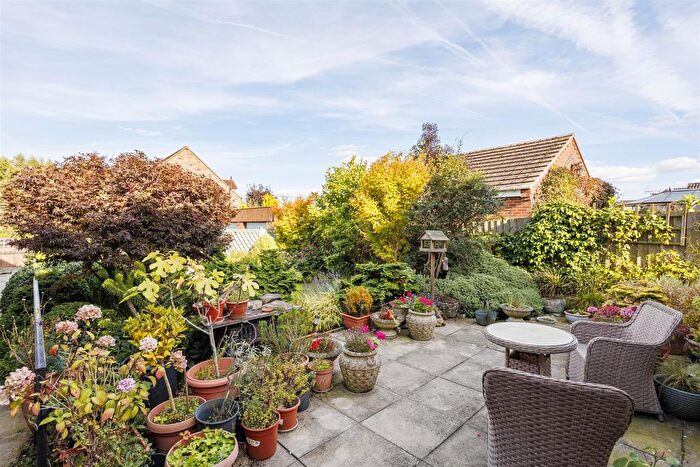
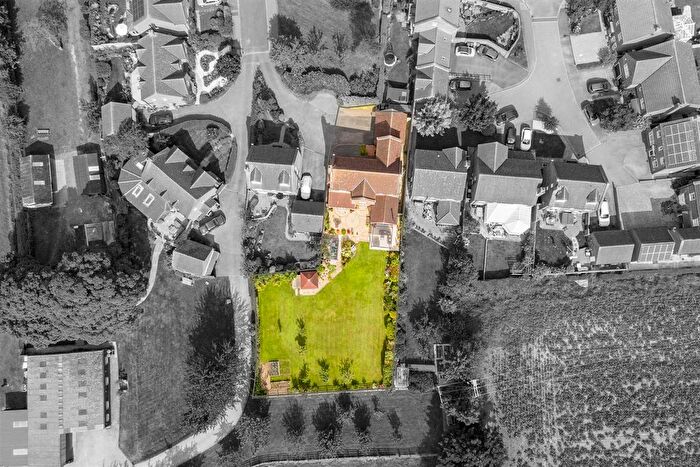
6 Forge Lane, YO61 1QP, Tollerton York
Property 6 has been sold 1 time. The last time it was sold was in 26/08/2021 and the sold price was £295,000.00.
This semi detached house, sold as a freehold on 26/08/2021, is a 109 sqm semi-detached house with an EPC rating of C.
| Date | Price | Property Type | Tenure | Classification |
|---|---|---|---|---|
| 26/08/2021 | £295,000.00 | Semi Detached House | freehold | Established Building |
2 Forge Lane, YO61 1QP, Tollerton York
Property 2 has been sold 2 times. The last time it was sold was in 28/11/2017 and the sold price was £248,000.00.
This semi detached house, sold as a freehold on 28/11/2017, is a 94 sqm semi-detached bungalow with an EPC rating of D.
| Date | Price | Property Type | Tenure | Classification |
|---|---|---|---|---|
| 28/11/2017 | £248,000.00 | Semi Detached House | freehold | Established Building |
| 01/12/2010 | £218,000.00 | Semi Detached House | freehold | Established Building |
5 Forge Lane, YO61 1QP, Tollerton York
Property 5 has been sold 1 time. The last time it was sold was in 06/06/2008 and the sold price was £245,000.00.
This is a Detached House which was sold as a freehold in 06/06/2008
| Date | Price | Property Type | Tenure | Classification |
|---|---|---|---|---|
| 06/06/2008 | £245,000.00 | Detached House | freehold | Established Building |
Transport near YO61 1QP, Forge Lane

House price paid reports for YO61 1QP, Forge Lane
Click on the buttons below to see price paid reports by year or property price:
- Price Paid By Year
Property Price Paid in YO61 1QP, Forge Lane by Year
The average sold property price by year was:
| Year | Average Sold Price | Price Change |
Sold Properties
|
|---|---|---|---|
| 2021 | £295,000 | 16% |
1 Property |
| 2017 | £248,000 | 12% |
1 Property |
| 2010 | £218,000 | -12% |
1 Property |
| 2008 | £245,000 | - |
1 Property |