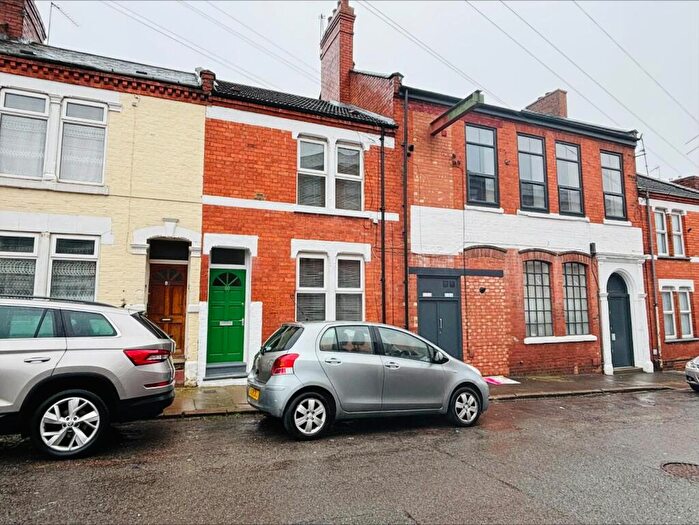
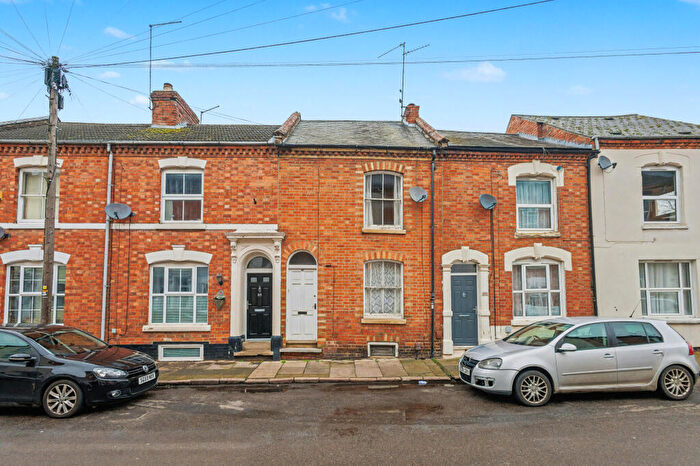
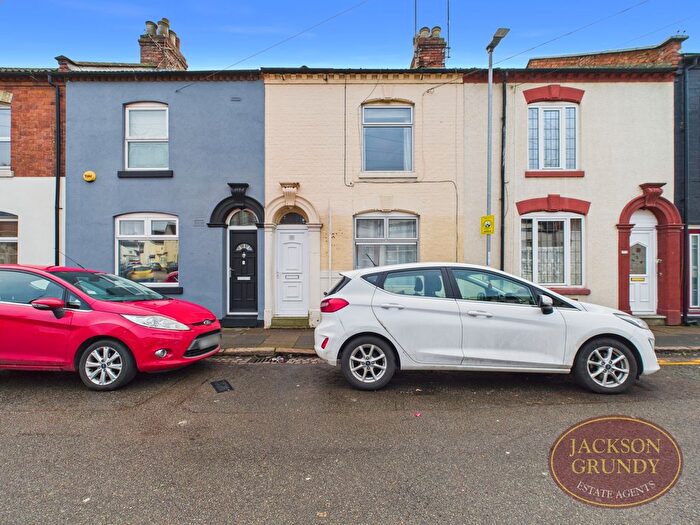
Houses for sale & to rent in Abington, Northampton
House Prices in Abington
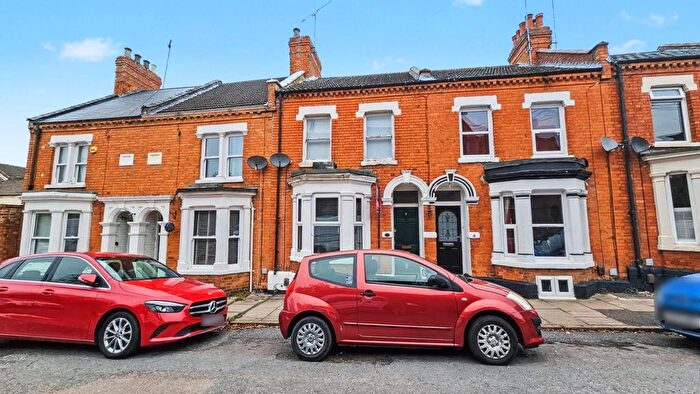
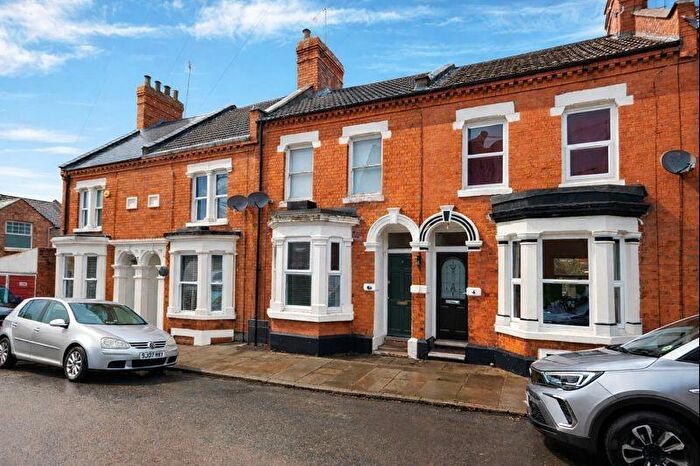
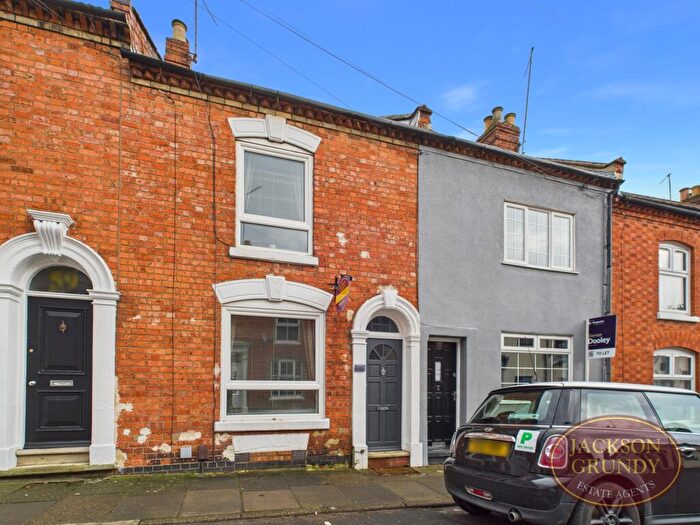
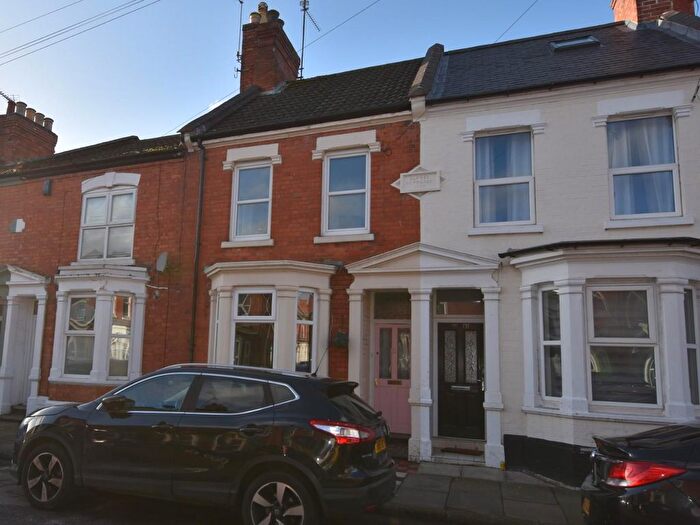
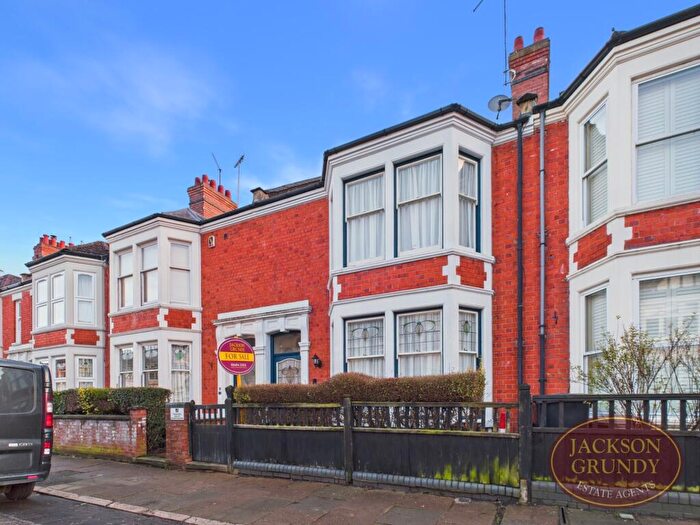
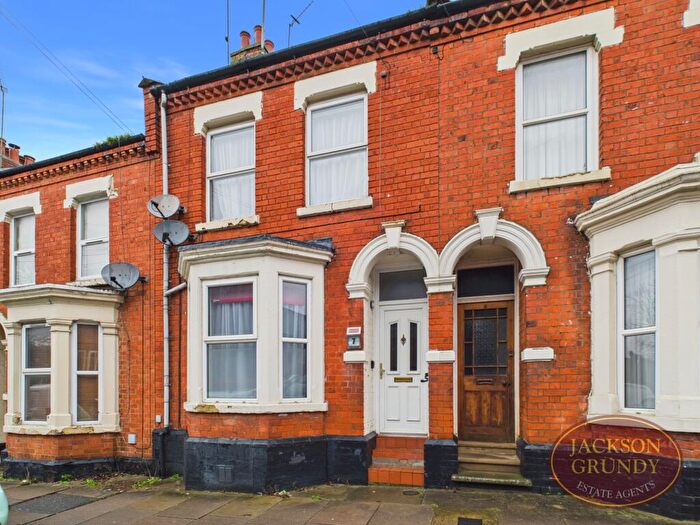
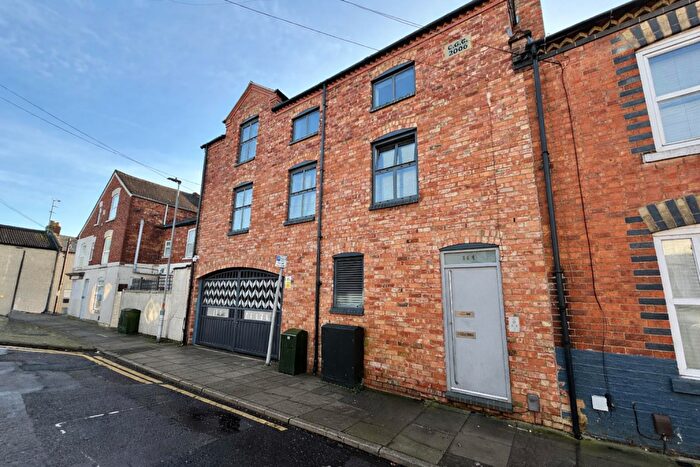
Properties in Abington have an average house price of £255,792.00 and had 466 Property Transactions within the last 3 years¹.
Abington is an area in Northampton, Northamptonshire with 4,219 households², where the most expensive property was sold for £875,000.00.
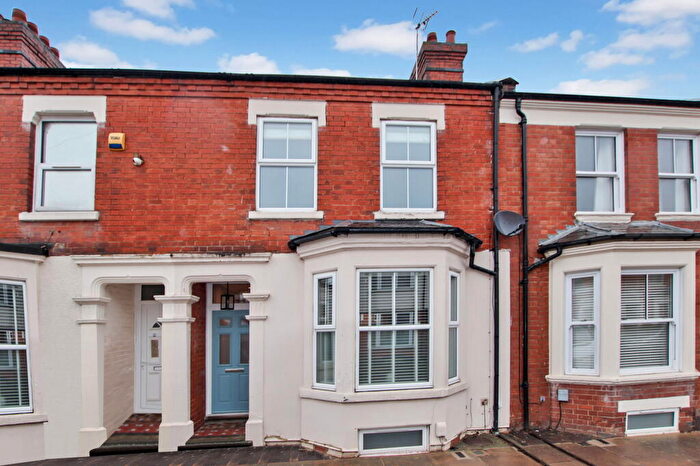
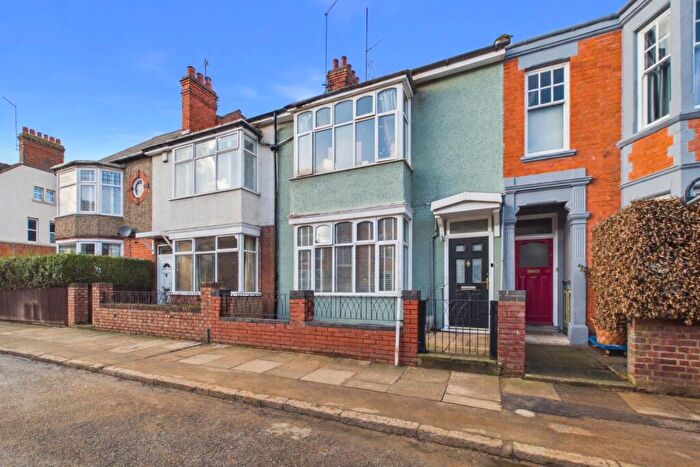
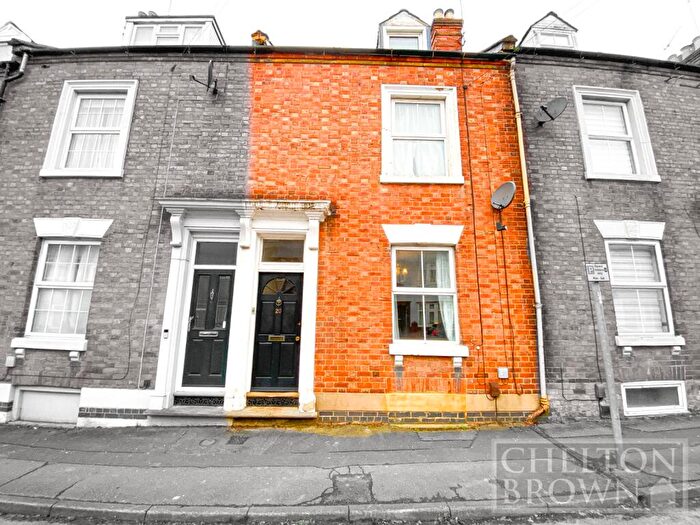
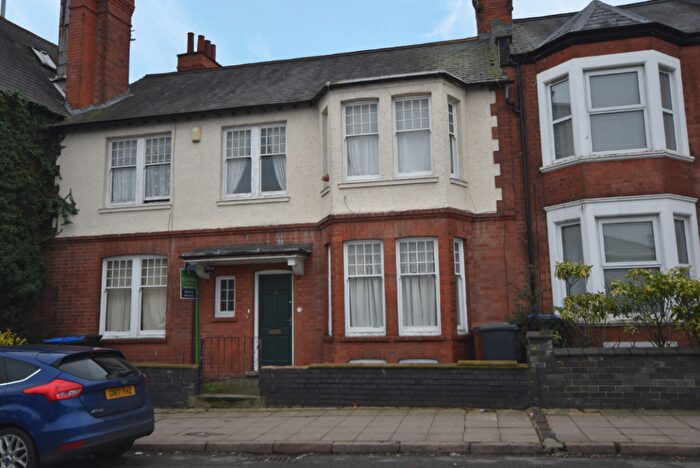
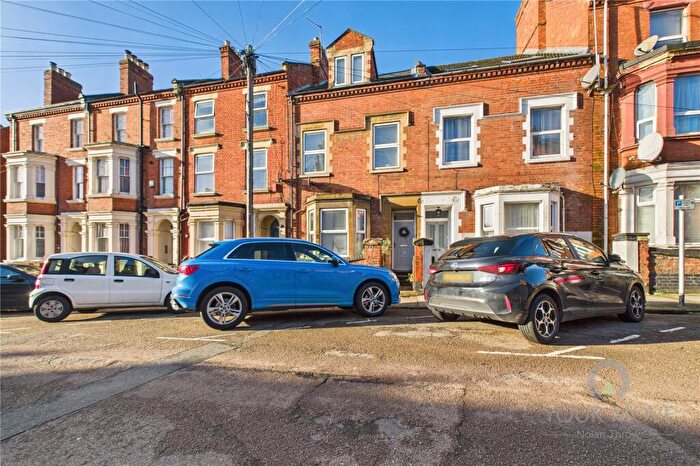
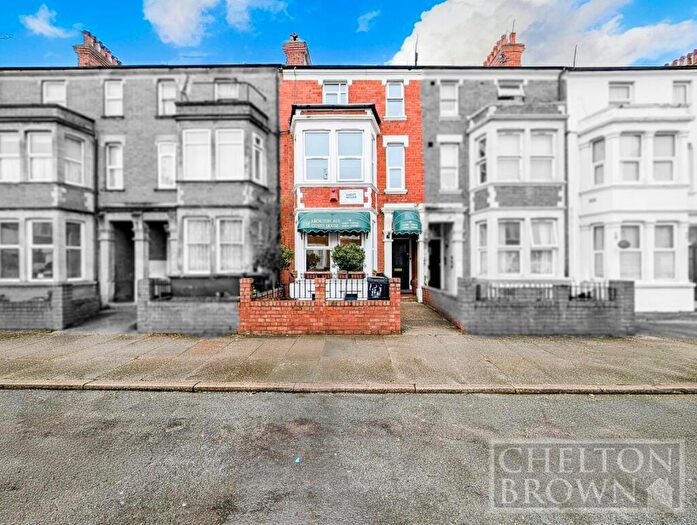
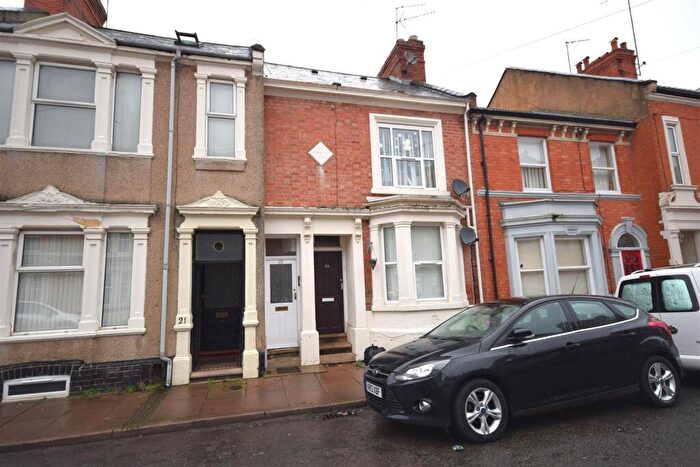
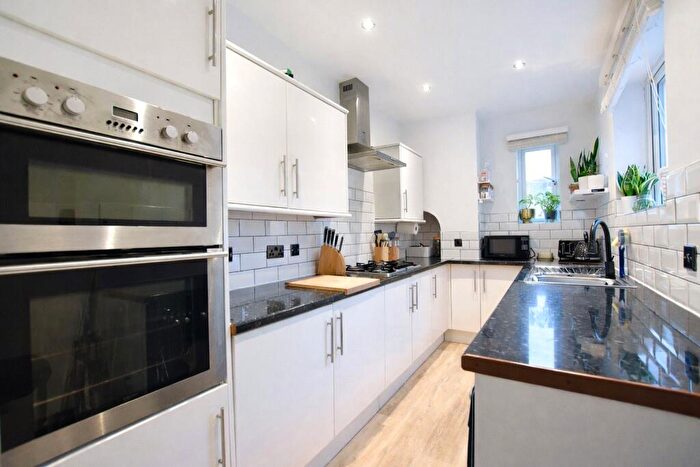
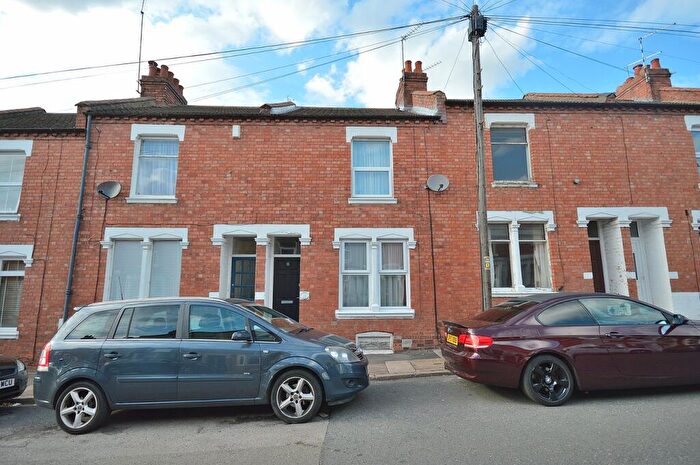
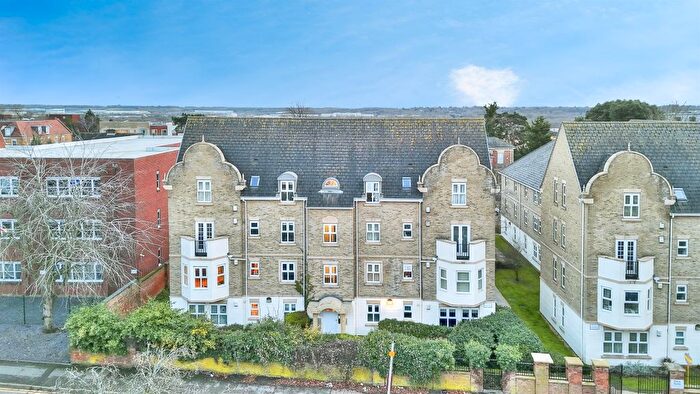
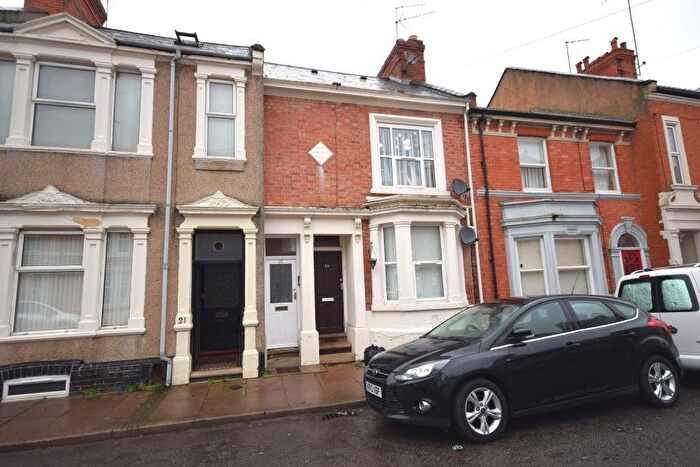
Properties for sale in Abington
Roads and Postcodes in Abington
Navigate through our locations to find the location of your next house in Abington, Northampton for sale or to rent.
| Streets | Postcodes |
|---|---|
| Abington Avenue | NN1 4NY NN1 4PA NN1 4PB NN1 4PD NN1 4PR NN1 4PU NN1 4PX NN1 4QA NN1 4QB NN1 4QD |
| Abington Cottages | NN1 4PT |
| Abington Grove | NN1 4QW NN1 4QX |
| Abington Park | NN1 5LW |
| Adams Avenue | NN1 4LJ NN1 4LQ |
| Adnitt Road | NN1 4LF NN1 4LL NN1 4NF NN1 4NG NN1 4NH NN1 4NJ NN1 4NL NN1 4NQ |
| Albany Road | NN1 5LZ |
| Allen Road | NN1 4NB NN1 4NE |
| Ardington Road | NN1 5LJ NN1 5LP NN1 5LS NN1 5LT NN1 5NE |
| Baronson Gardens | NN1 4NU NN1 4NZ |
| Barry Road | NN1 5JS |
| Billing Road | NN1 5DA NN1 5DB NN1 5DE NN1 5RR NN1 5RS NN1 5HU |
| Billington Street | NN1 4LH |
| Bostock Avenue | NN1 4LN NN1 4LW |
| Bostock Mews | NN1 4LD |
| Bouverie Walk | NN1 5SN NN1 5SP |
| Christchurch Road | NN1 5LL NN1 5LN |
| Clarke Road | NN1 4PL NN1 4PW |
| Collins Street | NN1 4TG |
| Covington Street | NN1 5JU |
| Daniel Terrace | NN1 4PN |
| Derby Mews | NN1 4JR |
| Derby Road | NN1 4JP NN1 4JS NN1 4JU |
| East Street | NN1 5JZ |
| Elizabeth Street | NN1 5HD |
| Elizabeth Walk | NN1 5SR NN1 5SS |
| Florence Road | NN1 4NA |
| Garrick Road | NN1 5ND |
| Holly Road | NN1 4QL NN1 4QN NN1 4QP NN1 4QR |
| Ivy Road | NN1 4QS NN1 4QT |
| Kettering Road | NN1 4BN |
| King Edward Road | NN1 5LR NN1 5LU NN1 5LY NN1 5LF |
| Lea Road | NN1 4PE NN1 4PF NN1 4PP |
| Lower Thrift Street | NN1 5HP |
| Loyd Road | NN1 5JA NN1 5JB NN1 5JE |
| Lutterworth Road | NN1 5JL NN1 5JN NN1 5JP NN1 5JR NN1 5JW |
| Manfield Road | NN1 4NN NN1 4NW |
| Melbourne Walk | NN1 5SJ NN1 5SL |
| Monks Hall Road | NN1 4LZ |
| Monks Park Road | NN1 4LU NN1 4LX NN1 4LY |
| Park Avenue | NN3 2BX |
| Park Avenue South | NN3 3AA NN3 3AB |
| Percy Road | NN1 4LS |
| Perry Street | NN1 4HL NN1 4HW NN1 4HN |
| Purser Road | NN1 4PG NN1 4PQ |
| Roe Road | NN1 4NS NN1 4PH NN1 4PJ |
| Roseholme Road | NN1 4RR NN1 4TQ NN1 4RS |
| Sandringham Close | NN1 5LX |
| Sandringham Road | NN1 5NA |
| Sheriff Road | NN1 4LT |
| South Street | NN1 5HS |
| South Terrace | NN1 5JY |
| St Edmunds Street | NN1 5SH |
| Stimpson Avenue | NN1 4JN NN1 4JW NN1 4LP NN1 4LR NN1 4ND NN1 4NP |
| Stockley Street | NN1 5EY |
| Thursby Road | NN1 5NB |
| Turner Street | NN1 4JJ NN1 4JL |
| Upper Thrift Street | NN1 5HR |
| Vernon Terrace | NN1 5HE |
| Vernon Walk | NN1 5ST NN1 5SU |
| Wantage Road | NN1 4TH NN1 4TL NN1 4TJ |
| Wellingborough Road | NN1 4DT NN1 4EB NN1 4ED NN1 4EE NN1 4EH NN1 4EJ NN1 4EP NN1 4EQ NN1 4ER NN1 4EW NN1 4EY NN1 4EZ NN1 4AT NN1 4DU NN1 4DZ NN1 4EF NN1 4EN NN1 4ES NN1 4ET NN1 4EU NN1 4EX |
| West Street | NN1 4DW |
| West Street Walk | NN1 5BS |
| Westleigh Close | NN1 4JX |
| Whitworth Road | NN1 4HJ |
| Wilby Street | NN1 5JX |
| Wycliffe Road | NN1 5JF NN1 5JH NN1 5JJ NN1 5JQ |
Transport near Abington
- FAQ
- Price Paid By Year
- Property Type Price
Frequently asked questions about Abington
What is the average price for a property for sale in Abington?
The average price for a property for sale in Abington is £255,792. This amount is 11% lower than the average price in Northampton. There are 1,963 property listings for sale in Abington.
What streets have the most expensive properties for sale in Abington?
The streets with the most expensive properties for sale in Abington are Park Avenue South at an average of £678,062, Christchurch Road at an average of £571,333 and Abington Grove at an average of £460,000.
What streets have the most affordable properties for sale in Abington?
The streets with the most affordable properties for sale in Abington are Roseholme Road at an average of £119,166, Baronson Gardens at an average of £132,863 and Billington Street at an average of £133,500.
Which train stations are available in or near Abington?
Some of the train stations available in or near Abington are Northampton, Wellingborough and Long Buckby.
Property Price Paid in Abington by Year
The average sold property price by year was:
| Year | Average Sold Price | Price Change |
Sold Properties
|
|---|---|---|---|
| 2025 | £248,826 | -3% |
138 Properties |
| 2024 | £257,230 | -1% |
162 Properties |
| 2023 | £260,180 | 3% |
166 Properties |
| 2022 | £253,527 | 9% |
232 Properties |
| 2021 | £230,284 | 7% |
253 Properties |
| 2020 | £214,092 | -1% |
167 Properties |
| 2019 | £216,504 | 3% |
199 Properties |
| 2018 | £210,395 | -1% |
215 Properties |
| 2017 | £212,728 | 15% |
227 Properties |
| 2016 | £180,445 | 1% |
210 Properties |
| 2015 | £178,453 | 1% |
254 Properties |
| 2014 | £177,133 | 15% |
223 Properties |
| 2013 | £149,698 | 7% |
171 Properties |
| 2012 | £139,703 | -5% |
136 Properties |
| 2011 | £146,192 | 1% |
127 Properties |
| 2010 | £145,016 | -3% |
152 Properties |
| 2009 | £149,750 | -1% |
157 Properties |
| 2008 | £151,143 | -10% |
176 Properties |
| 2007 | £166,393 | 4% |
353 Properties |
| 2006 | £159,075 | 7% |
349 Properties |
| 2005 | £148,632 | 8% |
315 Properties |
| 2004 | £136,541 | 3% |
327 Properties |
| 2003 | £132,513 | 16% |
327 Properties |
| 2002 | £111,170 | 20% |
394 Properties |
| 2001 | £88,769 | 9% |
348 Properties |
| 2000 | £80,460 | 18% |
334 Properties |
| 1999 | £66,359 | 12% |
349 Properties |
| 1998 | £58,382 | 9% |
373 Properties |
| 1997 | £53,346 | 15% |
381 Properties |
| 1996 | £45,223 | 4% |
302 Properties |
| 1995 | £43,586 | - |
220 Properties |
Property Price per Property Type in Abington
Here you can find historic sold price data in order to help with your property search.
The average Property Paid Price for specific property types in the last three years are:
| Property Type | Average Sold Price | Sold Properties |
|---|---|---|
| Flat | £132,481.00 | 53 Flats |
| Semi Detached House | £392,163.00 | 28 Semi Detached Houses |
| Detached House | £592,454.00 | 11 Detached Houses |
| Terraced House | £253,155.00 | 374 Terraced Houses |

