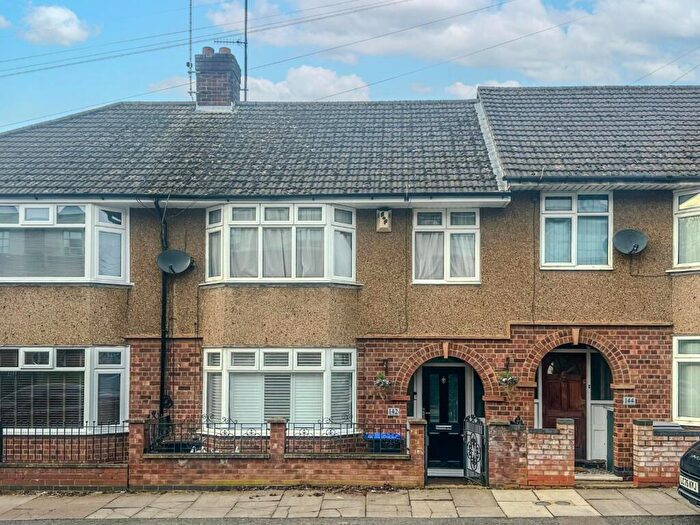
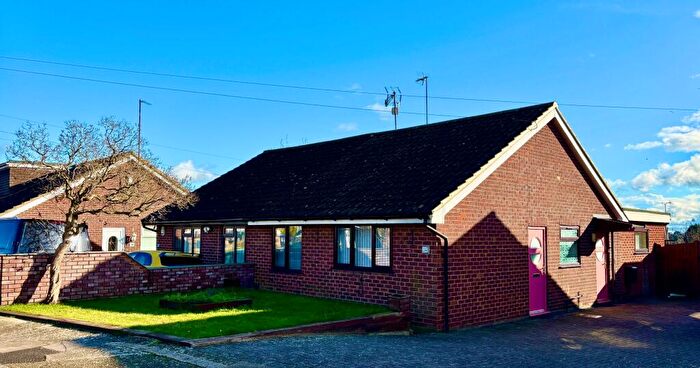
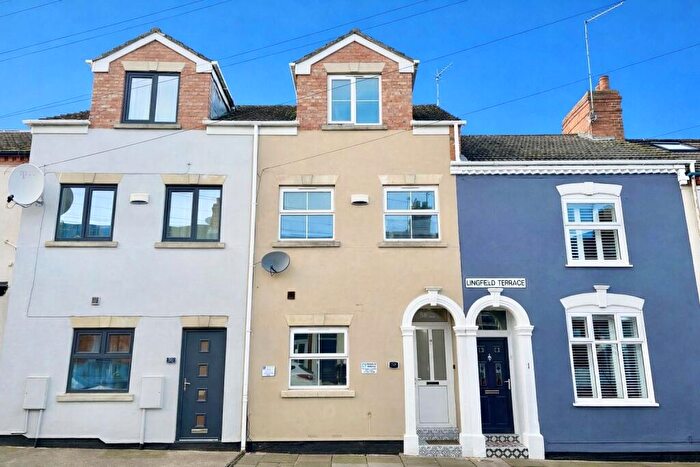
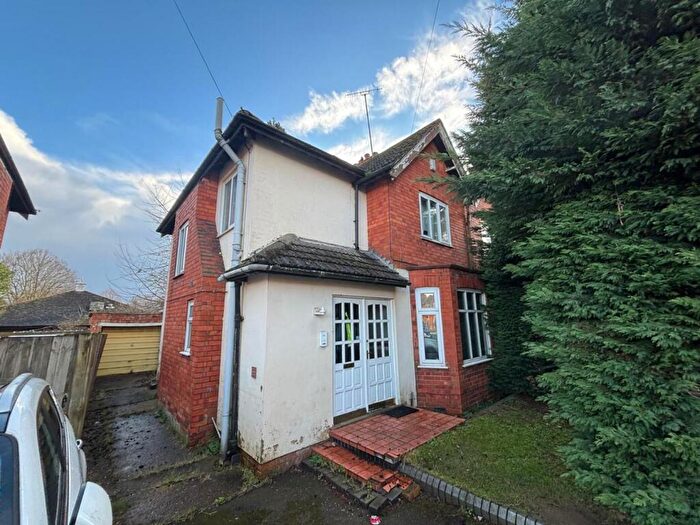
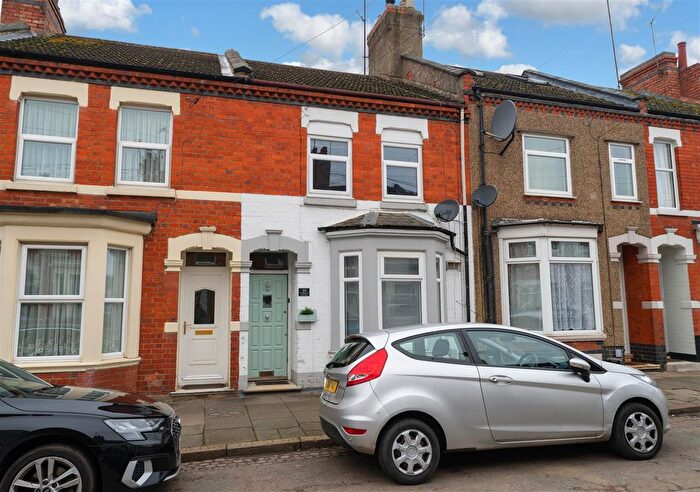
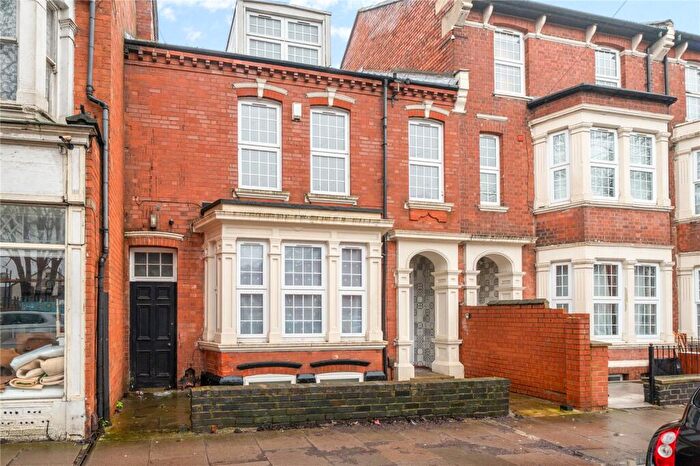
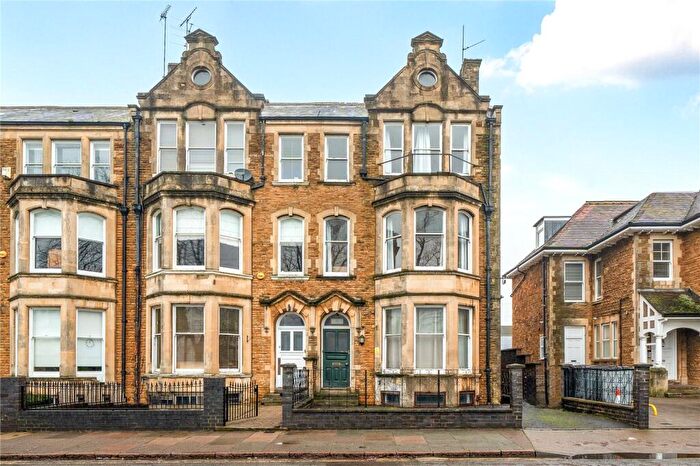
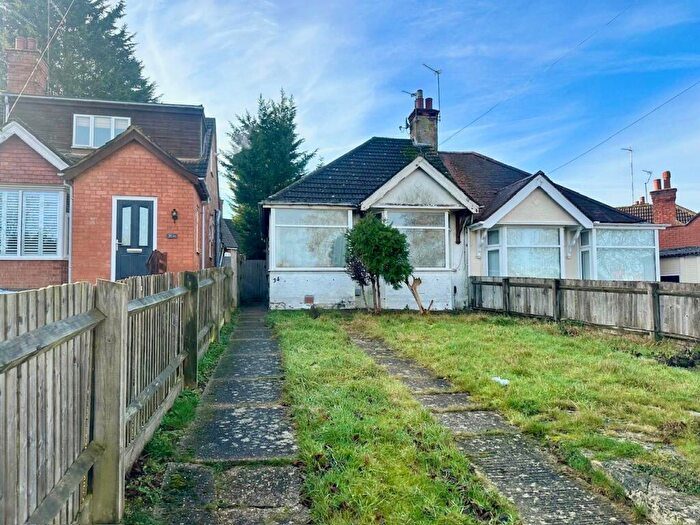
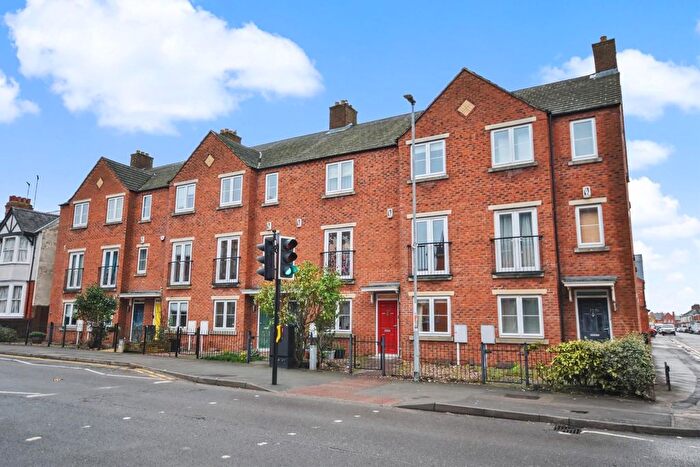
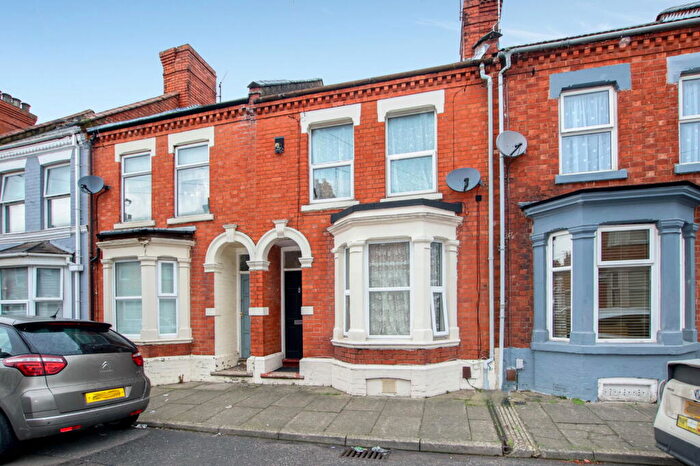
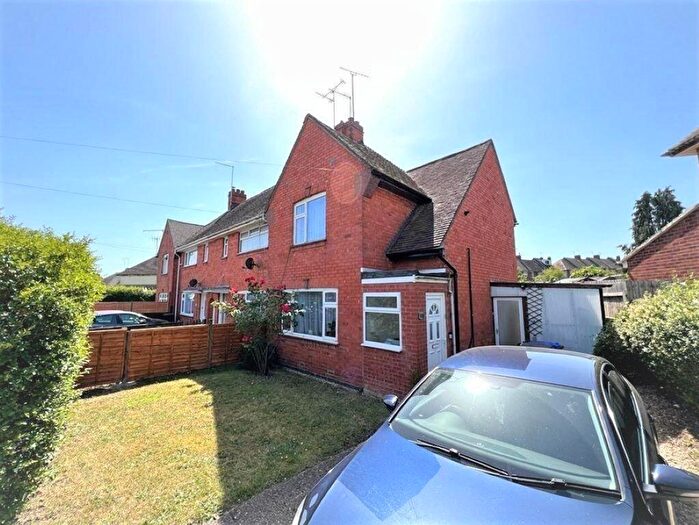
Houses for sale & to rent in Kingsley, Northampton
House Prices in Kingsley
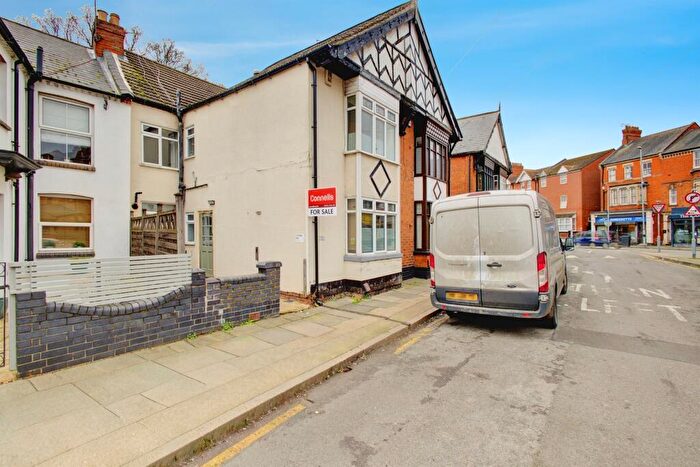
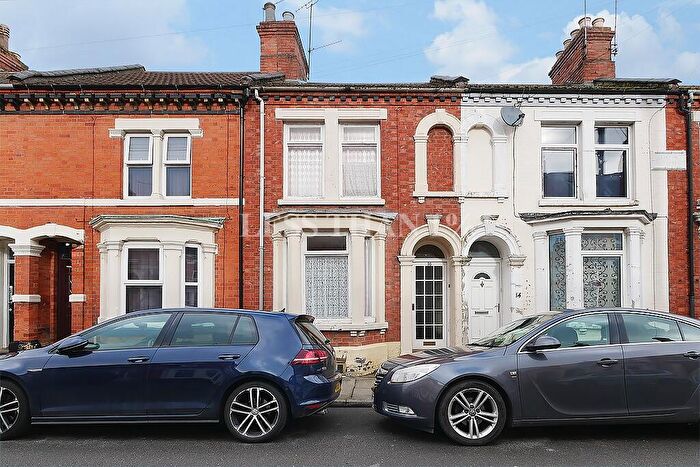
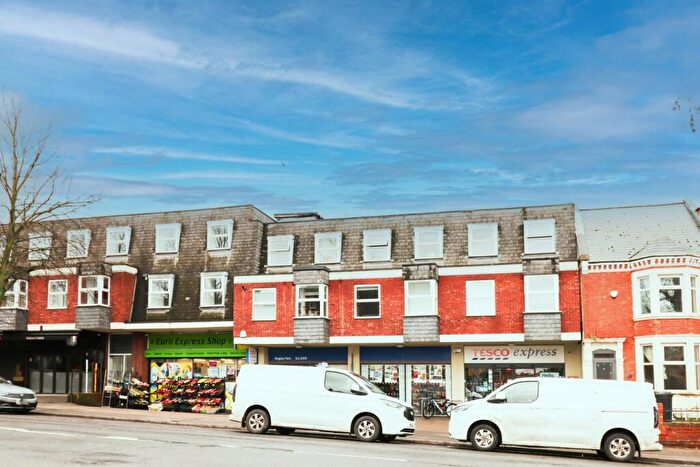
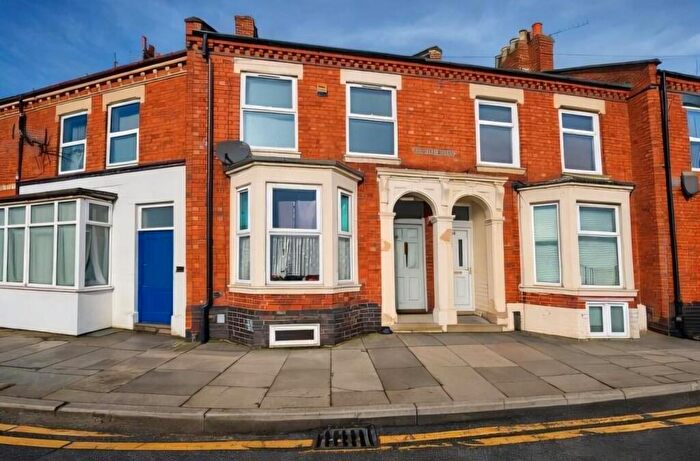
Properties in Kingsley have an average house price of £220,888.00 and had 242 Property Transactions within the last 3 years¹.
Kingsley is an area in Northampton, Northamptonshire with 2,359 households², where the most expensive property was sold for £545,000.00.
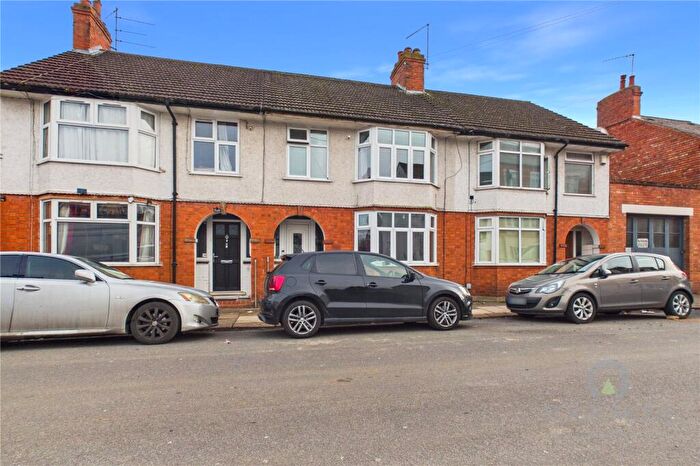
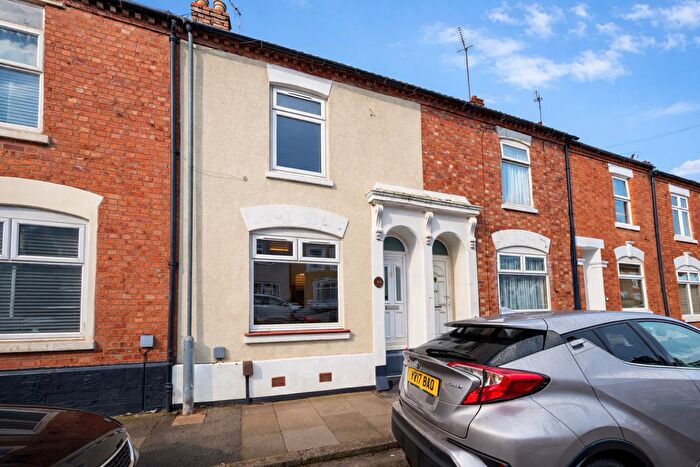
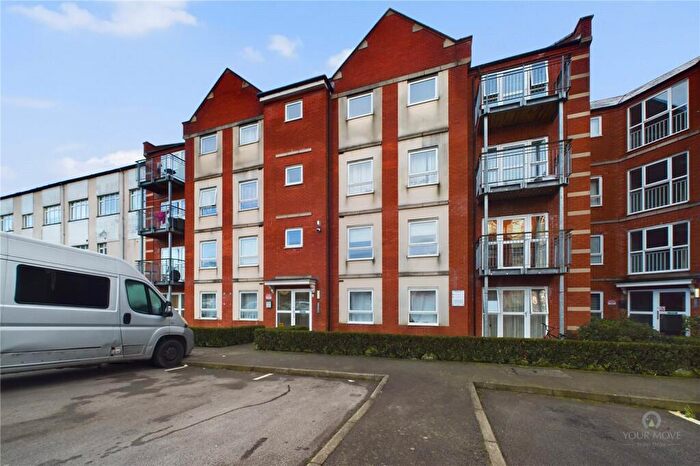
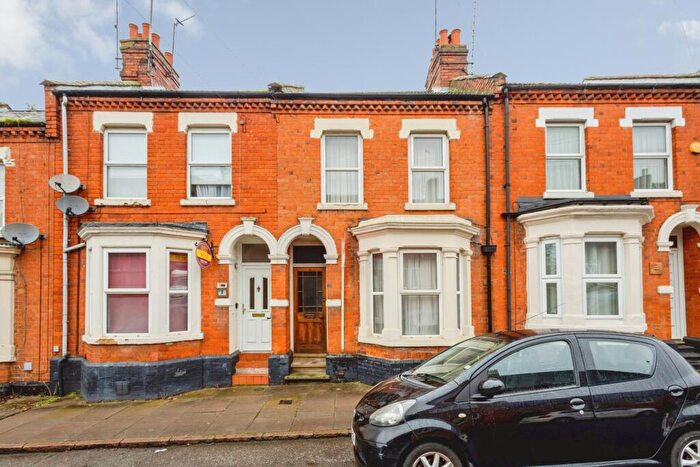
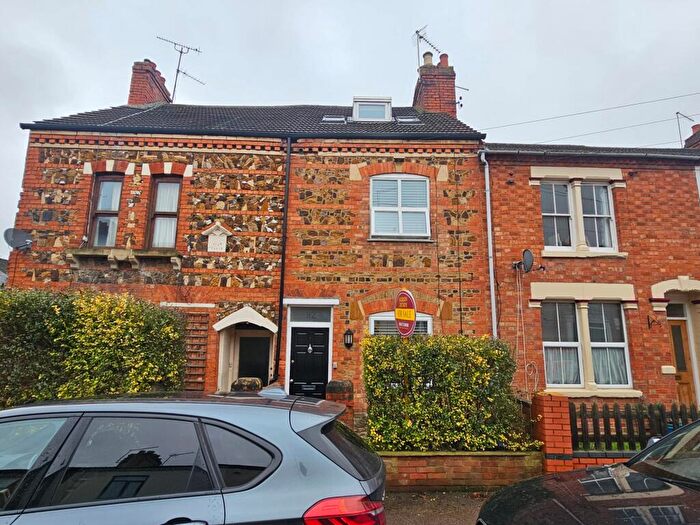
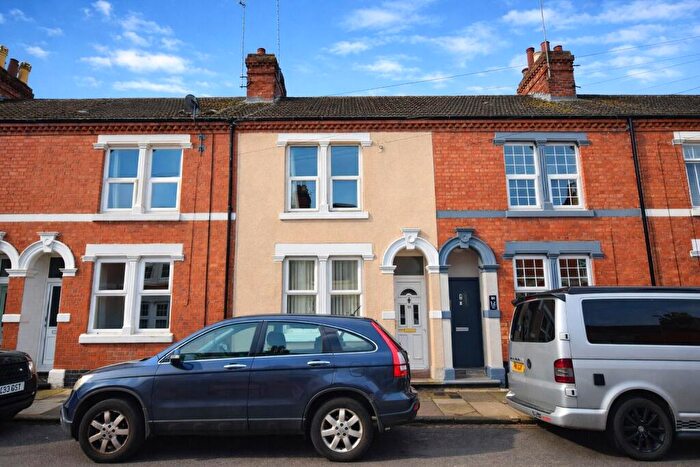
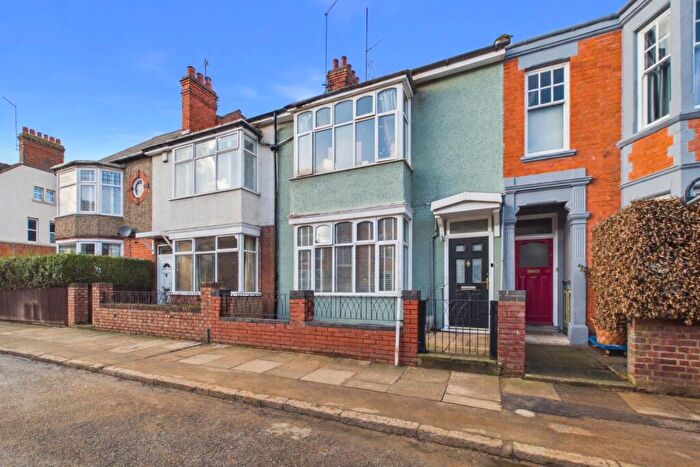
Properties for sale in Kingsley
Roads and Postcodes in Kingsley
Navigate through our locations to find the location of your next house in Kingsley, Northampton for sale or to rent.
| Streets | Postcodes |
|---|---|
| Ainsdale Close | NN2 7NQ |
| Bankside | NN2 7NG |
| Birkdale Close | NN2 7PD |
| Brackenhill Close | NN2 7LD |
| Brookfield Road | NN2 7LP NN2 7LS NN2 7LT NN2 7LU NN2 7LX NN2 7LY |
| Byron Street | NN2 7JD NN2 7JE |
| Carlton Gardens | NN2 7DH |
| Carlton Road | NN2 7DQ |
| Chaucer Street | NN2 7HN NN2 7HW |
| Cowper Terrace | NN2 7JB |
| Crocket Close | NN2 7LL |
| Cutler Close | NN2 7EY |
| Fairfield Road | NN2 7ED |
| Fairway | NN2 7JX NN2 7JY NN2 7JZ |
| Fulford Drive | NN2 7NR NN2 7NU NN2 7NX |
| Furze Walk | NN2 7LN |
| Greenview Drive | NN2 7LA NN2 7LB NN2 7LE NN2 7LJ NN2 7LQ |
| Hazeldene Road | NN2 7NB NN2 7ND NN2 7NH NN2 7NP NN2 7NW NN2 7NZ NN2 7PA NN2 7PB |
| Heatherdale Way | NN2 7NY |
| Hollingside Drive | NN2 7NN |
| Hoylake Drive | NN2 7NJ NN2 7NL |
| Junction Road | NN2 7HS NN2 7JA NN2 7JQ |
| Kenmuir Avenue | NN2 7DX NN2 7DY NN2 7EH NN2 7EJ NN2 7EQ NN2 7EW |
| Kenmuir Crescent | NN2 7EL NN2 7EN |
| Kenmuir Gardens | NN2 7EA |
| Kettering Road | NN2 7DU NN3 6AA |
| Kingsley Park Terrace | NN2 7HG NN2 7HH NN2 7HJ NN2 7HL |
| Kingsley Road | NN2 7BU |
| Lingfield Terrace | NN2 7HT |
| Lytham Close | NN2 7LF |
| Malcolm Road | NN2 7EB |
| Malcolm Terrace | NN2 7DZ |
| Masefield Way | NN2 7JT NN2 7JU |
| Milton Street | NN2 7JF NN2 7JG |
| Milton Street North | NN2 7DD NN2 7DE NN2 7DF |
| Moore Street | NN2 7HU NN2 7HX |
| Oliver Street | NN2 7JH NN2 7JJ NN2 7JL |
| Raeburn Road | NN2 7EP NN2 7ET NN2 7EU |
| Randall Road | NN2 7BZ NN2 7DG |
| Rennishaw Way | NN2 7NE NN2 7NF |
| Romany Road | NN2 7DB NN2 7DJ |
| Rothesay Road | NN2 7ES |
| Rothesay Terrace | NN2 7ER |
| Ryland Road | NN2 7DL |
| Shelley Street | NN2 7HY NN2 7HZ |
| Sunningdale Close | NN2 7LR |
| Thistleholme Close | NN2 7LH |
| Wallace Gardens | NN2 7EF |
| Wallace Road | NN2 7EE |
| Wallace Terrace | NN2 7EG |
| Walton Heath Way | NN2 7LG |
| Waverley Road | NN2 7DA |
| Wentworth Way | NN2 7LW |
Transport near Kingsley
- FAQ
- Price Paid By Year
- Property Type Price
Frequently asked questions about Kingsley
What is the average price for a property for sale in Kingsley?
The average price for a property for sale in Kingsley is £220,888. This amount is 23% lower than the average price in Northampton. There are 1,906 property listings for sale in Kingsley.
What streets have the most expensive properties for sale in Kingsley?
The streets with the most expensive properties for sale in Kingsley are Fulford Drive at an average of £352,000, Ainsdale Close at an average of £340,000 and Lingfield Terrace at an average of £300,000.
What streets have the most affordable properties for sale in Kingsley?
The streets with the most affordable properties for sale in Kingsley are Cutler Close at an average of £86,250, Birkdale Close at an average of £140,500 and Cowper Terrace at an average of £153,800.
Which train stations are available in or near Kingsley?
Some of the train stations available in or near Kingsley are Northampton, Long Buckby and Wellingborough.
Property Price Paid in Kingsley by Year
The average sold property price by year was:
| Year | Average Sold Price | Price Change |
Sold Properties
|
|---|---|---|---|
| 2025 | £223,182 | 2% |
73 Properties |
| 2024 | £218,371 | -1% |
88 Properties |
| 2023 | £221,555 | -5% |
81 Properties |
| 2022 | £233,015 | 11% |
104 Properties |
| 2021 | £207,885 | 8% |
123 Properties |
| 2020 | £192,203 | 5% |
88 Properties |
| 2019 | £182,022 | -5% |
90 Properties |
| 2018 | £191,468 | -2% |
90 Properties |
| 2017 | £194,976 | 15% |
106 Properties |
| 2016 | £165,116 | 10% |
85 Properties |
| 2015 | £148,530 | 11% |
120 Properties |
| 2014 | £132,292 | 8% |
118 Properties |
| 2013 | £122,106 | -2% |
99 Properties |
| 2012 | £124,426 | 1% |
72 Properties |
| 2011 | £123,786 | 3% |
69 Properties |
| 2010 | £119,513 | 5% |
61 Properties |
| 2009 | £114,047 | -18% |
58 Properties |
| 2008 | £134,185 | -3% |
77 Properties |
| 2007 | £137,747 | 6% |
133 Properties |
| 2006 | £128,997 | 3% |
143 Properties |
| 2005 | £124,826 | 3% |
145 Properties |
| 2004 | £120,531 | 13% |
153 Properties |
| 2003 | £104,750 | 17% |
155 Properties |
| 2002 | £86,615 | 20% |
163 Properties |
| 2001 | £69,302 | 8% |
143 Properties |
| 2000 | £63,790 | 14% |
123 Properties |
| 1999 | £55,090 | 11% |
164 Properties |
| 1998 | £49,214 | 3% |
134 Properties |
| 1997 | £47,929 | 17% |
142 Properties |
| 1996 | £39,763 | 4% |
104 Properties |
| 1995 | £38,343 | - |
111 Properties |
Property Price per Property Type in Kingsley
Here you can find historic sold price data in order to help with your property search.
The average Property Paid Price for specific property types in the last three years are:
| Property Type | Average Sold Price | Sold Properties |
|---|---|---|
| Semi Detached House | £234,961.00 | 73 Semi Detached Houses |
| Detached House | £285,923.00 | 13 Detached Houses |
| Terraced House | £211,703.00 | 149 Terraced Houses |
| Flat | £148,857.00 | 7 Flats |

