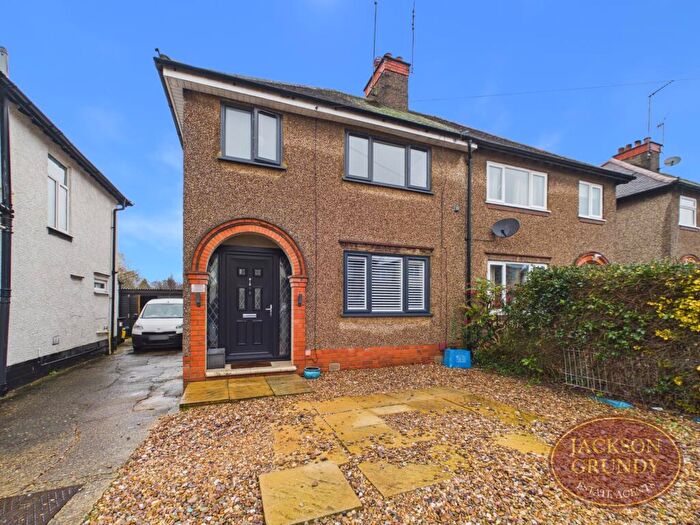
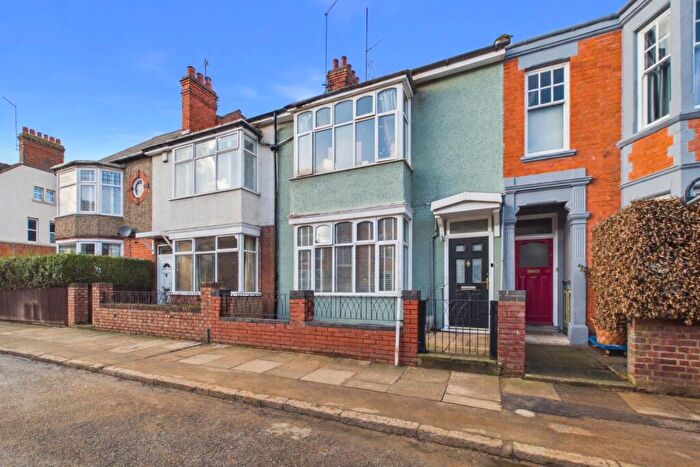
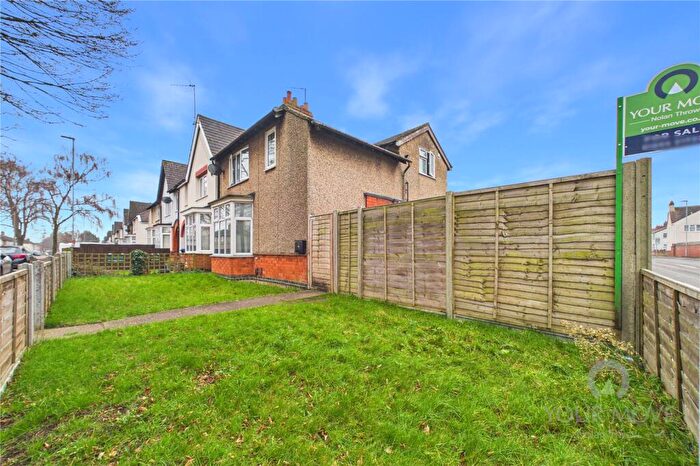
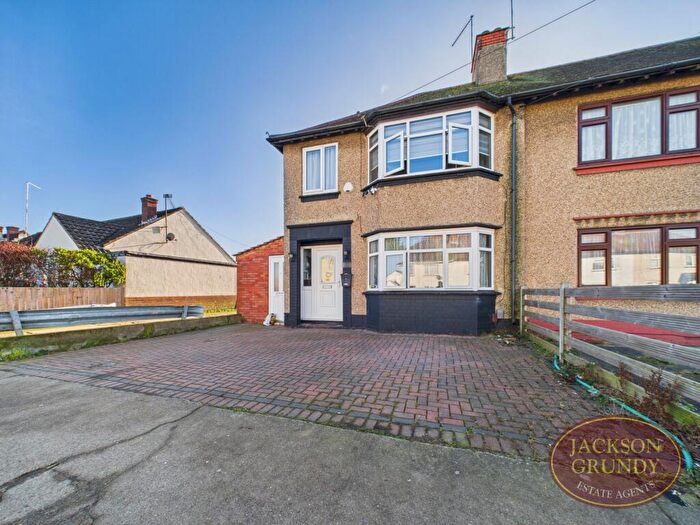
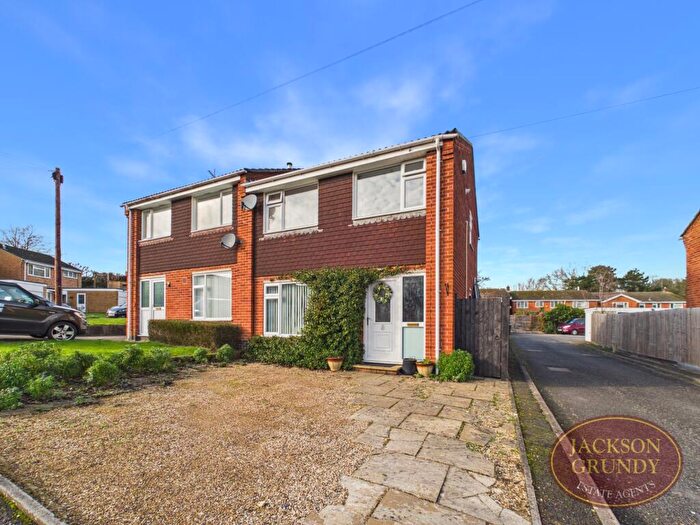
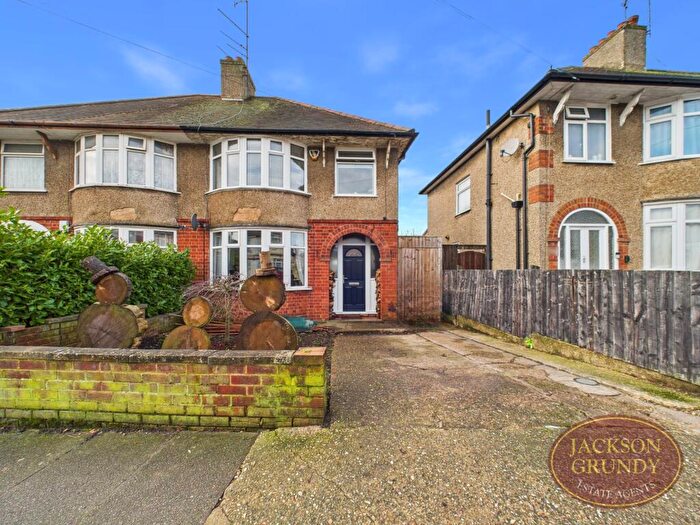
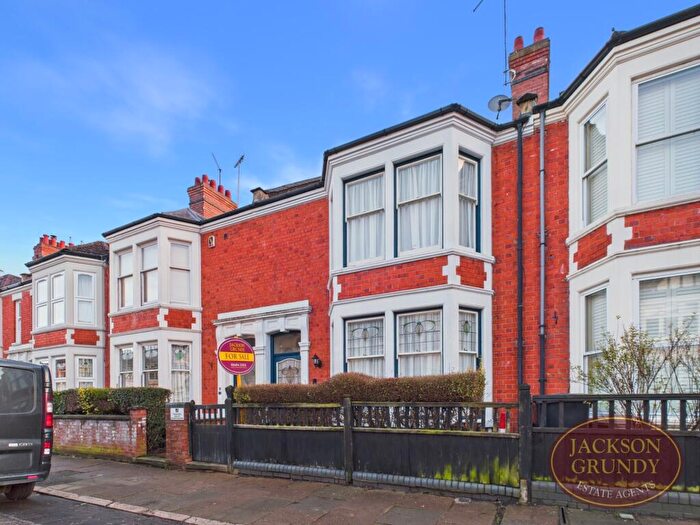
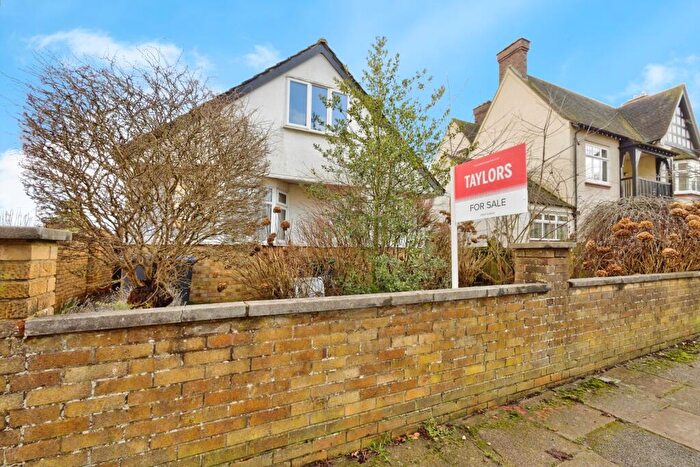
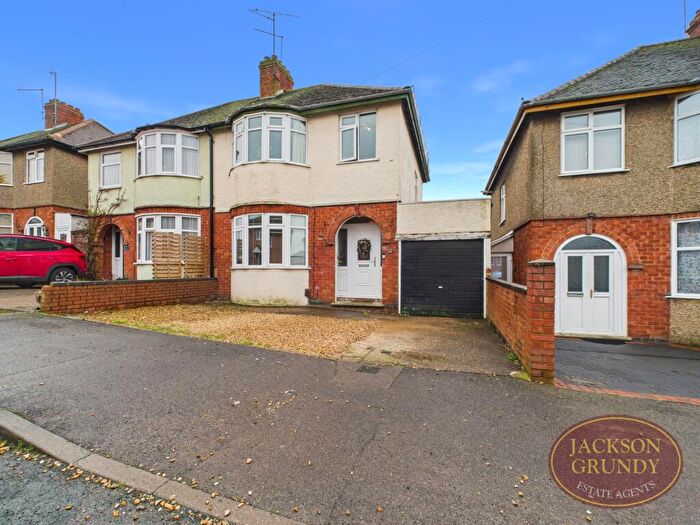
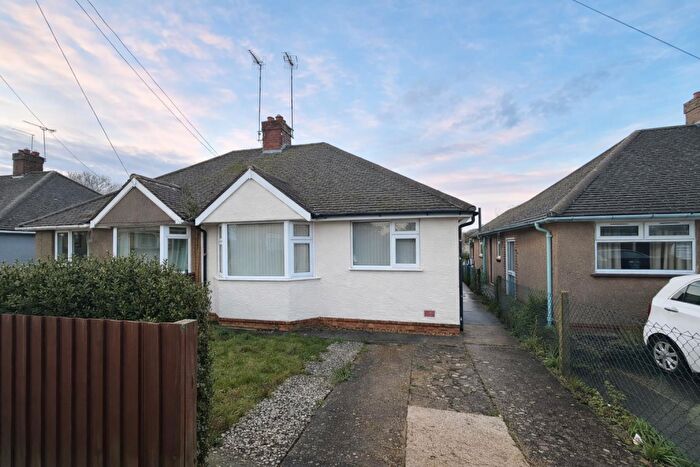
Houses for sale & to rent in Headlands, Northampton
House Prices in Headlands
Properties in Headlands have an average house price of £249,642.00 and had 175 Property Transactions within the last 3 years¹.
Headlands is an area in Northampton, Northamptonshire with 2,024 households², where the most expensive property was sold for £405,000.00.
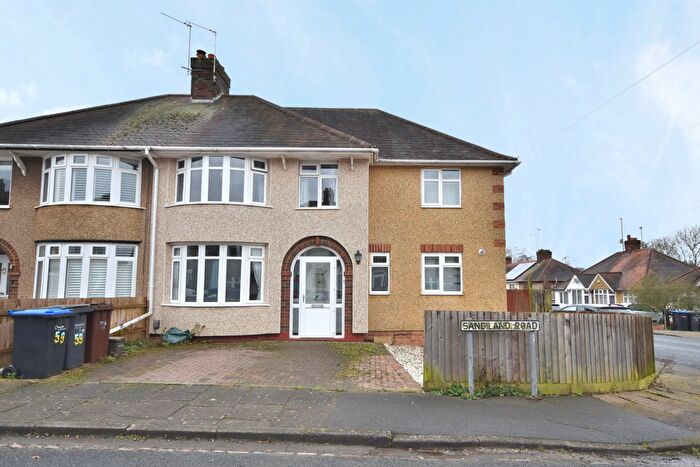
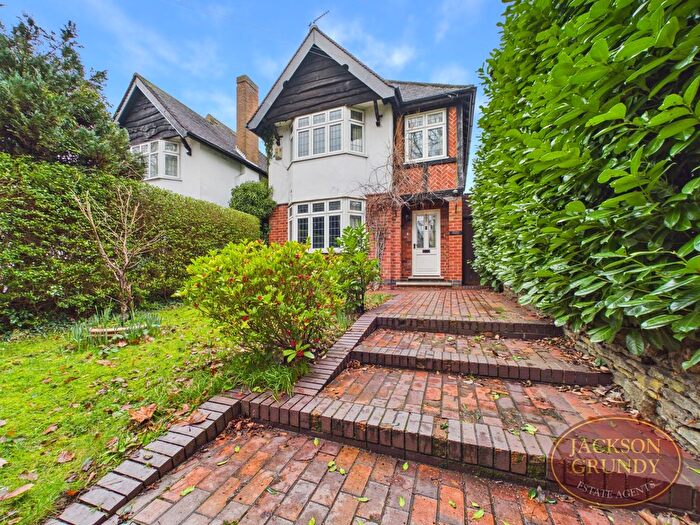
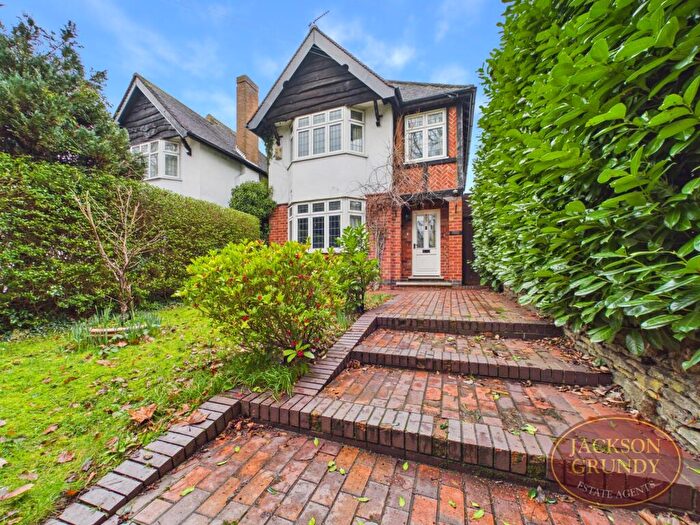
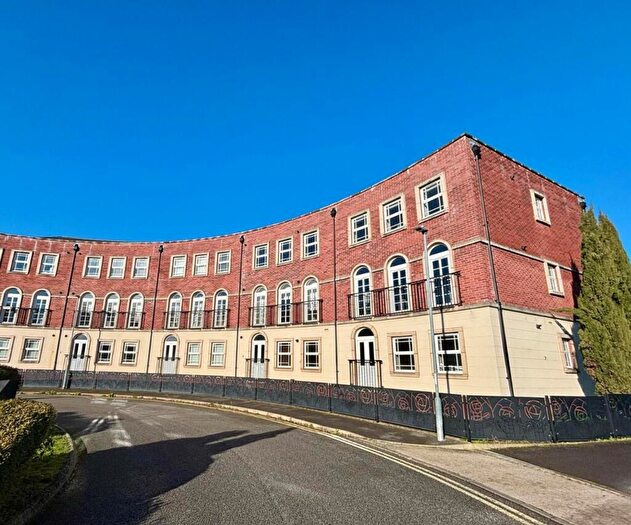
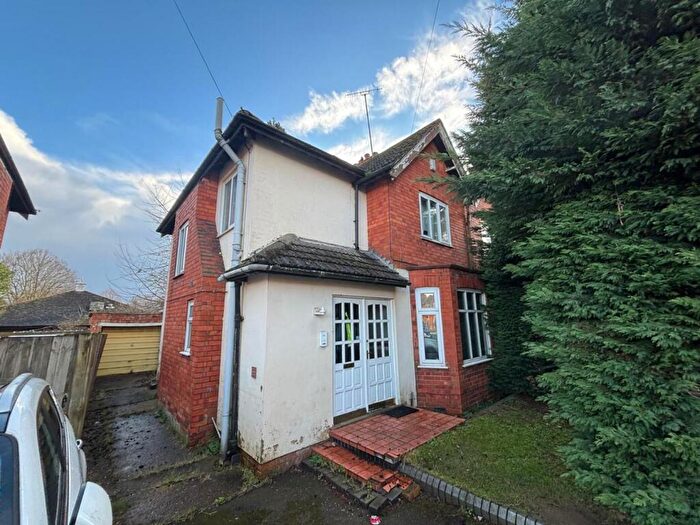
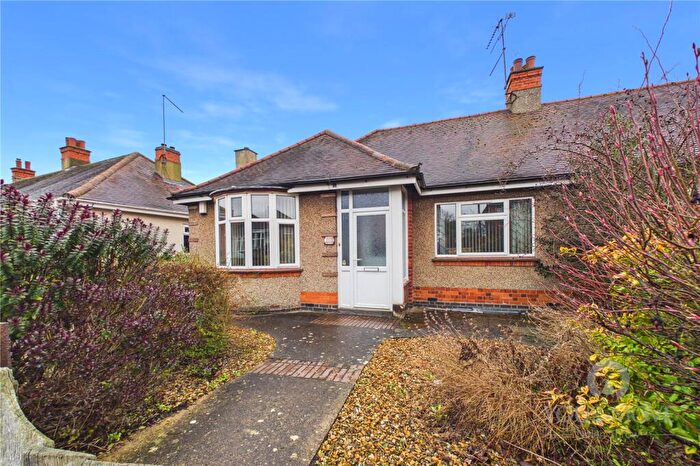
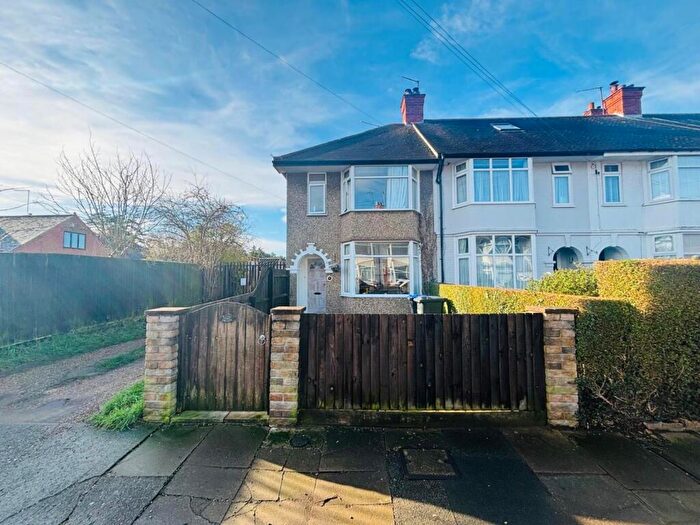
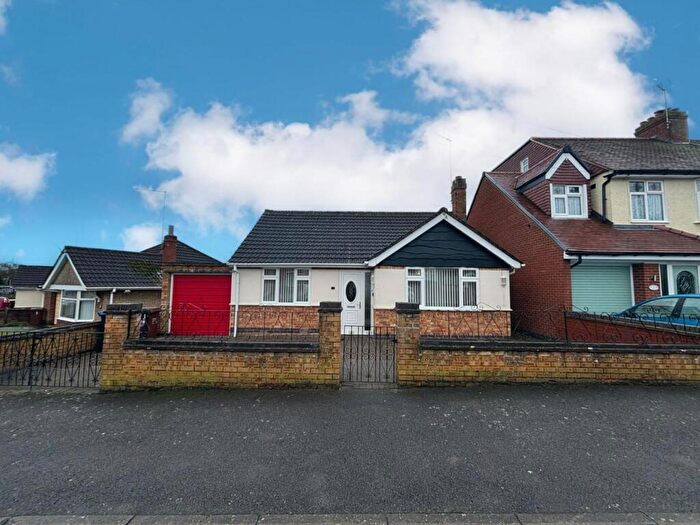
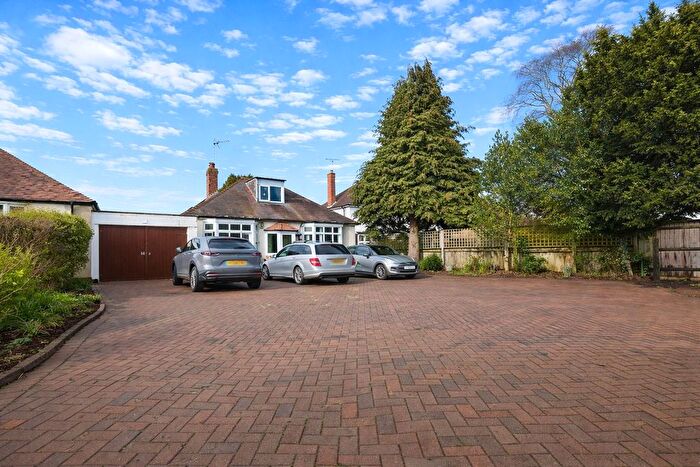
Properties for sale in Headlands
Roads and Postcodes in Headlands
Navigate through our locations to find the location of your next house in Headlands, Northampton for sale or to rent.
| Streets | Postcodes |
|---|---|
| Almond Grove | NN3 2DF |
| Beech Avenue | NN3 2JG NN3 2JQ |
| Beverley Crescent | NN3 2PX NN3 2PY |
| Birchfield Court | NN3 2SW |
| Birchfield Road East | NN3 2HG NN3 2HQ NN3 2SN NN3 2SY NN3 2SZ |
| Briton Gardens | NN3 2BT |
| Briton Road | NN3 2BS |
| Briton Terrace | NN3 2HJ |
| Broadway East | NN3 2PR NN3 2PS NN3 2PT NN3 2PU |
| Bush Hill | NN3 2PD NN3 2PE NN3 2PF NN3 2PG |
| Cambria Crescent | NN3 2SX |
| Chestnut Terrace | NN3 2JT |
| Danefield Road | NN3 2LT NN3 2SP NN3 2SR |
| Danetree Gardens | NN3 2LX |
| Danewood Gardens | NN3 2LU |
| Dryland Road | NN3 2QL |
| Fieldway | NN3 2SL |
| Fullingdale Road | NN3 2PZ NN3 2QA NN3 2QF NN3 2QH NN3 2QJ |
| Grange Court | NN3 2BH |
| Lindsay Avenue | NN3 2LP NN3 2LY NN3 2LZ NN3 2SH NN3 2SJ |
| Longland Road | NN3 2QE |
| Mercia Gardens | NN3 2SU |
| Mistletoe Place | NN3 2DB |
| Norman Road | NN3 2SG |
| Northumbria Gardens | NN3 2ST |
| Northwood Court | NN3 2NG |
| Northwood Road | NN3 2LR |
| Rose Gardens | NN3 3EW |
| Sandiland Road | NN3 2QB NN3 2QD |
| Saxon Street | NN3 2SQ |
| Taylor Avenue | NN3 2DG |
| The Courtyard | NN3 2DD |
| The Headlands | NN3 2NU NN3 2NX NN3 2NY NN3 2NZ NN3 2PA NN3 2PB |
| The Meadow | NN3 2DA |
| Upland Road | NN3 2QQ |
| Walnut Grove | NN3 2DE |
| Wellingborough Road | NN3 3HR NN3 3HT NN3 3HU |
| Wessex Way | NN3 2SS |
| Wheatfield Close | NN3 2BW |
| Wheatfield Gardens | NN3 2NF |
| Wheatfield Road | NN3 2ND NN3 2NE |
| Wheatfield Road North | NN3 2LW NN3 2NA |
| Wheatfield Road South | NN3 2HH NN3 2BP |
| Wheatfield Terrace | NN3 2NB |
| Whiteland Road | NN3 2QG |
Transport near Headlands
- FAQ
- Price Paid By Year
- Property Type Price
Frequently asked questions about Headlands
What is the average price for a property for sale in Headlands?
The average price for a property for sale in Headlands is £249,642. This amount is 13% lower than the average price in Northampton. There are 1,315 property listings for sale in Headlands.
What streets have the most expensive properties for sale in Headlands?
The streets with the most expensive properties for sale in Headlands are Wheatfield Terrace at an average of £322,000, Wellingborough Road at an average of £312,750 and Bush Hill at an average of £298,230.
What streets have the most affordable properties for sale in Headlands?
The streets with the most affordable properties for sale in Headlands are Wessex Way at an average of £137,500, Danetree Gardens at an average of £151,500 and The Courtyard at an average of £157,333.
Which train stations are available in or near Headlands?
Some of the train stations available in or near Headlands are Northampton, Wellingborough and Long Buckby.
Property Price Paid in Headlands by Year
The average sold property price by year was:
| Year | Average Sold Price | Price Change |
Sold Properties
|
|---|---|---|---|
| 2025 | £255,311 | 6% |
53 Properties |
| 2024 | £240,091 | -6% |
60 Properties |
| 2023 | £254,040 | -1% |
62 Properties |
| 2022 | £255,840 | 11% |
67 Properties |
| 2021 | £227,562 | 6% |
74 Properties |
| 2020 | £213,633 | 1% |
56 Properties |
| 2019 | £212,554 | 7% |
64 Properties |
| 2018 | £198,651 | 3% |
66 Properties |
| 2017 | £193,092 | 6% |
84 Properties |
| 2016 | £181,805 | 10% |
88 Properties |
| 2015 | £163,695 | 6% |
79 Properties |
| 2014 | £154,184 | 11% |
74 Properties |
| 2013 | £136,622 | -2% |
80 Properties |
| 2012 | £139,142 | 5% |
56 Properties |
| 2011 | £131,863 | 4% |
43 Properties |
| 2010 | £127,177 | 2% |
55 Properties |
| 2009 | £124,111 | -19% |
48 Properties |
| 2008 | £147,736 | 1% |
38 Properties |
| 2007 | £146,703 | 5% |
105 Properties |
| 2006 | £139,012 | 7% |
121 Properties |
| 2005 | £128,617 | 8% |
86 Properties |
| 2004 | £118,720 | 13% |
108 Properties |
| 2003 | £103,203 | 14% |
118 Properties |
| 2002 | £88,922 | 14% |
103 Properties |
| 2001 | £76,183 | 3% |
112 Properties |
| 2000 | £73,945 | 23% |
104 Properties |
| 1999 | £57,083 | - |
89 Properties |
| 1998 | £57,065 | 16% |
79 Properties |
| 1997 | £47,677 | 13% |
103 Properties |
| 1996 | £41,567 | 4% |
91 Properties |
| 1995 | £39,852 | - |
63 Properties |
Property Price per Property Type in Headlands
Here you can find historic sold price data in order to help with your property search.
The average Property Paid Price for specific property types in the last three years are:
| Property Type | Average Sold Price | Sold Properties |
|---|---|---|
| Semi Detached House | £260,780.00 | 116 Semi Detached Houses |
| Detached House | £339,375.00 | 4 Detached Houses |
| Terraced House | £219,627.00 | 55 Terraced Houses |

