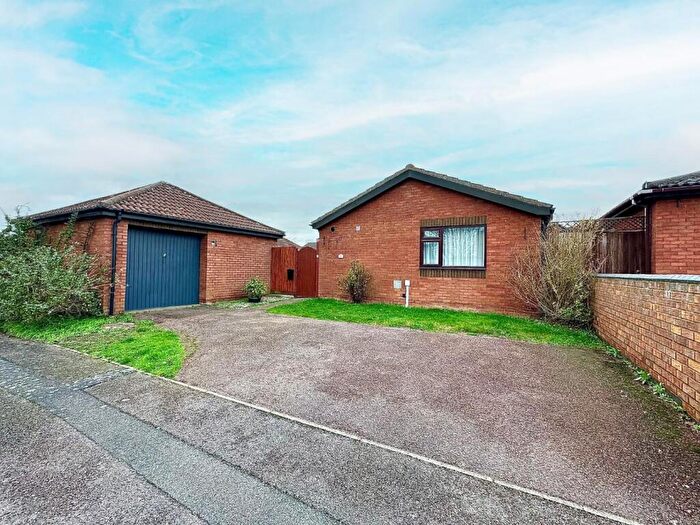
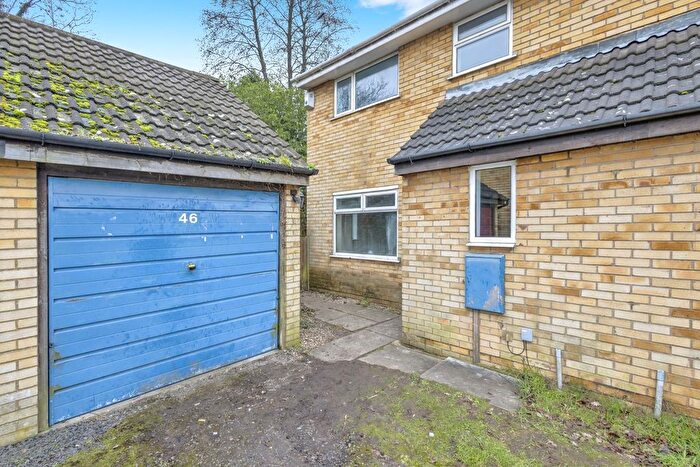
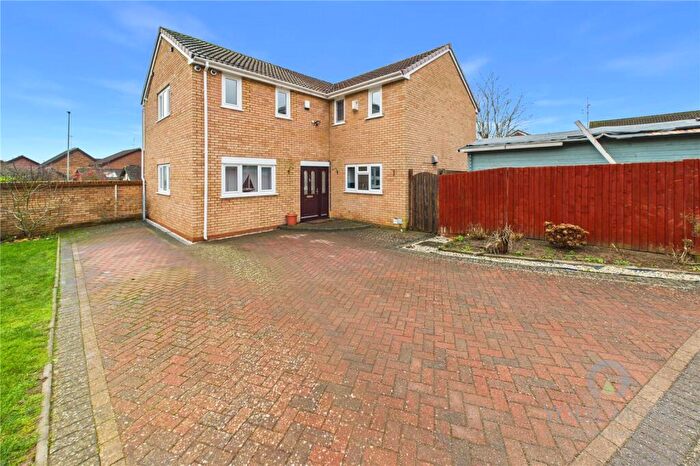
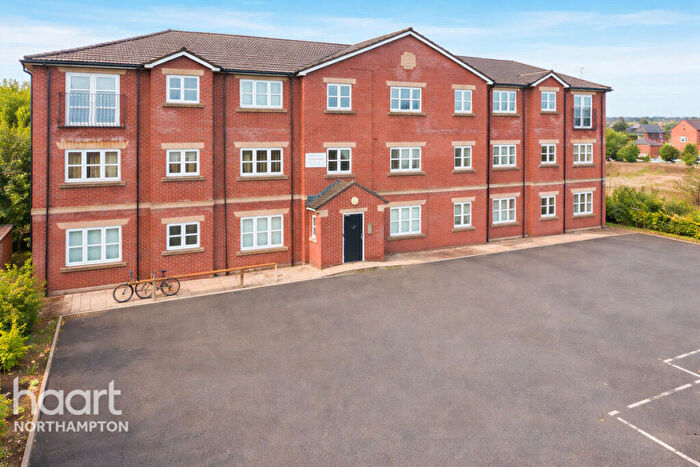
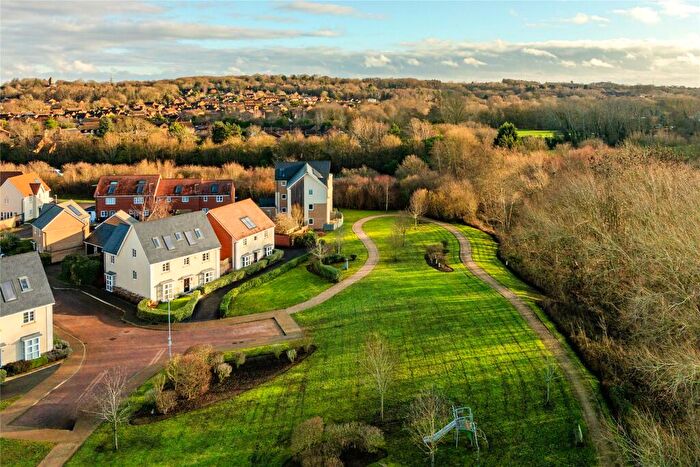
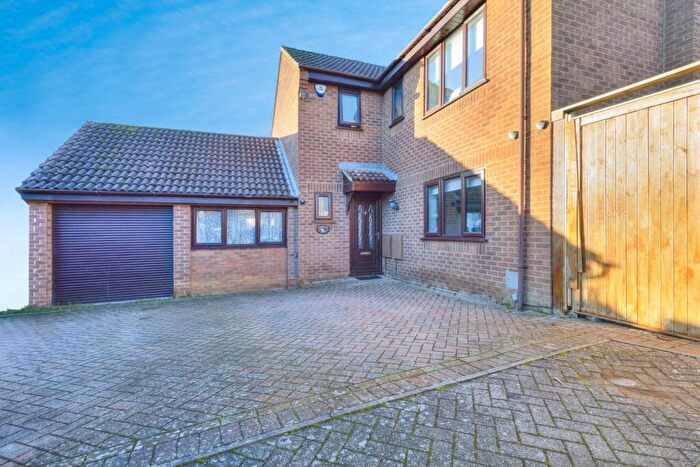
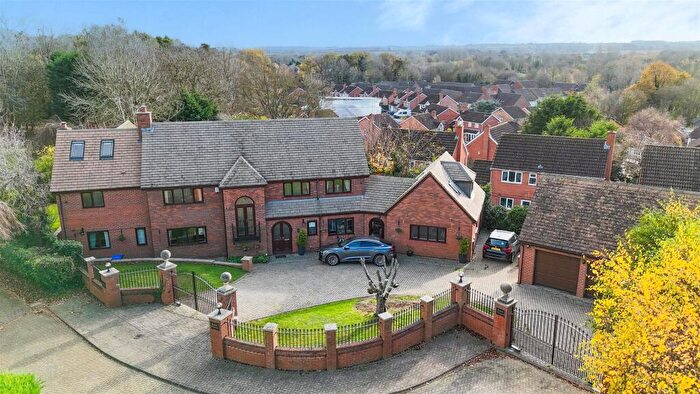
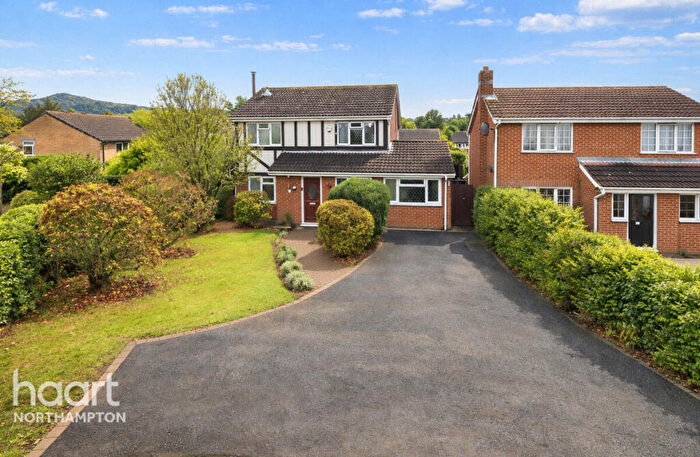
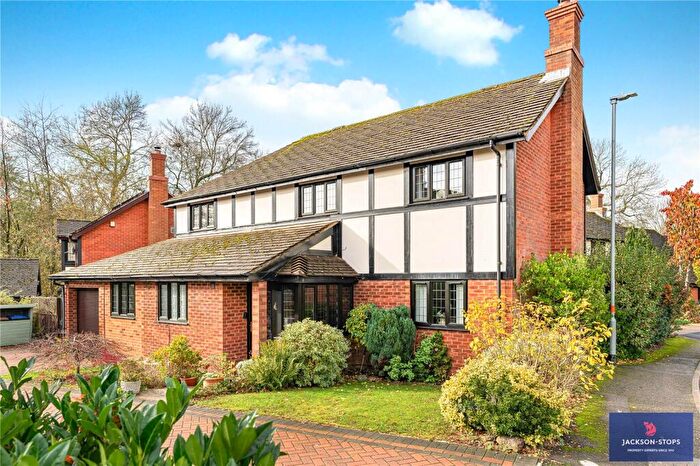
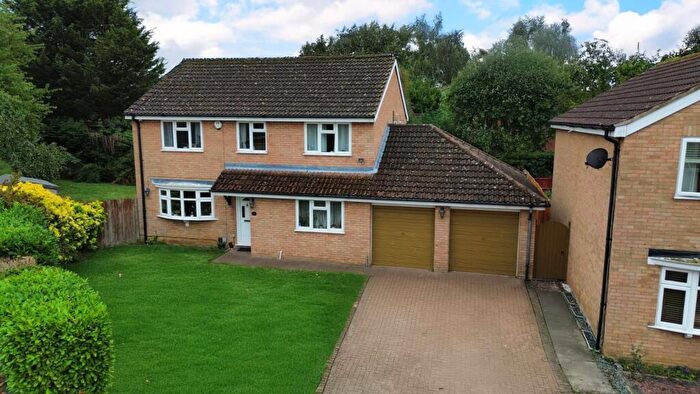
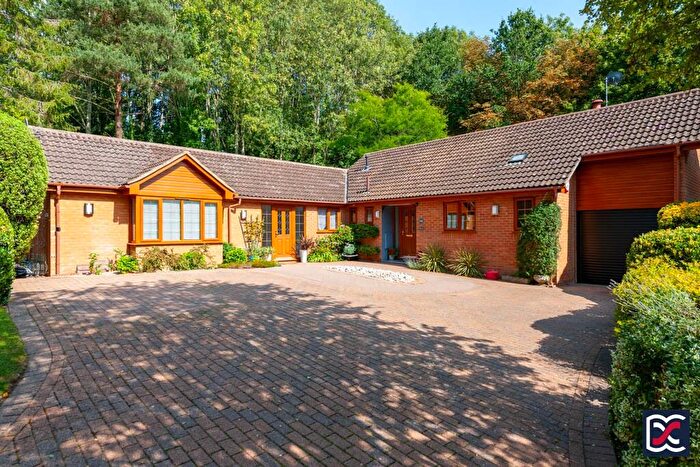
Houses for sale & to rent in West Hunsbury, Northampton
House Prices in West Hunsbury
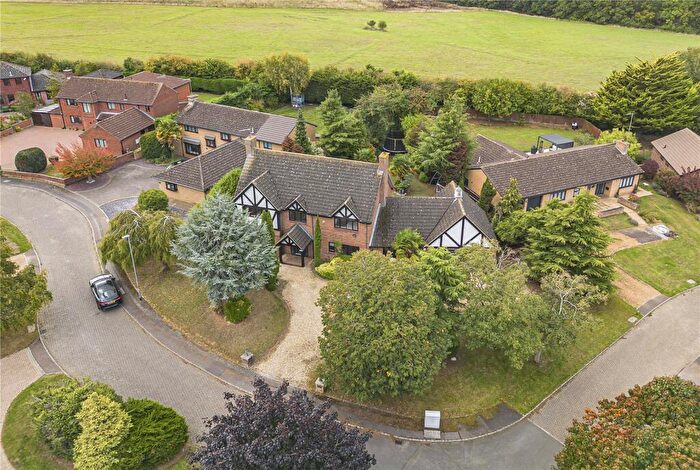
Properties in West Hunsbury have an average house price of £340,871.00 and had 189 Property Transactions within the last 3 years¹.
West Hunsbury is an area in Northampton, Northamptonshire with 1,839 households², where the most expensive property was sold for £800,000.00.
Properties for sale in West Hunsbury
Roads and Postcodes in West Hunsbury
Navigate through our locations to find the location of your next house in West Hunsbury, Northampton for sale or to rent.
| Streets | Postcodes |
|---|---|
| Archangel Square | NN4 9RA |
| Aviemore Gardens | NN4 9XJ |
| Bakewell Close | NN4 9YY |
| Banbury Close | NN4 9UA |
| Benjamin Square | NN4 9RH |
| Bittern Street | NN4 9DL |
| Blackwell Hill | NN4 9YB |
| Bledlow Rise | NN4 9YE |
| Bourton Close | NN4 9YT |
| Bowmans Close | NN4 9XR |
| Bramble End | NN4 9YD |
| Bullrush Walk | NN4 9DN |
| Claystones | NN4 9UY |
| Crownsmead | NN4 9XP |
| Cullahill Court | NN4 9YJ |
| Dalestones | NN4 9UU |
| Dayrell Road | NN4 9RR |
| Dayrell Square | NN4 9RJ |
| Dimock Square | NN4 9RB |
| Farraxton Square | NN4 9RQ |
| Fiensgate | NN4 9XQ |
| Firecrest Walk | NN4 9DJ |
| Foxford Close | NN4 9UH |
| Galane Close | NN4 9YR |
| Greenglades | NN4 9YW |
| Gresham Drive | NN4 9SB NN4 9SZ |
| Harksome Hill | NN4 9YF NN4 9QX |
| Haselrig Square | NN4 9RD |
| Hawkridge | NN4 9YP |
| Hernhill Court | NN4 9YL |
| Heronsford | NN4 9XG |
| Higgins Square | NN4 9RE |
| Holbein Gardens | NN4 9XT |
| Hudson Drive | NN4 9XD |
| Hunsbury Close | NN4 9UE |
| Hunsbury Green | NN4 9UL |
| Hunsbury Hill Road | NN4 9UG NN4 9UW |
| Icknield Drive | NN4 9YS |
| Joshua Square | NN4 9RL |
| Ladymead Close | NN4 9SE |
| Lister Drive | NN4 9XE |
| Mallard Close | NN4 9UR |
| Mandarin Street | NN4 9DQ |
| Marlstones | NN4 9UZ |
| Marnock Square | NN4 9RF |
| Merryhill | NN4 9YH |
| Miller Hill | NN4 9YG |
| Parsons Meade | NN4 9PS |
| Plantagenet Square | NN4 9RG |
| Reedhill | NN4 9UP |
| Sarek Park | NN4 9YA |
| Sentinel Road | NN4 9UF |
| Southcrest | NN4 9UD |
| St Benedicts Mount | NN4 9XN |
| St Dunstans Rise | NN4 9XL |
| Stuart Close | NN4 9YZ |
| Summerfields | NN4 9YN |
| Sundew Court | NN4 9XH |
| Swift Court | NN4 9DH |
| Tall Trees Close | NN4 9XZ |
| Tansy Close | NN4 9XW |
| Teal Close | NN4 9XF |
| Tideswell Close | NN4 9XY |
| Towcester Road | NN4 9RN |
| Wardlow Close | NN4 9YQ |
| Whaddon Close | NN4 9XS |
| Whistlets Close | NN4 9XB |
| Whitegates | NN4 9XA |
| Wood Avens Close | NN4 9TX |
| Woodhall Close | NN4 9UB |
| Woodlark Court | NN4 9DA |
| Yarwell Square | NN4 9RP |
Transport near West Hunsbury
-
Northampton Station
-
Long Buckby Station
-
Wolverton Station
-
Wellingborough Station
-
Milton Keynes Central Station
-
Kettering Station
- FAQ
- Price Paid By Year
- Property Type Price
Frequently asked questions about West Hunsbury
What is the average price for a property for sale in West Hunsbury?
The average price for a property for sale in West Hunsbury is £340,871. This amount is 19% higher than the average price in Northampton. There are 718 property listings for sale in West Hunsbury.
What streets have the most expensive properties for sale in West Hunsbury?
The streets with the most expensive properties for sale in West Hunsbury are Southcrest at an average of £800,000, Teal Close at an average of £690,833 and Hunsbury Close at an average of £671,248.
What streets have the most affordable properties for sale in West Hunsbury?
The streets with the most affordable properties for sale in West Hunsbury are Firecrest Walk at an average of £71,250, Mandarin Street at an average of £131,750 and Marnock Square at an average of £156,000.
Which train stations are available in or near West Hunsbury?
Some of the train stations available in or near West Hunsbury are Northampton, Long Buckby and Wolverton.
Property Price Paid in West Hunsbury by Year
The average sold property price by year was:
| Year | Average Sold Price | Price Change |
Sold Properties
|
|---|---|---|---|
| 2025 | £338,276 | 5% |
56 Properties |
| 2024 | £322,766 | -14% |
76 Properties |
| 2023 | £367,561 | -1% |
57 Properties |
| 2022 | £370,445 | 15% |
67 Properties |
| 2021 | £316,652 | 5% |
85 Properties |
| 2020 | £299,595 | 12% |
63 Properties |
| 2019 | £264,153 | -3% |
79 Properties |
| 2018 | £272,186 | 1% |
72 Properties |
| 2017 | £268,483 | 7% |
68 Properties |
| 2016 | £250,454 | 3% |
67 Properties |
| 2015 | £241,864 | 15% |
69 Properties |
| 2014 | £206,704 | 3% |
79 Properties |
| 2013 | £200,046 | -4% |
62 Properties |
| 2012 | £207,338 | 2% |
73 Properties |
| 2011 | £202,201 | 8% |
69 Properties |
| 2010 | £185,690 | 6% |
55 Properties |
| 2009 | £174,943 | -11% |
55 Properties |
| 2008 | £194,912 | -5% |
48 Properties |
| 2007 | £203,716 | 9% |
109 Properties |
| 2006 | £185,068 | 1% |
134 Properties |
| 2005 | £182,677 | 3% |
105 Properties |
| 2004 | £177,778 | 5% |
138 Properties |
| 2003 | £169,455 | 24% |
140 Properties |
| 2002 | £127,985 | 14% |
160 Properties |
| 2001 | £110,482 | 20% |
138 Properties |
| 2000 | £88,657 | 3% |
127 Properties |
| 1999 | £85,615 | 12% |
158 Properties |
| 1998 | £75,523 | 2% |
139 Properties |
| 1997 | £73,999 | 7% |
140 Properties |
| 1996 | £69,013 | 12% |
127 Properties |
| 1995 | £60,413 | - |
93 Properties |
Property Price per Property Type in West Hunsbury
Here you can find historic sold price data in order to help with your property search.
The average Property Paid Price for specific property types in the last three years are:
| Property Type | Average Sold Price | Sold Properties |
|---|---|---|
| Semi Detached House | £253,641.00 | 51 Semi Detached Houses |
| Detached House | £434,959.00 | 103 Detached Houses |
| Terraced House | £200,435.00 | 31 Terraced Houses |
| Flat | £118,687.00 | 4 Flats |

