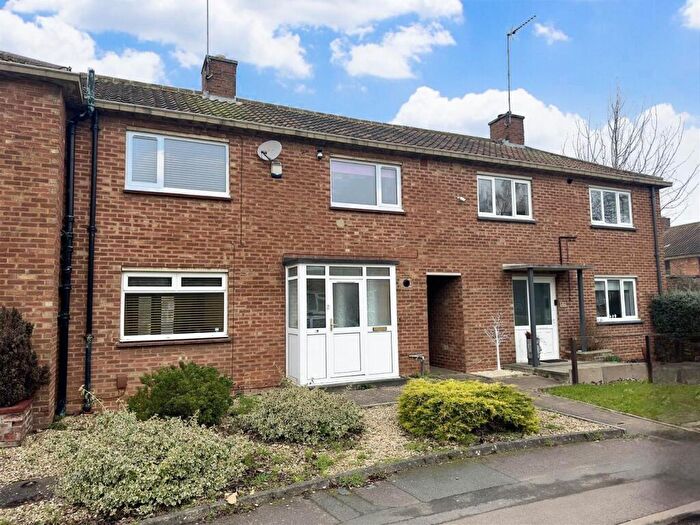
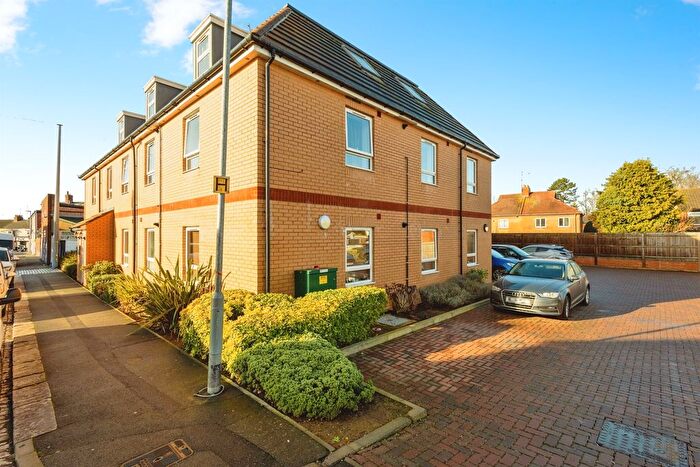
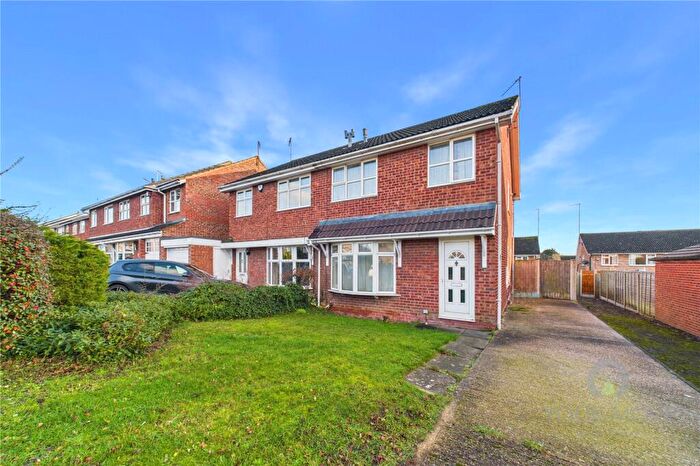
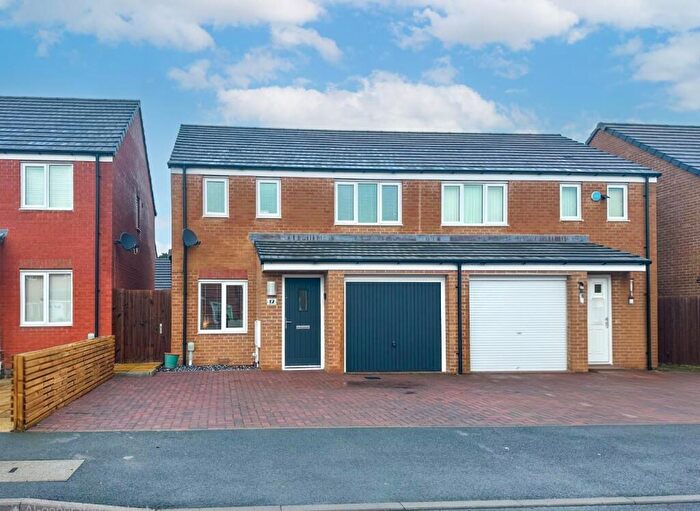
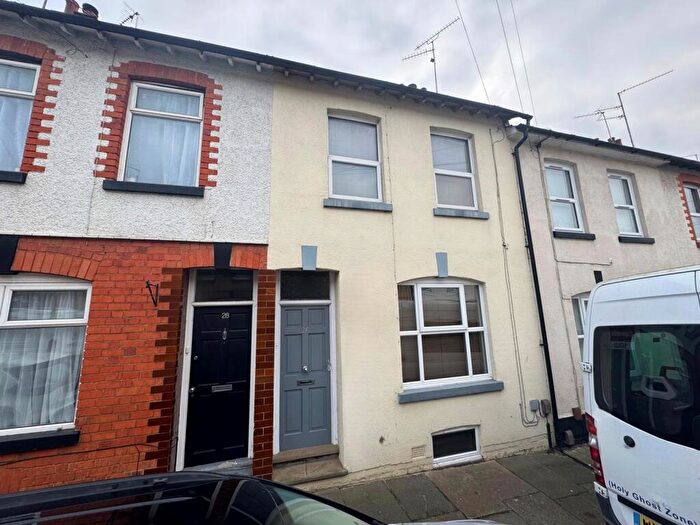
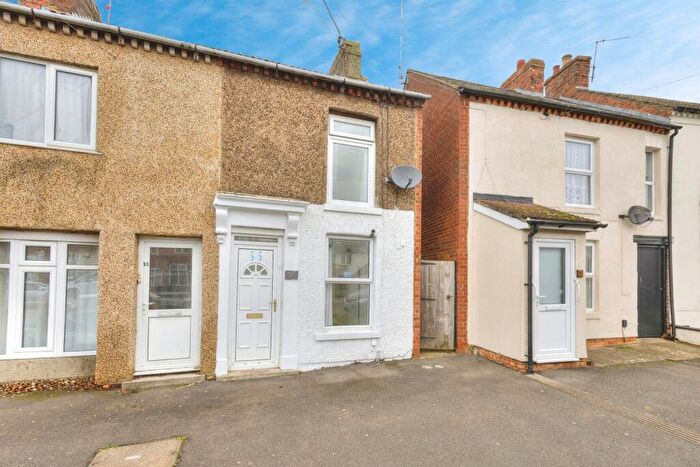
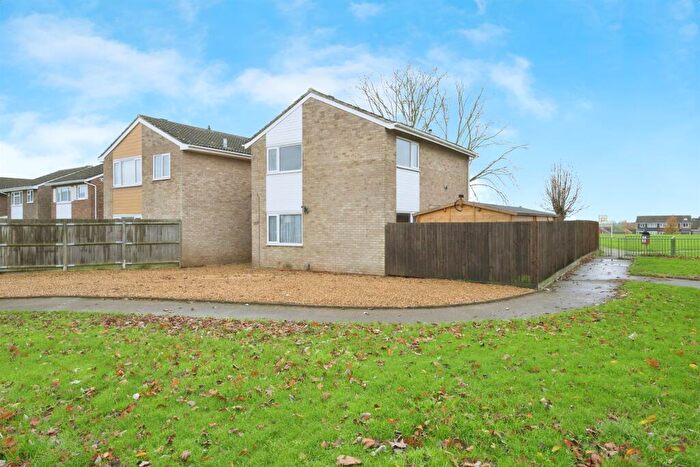
Houses for sale & to rent in Obelisk, Northampton
House Prices in Obelisk
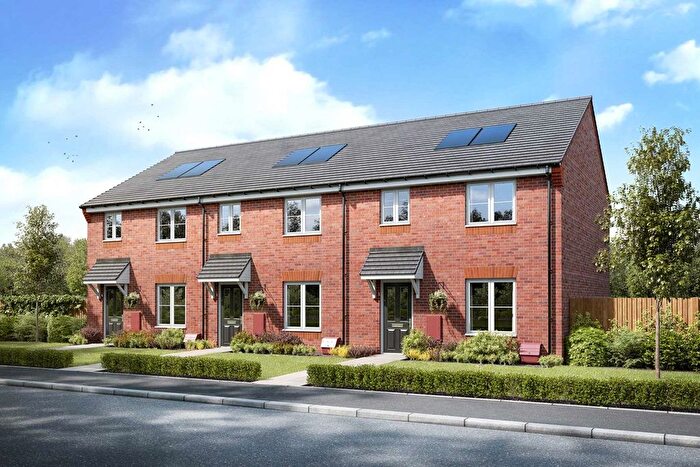
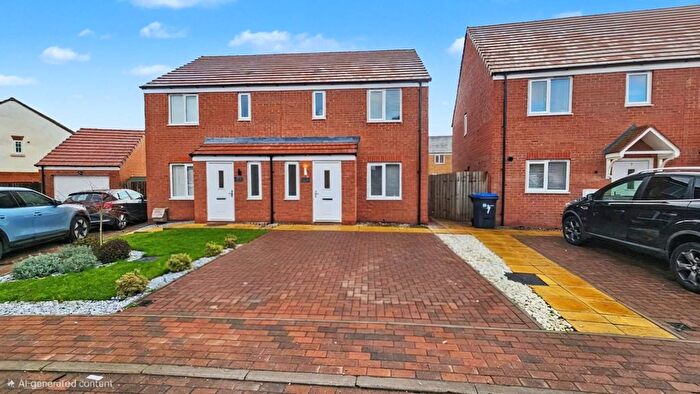
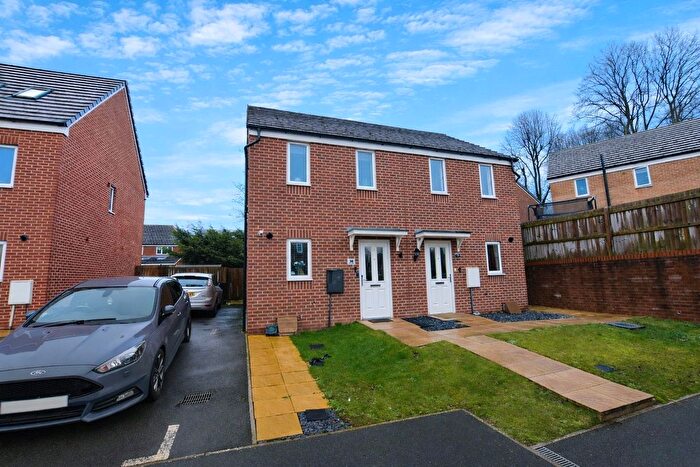
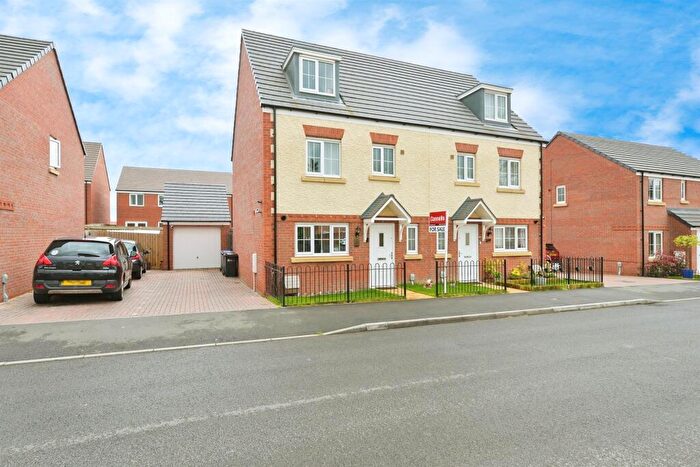
Properties in Obelisk have an average house price of £265,864.00 and had 126 Property Transactions within the last 3 years¹.
Obelisk is an area in Northampton, Northamptonshire with 1,120 households², where the most expensive property was sold for £395,000.00.
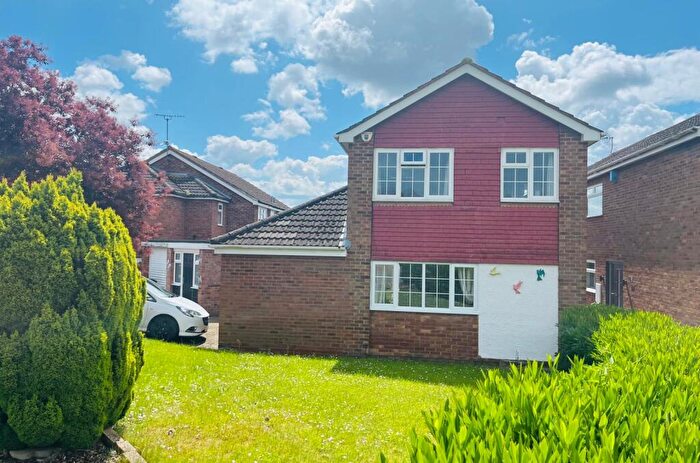
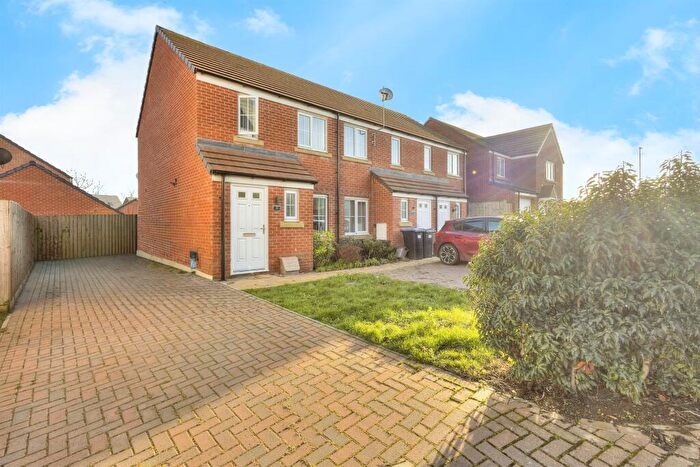
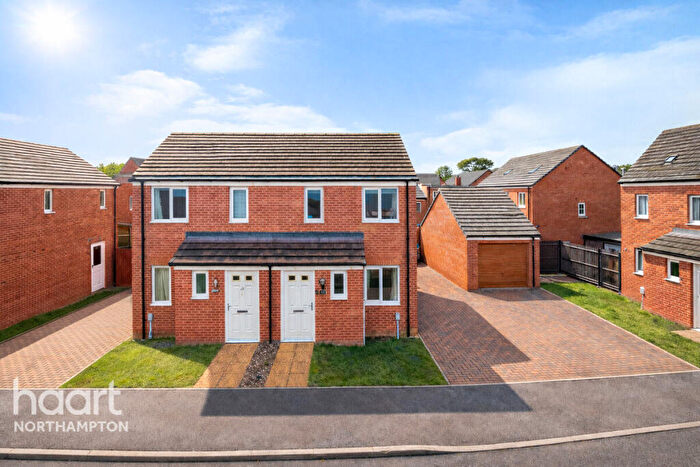
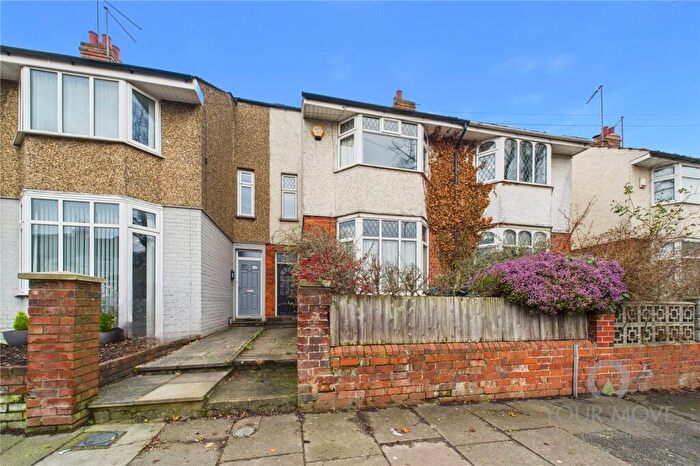
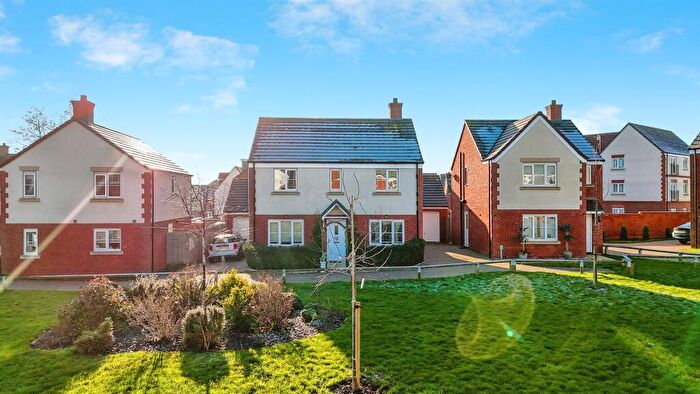
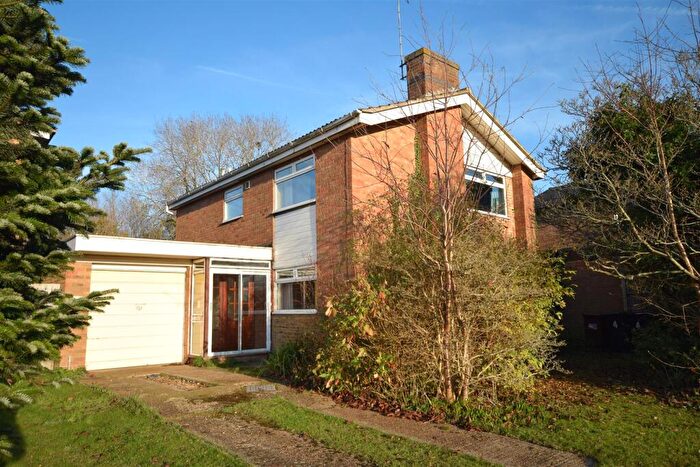
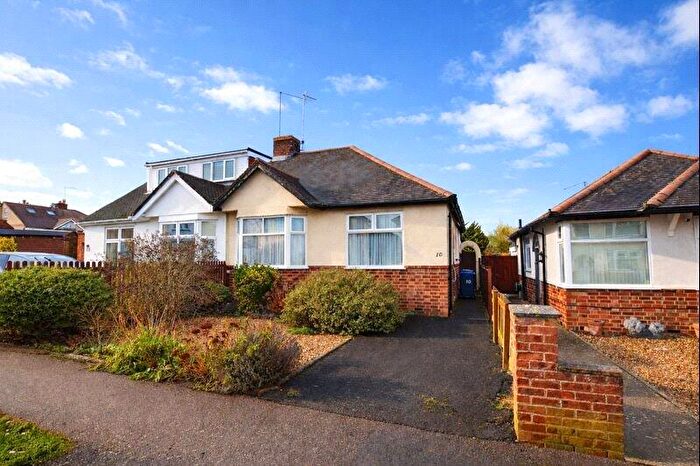
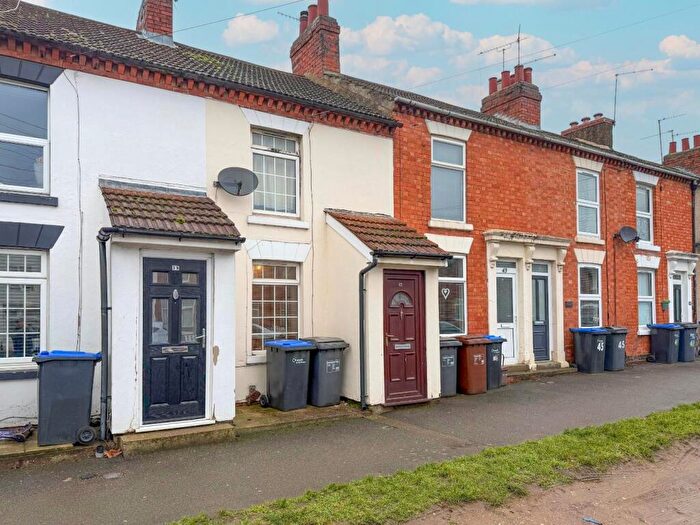
Properties for sale in Obelisk
Roads and Postcodes in Obelisk
Navigate through our locations to find the location of your next house in Obelisk, Northampton for sale or to rent.
| Streets | Postcodes |
|---|---|
| Boughton Green Road | NN2 7AN NN2 7AG NN2 7AJ NN2 7AH NN2 7AL |
| Ash Rise | NN2 8SB NN2 8ST |
| Ashton Way | NN2 7AR |
| Chancellor Court | NN2 7AP |
| Holly Lodge Drive | NN2 8QR |
| Hunters Close | NN2 8TH |
| Lamport Lane | NN2 7DW |
| Obelisk Rise | NN2 8QT NN2 8QU NN2 8SU NN2 8SX NN2 8SY NN2 8SZ NN2 8TG NN2 8TN NN2 8TP NN2 8TW NN2 8TX NN2 8TY NN2 8TZ NN2 8UA NN2 8UF NN2 8SA NN2 8UB |
| Reynard Way | NN2 8QS NN2 8QX NN2 8QY NN2 8TL NN2 8TQ |
| St Johns Avenue | NN2 8QZ NN2 8RU NN2 8SS NN2 8TJ |
| Sutton Close | NN2 8PJ |
| University Close | NN2 7EX |
| Westleigh Office Park | NN3 6BW |
Transport near Obelisk
- FAQ
- Price Paid By Year
- Property Type Price
Frequently asked questions about Obelisk
What is the average price for a property for sale in Obelisk?
The average price for a property for sale in Obelisk is £265,864. This amount is 7% lower than the average price in Northampton. There are 985 property listings for sale in Obelisk.
What streets have the most expensive properties for sale in Obelisk?
The streets with the most expensive properties for sale in Obelisk are Lamport Lane at an average of £299,166, Ash Rise at an average of £283,250 and Obelisk Rise at an average of £281,050.
What streets have the most affordable properties for sale in Obelisk?
The streets with the most affordable properties for sale in Obelisk are Hunters Close at an average of £97,000, University Close at an average of £108,000 and St Johns Avenue at an average of £224,071.
Which train stations are available in or near Obelisk?
Some of the train stations available in or near Obelisk are Northampton, Long Buckby and Wellingborough.
Property Price Paid in Obelisk by Year
The average sold property price by year was:
| Year | Average Sold Price | Price Change |
Sold Properties
|
|---|---|---|---|
| 2025 | £264,784 | -1% |
44 Properties |
| 2024 | £267,361 | 1% |
47 Properties |
| 2023 | £265,211 | -6% |
35 Properties |
| 2022 | £280,837 | 6% |
44 Properties |
| 2021 | £263,177 | 8% |
88 Properties |
| 2020 | £242,160 | 3% |
92 Properties |
| 2019 | £233,754 | 5% |
91 Properties |
| 2018 | £223,157 | 8% |
46 Properties |
| 2017 | £204,238 | 9% |
39 Properties |
| 2016 | £184,970 | 6% |
43 Properties |
| 2015 | £173,242 | 3% |
39 Properties |
| 2014 | £167,987 | 10% |
48 Properties |
| 2013 | £151,238 | -2% |
39 Properties |
| 2012 | £154,530 | 9% |
33 Properties |
| 2011 | £141,387 | 1% |
31 Properties |
| 2010 | £140,242 | 1% |
25 Properties |
| 2009 | £139,459 | -8% |
37 Properties |
| 2008 | £151,215 | -3% |
28 Properties |
| 2007 | £155,837 | 11% |
56 Properties |
| 2006 | £138,480 | -0,4% |
51 Properties |
| 2005 | £139,027 | 1% |
32 Properties |
| 2004 | £137,895 | 6% |
72 Properties |
| 2003 | £130,266 | 21% |
56 Properties |
| 2002 | £102,596 | 14% |
88 Properties |
| 2001 | £88,244 | 13% |
46 Properties |
| 2000 | £76,973 | 18% |
70 Properties |
| 1999 | £63,037 | 2% |
73 Properties |
| 1998 | £61,619 | -1% |
81 Properties |
| 1997 | £62,010 | 23% |
64 Properties |
| 1996 | £47,940 | -3% |
61 Properties |
| 1995 | £49,587 | - |
47 Properties |
Property Price per Property Type in Obelisk
Here you can find historic sold price data in order to help with your property search.
The average Property Paid Price for specific property types in the last three years are:
| Property Type | Average Sold Price | Sold Properties |
|---|---|---|
| Semi Detached House | £272,377.00 | 57 Semi Detached Houses |
| Detached House | £312,200.00 | 30 Detached Houses |
| Terraced House | £239,599.00 | 34 Terraced Houses |
| Flat | £92,200.00 | 5 Flats |

