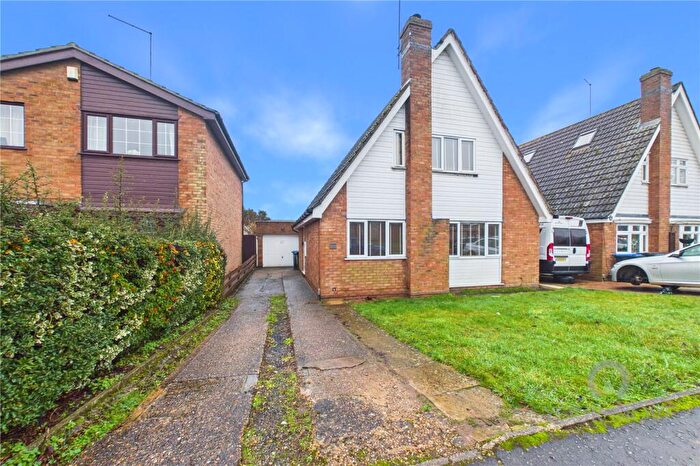
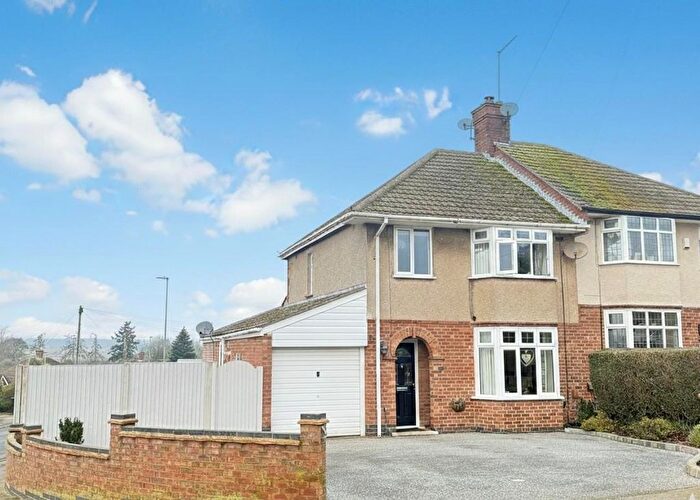
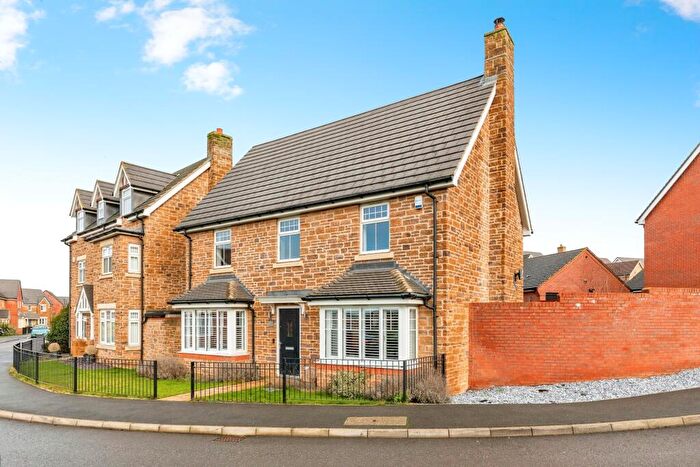
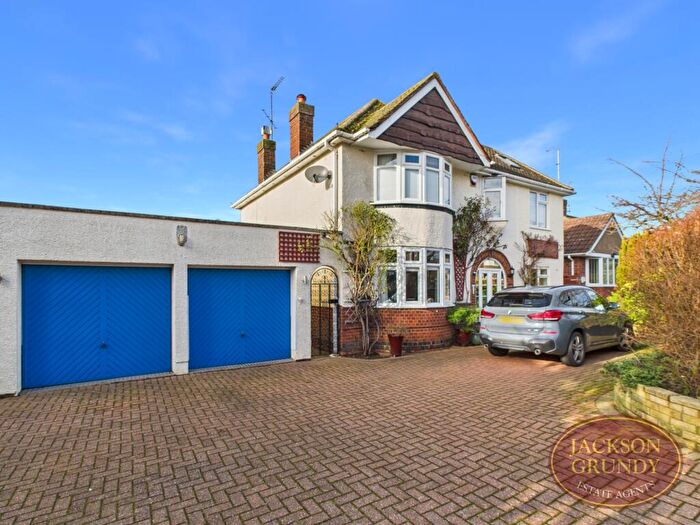
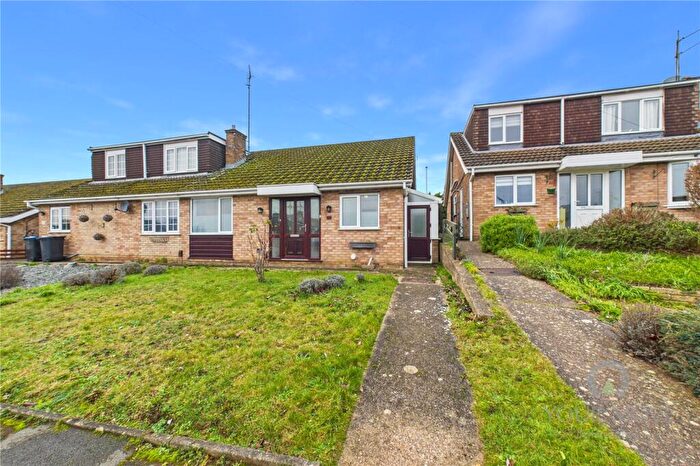
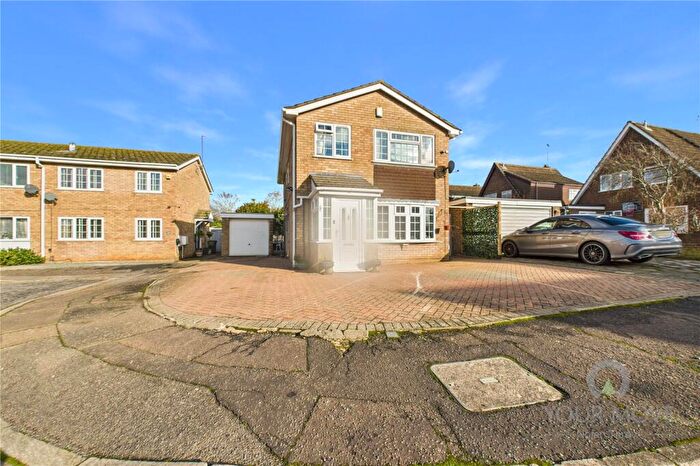
Houses for sale & to rent in Spring Park, Northampton
House Prices in Spring Park
Properties in Spring Park have an average house price of £285,304.00 and had 202 Property Transactions within the last 3 years¹.
Spring Park is an area in Northampton, Northamptonshire with 1,885 households², where the most expensive property was sold for £585,000.00.
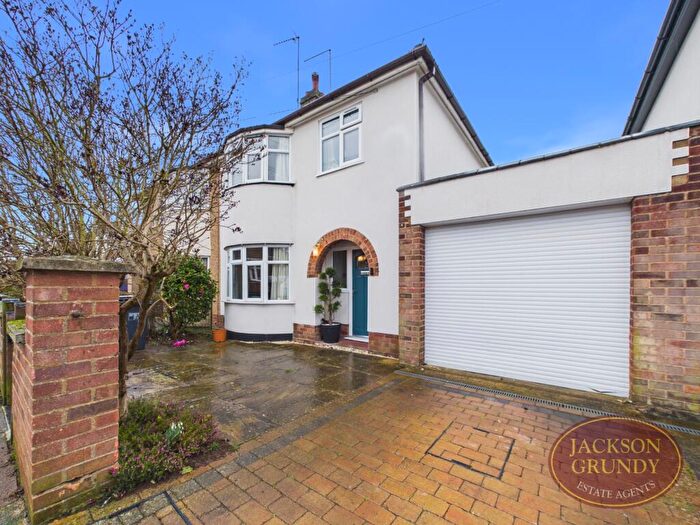
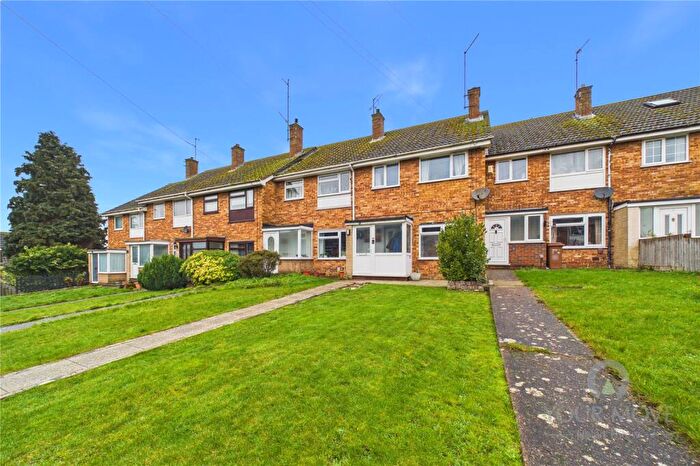
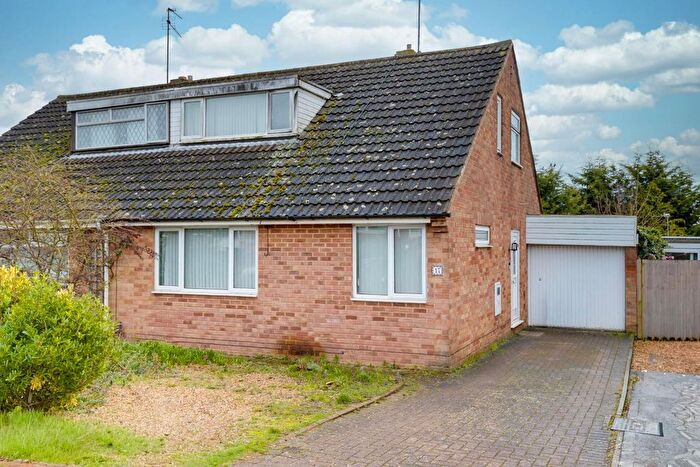
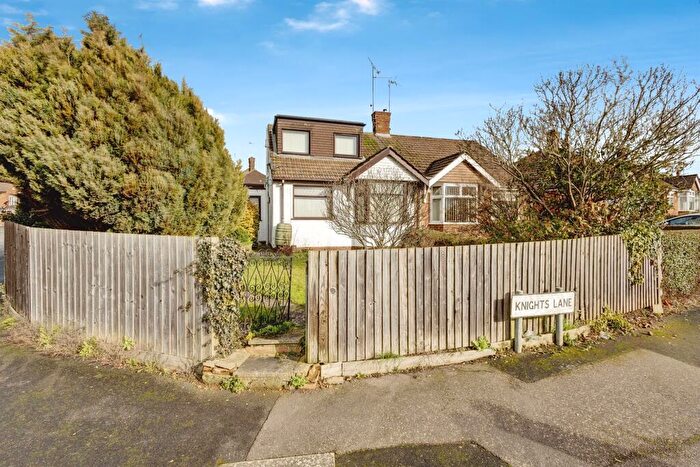
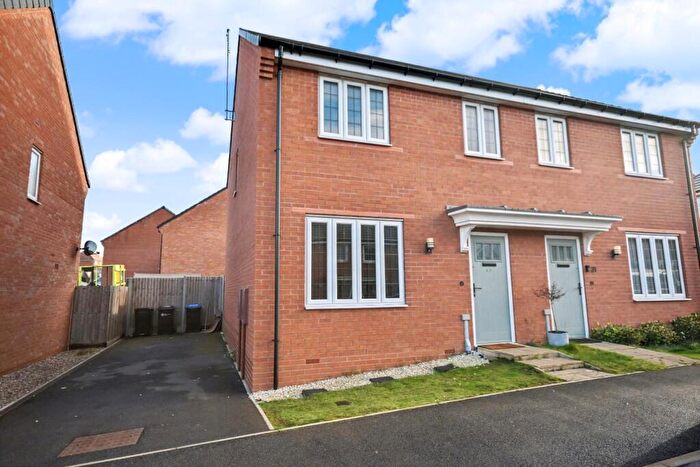
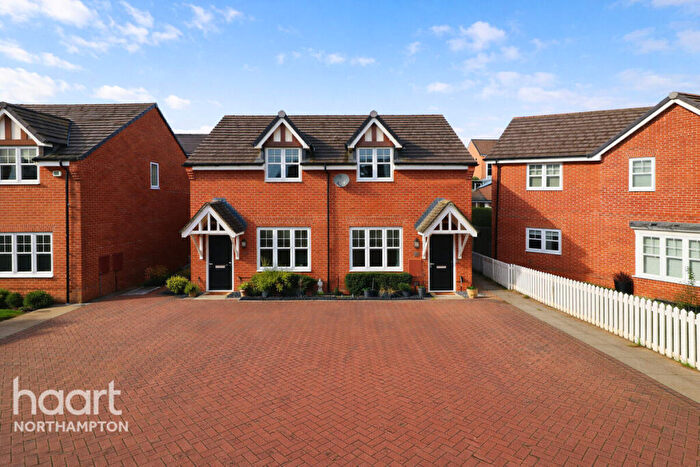
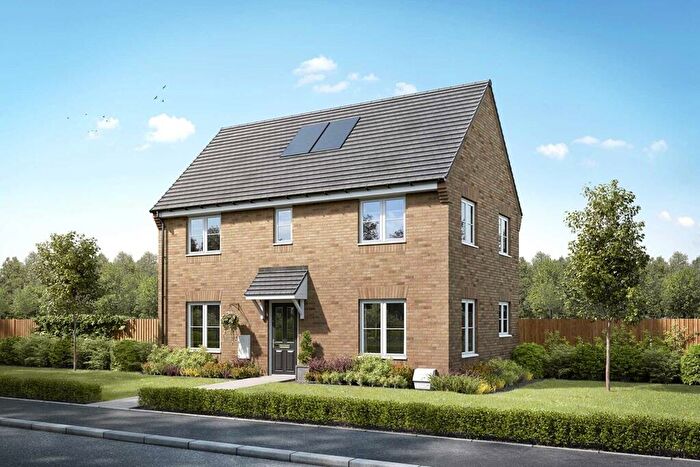
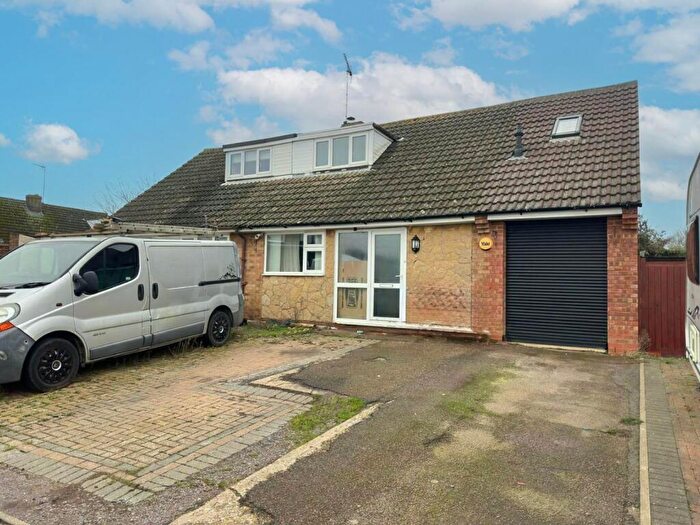
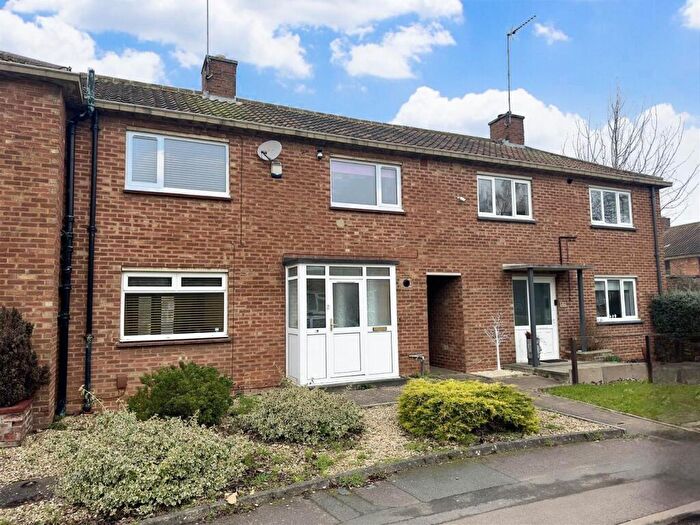
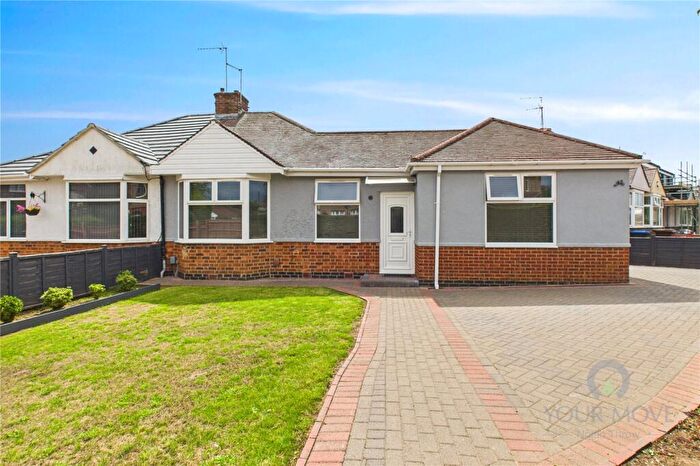
Properties for sale in Spring Park
Roads and Postcodes in Spring Park
Navigate through our locations to find the location of your next house in Spring Park, Northampton for sale or to rent.
| Streets | Postcodes |
|---|---|
| Acre Lane | NN2 8AS NN2 8BE NN2 8BG NN2 8BN NN2 8BU NN2 8DF NN2 8DX NN2 8DY NN2 8EJ NN2 8PY |
| Anchor Drive | NN2 8LN |
| Archers Close | NN2 8DA |
| Ash Grove | NN2 8DG |
| Badgers Walk | NN2 8AU |
| Barley Lane | NN2 8AT NN2 8AX NN2 8BD |
| Barnfield Close | NN2 8AW |
| Birch Barn Way | NN2 8DT NN2 8DU |
| Cedrus Court | NN2 8EU |
| Central Avenue | NN2 8DZ NN2 8EA |
| Clover Lane | NN2 8BT |
| Copse Close | NN2 8PX |
| Cornfield Close | NN2 8BS |
| Covert Close | NN2 8EH |
| Crawley Close | NN2 8BA |
| Drovers Walk | NN2 8BB |
| Edward Watson Close | NN2 8LP |
| Fair Mile | NN2 8DQ |
| Fairmead Rise | NN2 8PP |
| Fallow Walk | NN2 8DE |
| Farm Close | NN2 8AR |
| Gorse Close | NN2 8ED |
| Greenhills Close | NN2 8EN |
| Greenhills Road | NN2 8EE NN2 8EF NN2 8EL |
| Harborough Road | NN2 8LR NN2 8LT |
| Harborough Road North | NN2 8LS NN2 8LU NN2 8LL |
| Harrow Way | NN2 8TF |
| Harvest Way | NN2 8PU |
| Haycroft Walk | NN2 8BH |
| Hedgerow Drive | NN2 8BY |
| Henard Close | NN2 8FY |
| Hodder Street | NN2 8FW |
| Jenner Crescent | NN2 8NB NN2 8NF |
| Kingsmead | NN2 8HX |
| Link Road | NN2 8EQ |
| Lynton Avenue | NN2 8LX |
| Northfield Way | NN2 8AN |
| Osler Close | NN2 8NE |
| Partridge Close | NN2 8BL |
| Pasteur Close | NN2 8ND |
| Penfold Close | NN2 8AP NN2 8FT |
| Pheasant Way | NN2 8BJ |
| Plough Lane | NN2 8DB |
| Ploughmans Walk | NN2 8BP |
| Poachers Way | NN2 8AY |
| Rookery Lane | NN2 8BQ NN2 8BX |
| Sandhills Close | NN2 8EB |
| Sandhills Road | NN2 8ER |
| Shaw Close | NN2 8FX |
| Sherwood Avenue | NN2 8PZ NN2 8TA NN2 8TB NN2 8TD NN2 8TE |
| St Marks Crescent | NN2 8EG |
| Stubble Close | NN2 8DS |
| The Avenue | NN2 8PR |
| The Pastures | NN2 8DD |
| Tiverton Avenue | NN2 8LY |
| Turn Furlong | NN2 8BZ |
| Welford Road | NN2 8AL NN2 8PN NN2 8PS |
| Whitehills Crescent | NN2 8EP |
| Whitehills Way | NN2 8EW |
| Yeoman Drive | NN2 8AZ |
Transport near Spring Park
-
Northampton Station
-
Long Buckby Station
-
Wellingborough Station
-
Kettering Station
-
Market Harborough Station
-
Wolverton Station
- FAQ
- Price Paid By Year
- Property Type Price
Frequently asked questions about Spring Park
What is the average price for a property for sale in Spring Park?
The average price for a property for sale in Spring Park is £285,304. This amount is 0.59% lower than the average price in Northampton. There are 1,091 property listings for sale in Spring Park.
What streets have the most expensive properties for sale in Spring Park?
The streets with the most expensive properties for sale in Spring Park are Yeoman Drive at an average of £387,497, Tiverton Avenue at an average of £374,000 and Pasteur Close at an average of £372,500.
What streets have the most affordable properties for sale in Spring Park?
The streets with the most affordable properties for sale in Spring Park are Drovers Walk at an average of £180,000, Sandhills Close at an average of £196,250 and Penfold Close at an average of £196,743.
Which train stations are available in or near Spring Park?
Some of the train stations available in or near Spring Park are Northampton, Long Buckby and Wellingborough.
Property Price Paid in Spring Park by Year
The average sold property price by year was:
| Year | Average Sold Price | Price Change |
Sold Properties
|
|---|---|---|---|
| 2025 | £287,169 | 1% |
59 Properties |
| 2024 | £282,862 | -1% |
76 Properties |
| 2023 | £286,432 | -10% |
67 Properties |
| 2022 | £314,870 | 10% |
81 Properties |
| 2021 | £281,984 | 16% |
81 Properties |
| 2020 | £238,016 | -6% |
62 Properties |
| 2019 | £252,010 | -5% |
94 Properties |
| 2018 | £264,180 | 10% |
126 Properties |
| 2017 | £236,533 | 16% |
111 Properties |
| 2016 | £198,094 | 1% |
79 Properties |
| 2015 | £195,498 | 0,2% |
70 Properties |
| 2014 | £195,202 | 8% |
68 Properties |
| 2013 | £179,258 | 9% |
61 Properties |
| 2012 | £163,262 | 2% |
57 Properties |
| 2011 | £159,255 | 6% |
48 Properties |
| 2010 | £150,087 | -1% |
48 Properties |
| 2009 | £151,120 | -2% |
58 Properties |
| 2008 | £153,912 | -18% |
51 Properties |
| 2007 | £181,583 | 8% |
79 Properties |
| 2006 | £167,285 | 9% |
92 Properties |
| 2005 | £152,590 | -4% |
81 Properties |
| 2004 | £158,028 | 12% |
77 Properties |
| 2003 | £139,370 | 15% |
84 Properties |
| 2002 | £118,782 | 21% |
100 Properties |
| 2001 | £94,038 | 9% |
113 Properties |
| 2000 | £85,904 | 11% |
86 Properties |
| 1999 | £76,628 | 12% |
118 Properties |
| 1998 | £67,225 | 3% |
102 Properties |
| 1997 | £64,943 | 10% |
91 Properties |
| 1996 | £58,726 | 3% |
97 Properties |
| 1995 | £56,996 | - |
97 Properties |
Property Price per Property Type in Spring Park
Here you can find historic sold price data in order to help with your property search.
The average Property Paid Price for specific property types in the last three years are:
| Property Type | Average Sold Price | Sold Properties |
|---|---|---|
| Semi Detached House | £272,269.00 | 126 Semi Detached Houses |
| Detached House | £345,740.00 | 48 Detached Houses |
| Terraced House | £243,702.00 | 27 Terraced Houses |
| Flat | £150,000.00 | 1 Flat |

