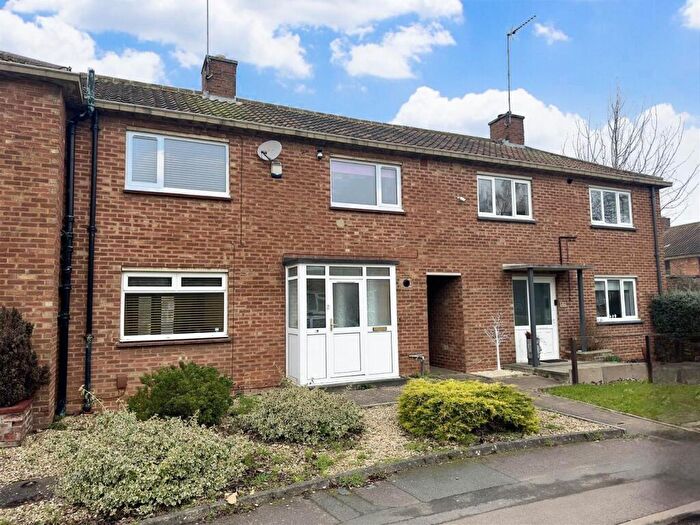
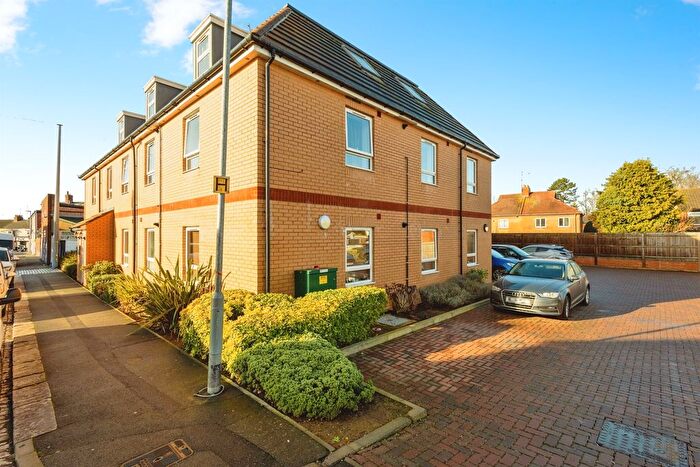
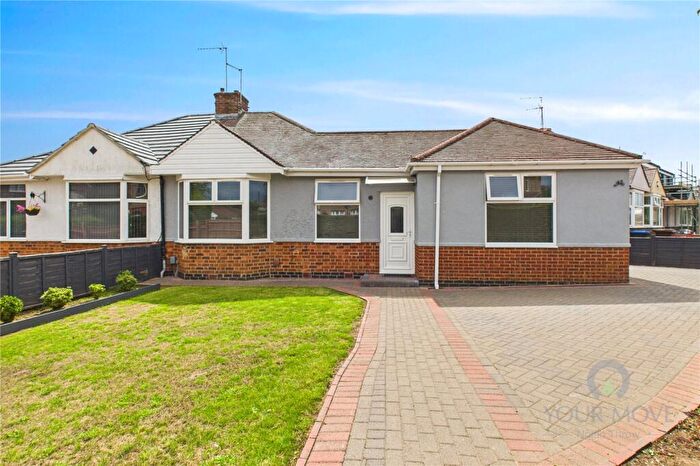
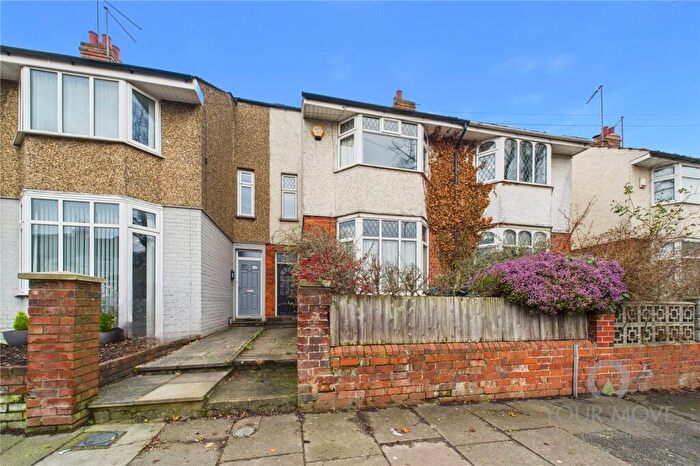
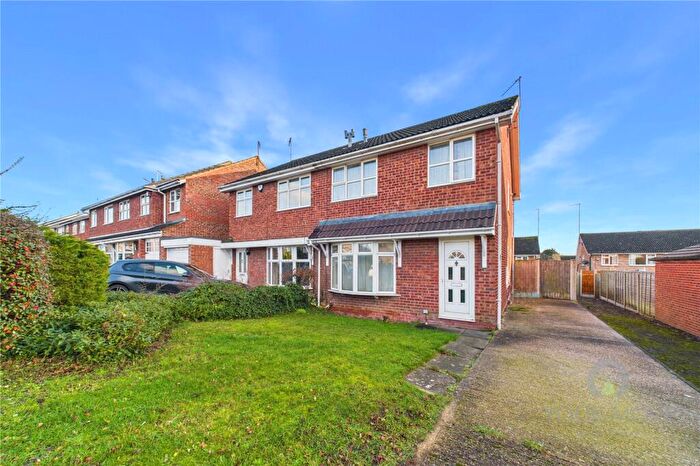
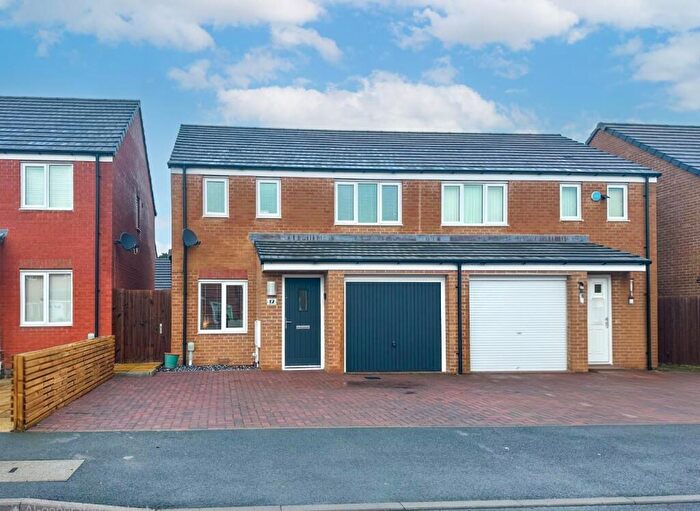
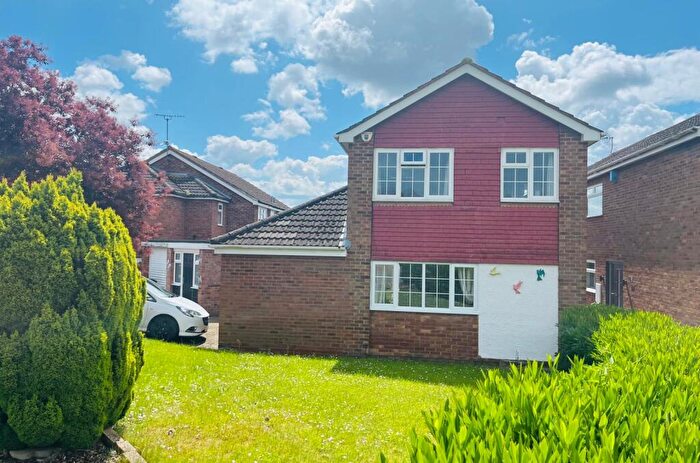
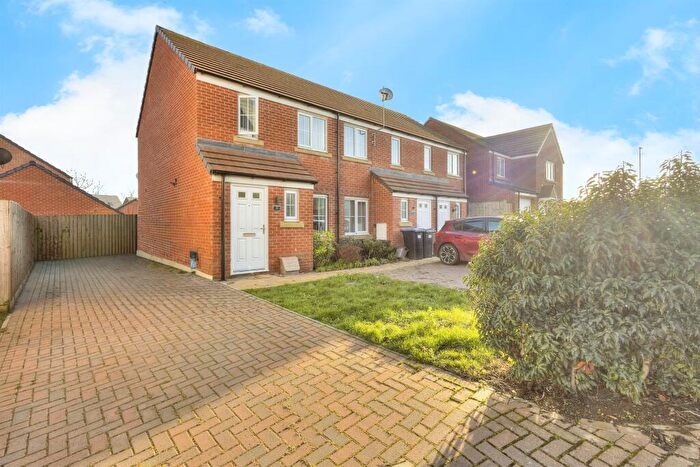
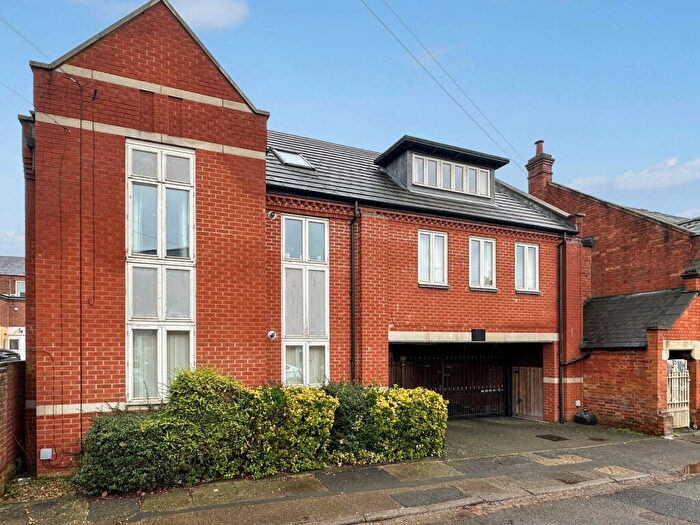
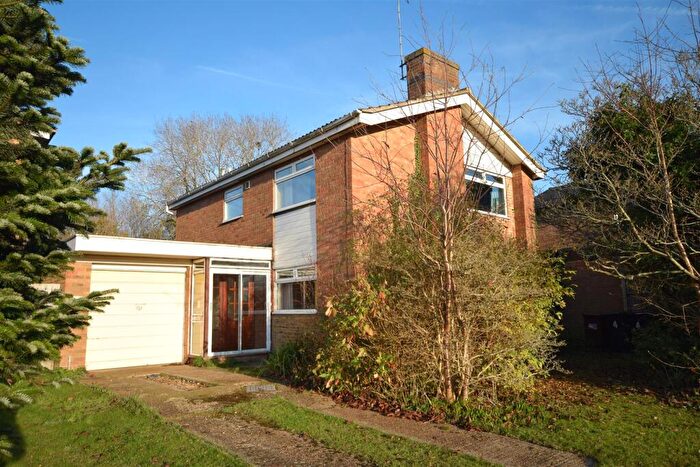
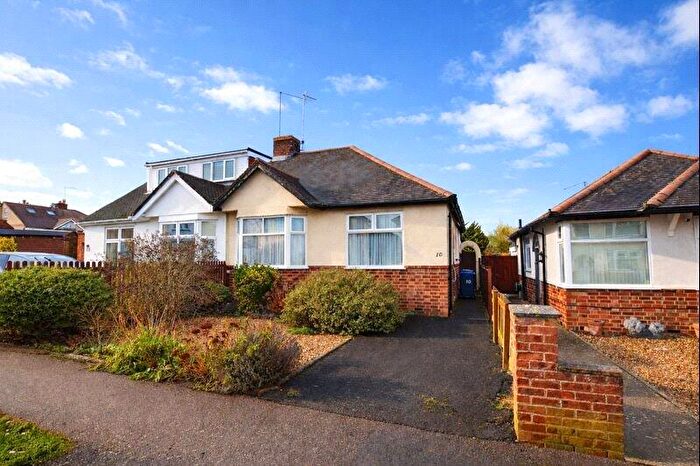
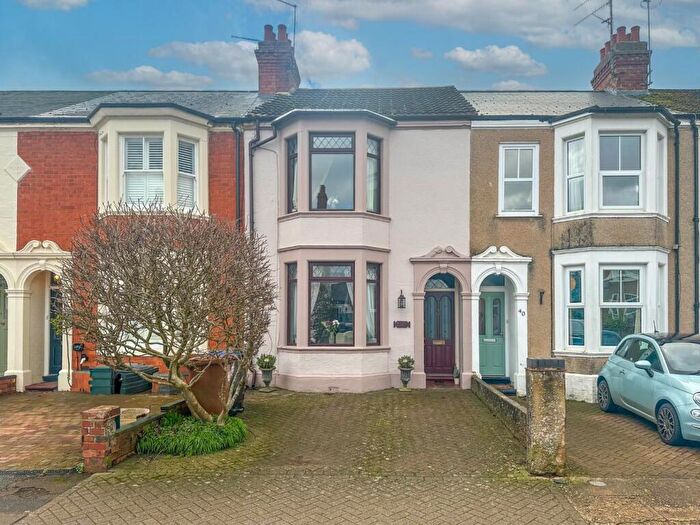
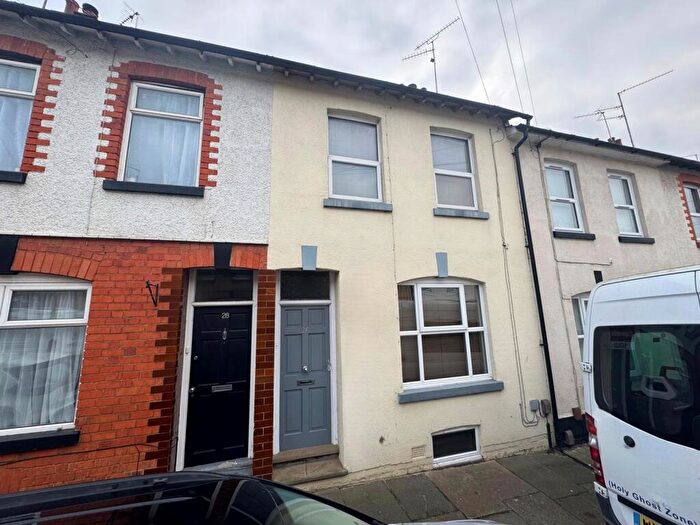
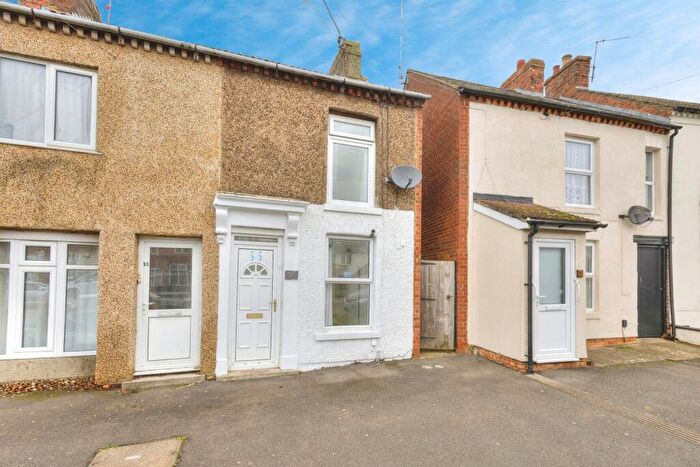
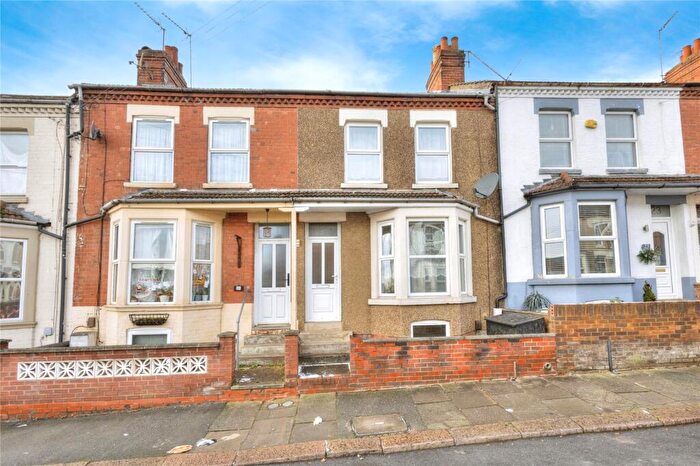
Houses for sale & to rent in Sunnyside, Northampton
House Prices in Sunnyside
Properties in Sunnyside have an average house price of £236,783.00 and had 198 Property Transactions within the last 3 years¹.
Sunnyside is an area in Northampton, Northamptonshire with 1,893 households², where the most expensive property was sold for £595,000.00.
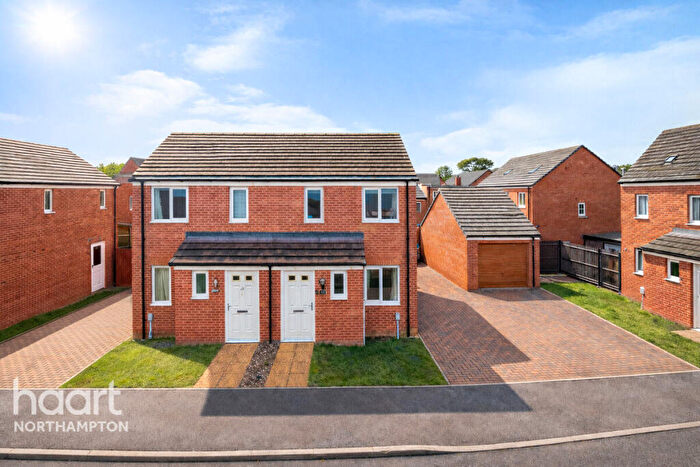
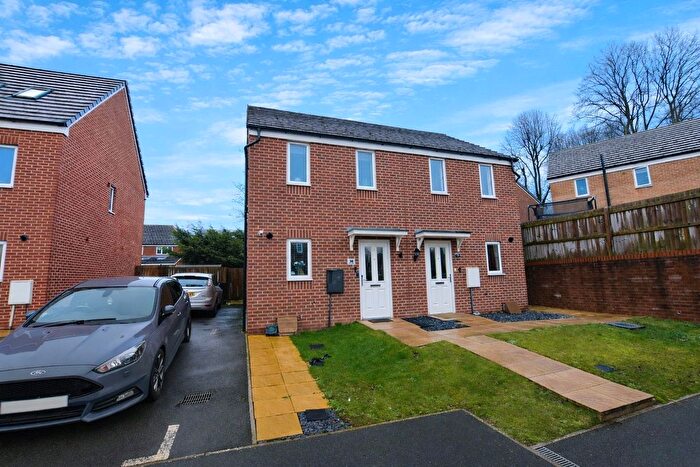
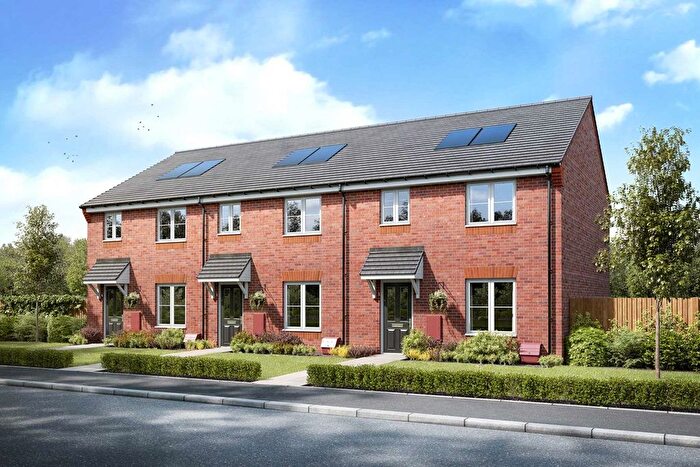
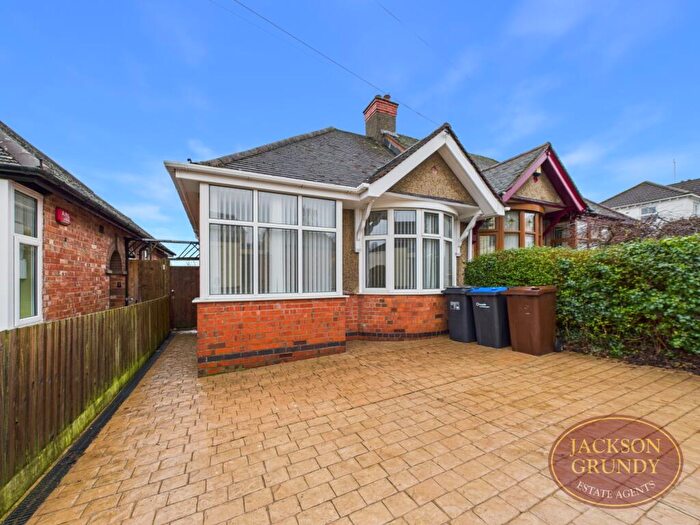
Properties for sale in Sunnyside
Roads and Postcodes in Sunnyside
Navigate through our locations to find the location of your next house in Sunnyside, Northampton for sale or to rent.
| Streets | Postcodes |
|---|---|
| Abthorpe Avenue | NN2 8NS |
| Alexandra Terrace | NN2 7SJ |
| Appledore Close | NN2 8JG |
| Appletree Gardens | NN2 8DN |
| Aynho Crescent | NN2 8JY NN2 8LF NN2 8LE |
| Aynho Walk | NN2 8JX NN2 8LJ |
| Bective Close | NN2 7FE NN2 7FF |
| Bective Road | NN2 7TB NN2 7TD |
| Bective View | NN2 7TE |
| Blakesley Close | NN2 8PA |
| Boughton Green Road | NN2 7AA NN2 7AB NN2 7AD NN2 7AF NN2 7SP NN2 7SR NN2 7SU NN2 7SW |
| Brackley Close | NN2 8NN |
| Bradden Close | NN2 8NW |
| Chadstone Avenue | NN2 8PG |
| Chalcombe Avenue | NN2 8JH NN2 8JQ NN2 8JZ NN2 8LA NN2 8LB NN2 8LD NN2 8LQ NN2 8JJ NN2 8LH |
| Chalcombe Road | NN2 8JD NN2 8JE |
| Charlton Close | NN2 8NY |
| Cosgrove Road | NN2 8JW |
| Cosgrove Way | NN2 8JP |
| Courteenhall Close | NN2 8PQ |
| Croughton Close | NN2 8NZ |
| Culworth Crescent | NN2 8NJ NN2 8NL |
| Evenley Road | NN2 8JR |
| Falcutt Way | NN2 8NR NN2 8PH |
| Glan Y Mor Terrace | NN2 8DP |
| Harborough Road | NN2 8DH NN2 8DJ NN2 8DL NN2 8DW NN2 7SL |
| Hartwell Close | NN2 8TT |
| Helmdon Crescent | NN2 8JS |
| Helmdon Road | NN2 8JT NN2 8JU |
| High Street | NN2 6QH |
| Hinton Close | NN2 8JN |
| Hinton Road | NN2 8NA NN2 8NG NN2 8NQ NN2 8NU NN2 8NX NN2 8JL |
| Isham Close | NN2 7AQ |
| Liddington Way | NN2 8DR |
| Lockwood Close | NN2 7SS |
| Mescalero | NN2 6PE |
| Mill Meadow | NN2 7BA NN2 7DR |
| Millside Close | NN2 7TR |
| Moreton Way | NN2 8PD |
| Newington Road | NN2 7TF |
| Pineham Avenue | NN2 8PF |
| Radstone Way | NN2 8NT |
| Ruskin Road | NN2 7SY NN2 7SZ NN2 7TA NN2 7TH |
| Silverstone Close | NN2 8NP |
| St Martins Close | NN2 8JF |
| The Close | NN2 7TW |
| Upton Close | NN2 8TS |
| Wallbeck Close | NN2 8BW NN2 8FD |
| Welford Road | NN2 8AG NN2 8FR |
| Whitfield Way | NN2 8LG |
| Whittlebury Close | NN2 8NH |
| Windmill Terrace | NN2 7AE |
| Yardley Drive | NN2 8PE |
| Yelvertoft Road | NN2 7TQ |
Transport near Sunnyside
- FAQ
- Price Paid By Year
- Property Type Price
Frequently asked questions about Sunnyside
What is the average price for a property for sale in Sunnyside?
The average price for a property for sale in Sunnyside is £236,783. This amount is 17% lower than the average price in Northampton. There are 1,695 property listings for sale in Sunnyside.
What streets have the most expensive properties for sale in Sunnyside?
The streets with the most expensive properties for sale in Sunnyside are Harborough Road at an average of £335,625, Whittlebury Close at an average of £330,000 and Chadstone Avenue at an average of £310,000.
What streets have the most affordable properties for sale in Sunnyside?
The streets with the most affordable properties for sale in Sunnyside are Welford Road at an average of £172,681, Bective Road at an average of £173,250 and Wallbeck Close at an average of £175,000.
Which train stations are available in or near Sunnyside?
Some of the train stations available in or near Sunnyside are Northampton, Long Buckby and Wellingborough.
Property Price Paid in Sunnyside by Year
The average sold property price by year was:
| Year | Average Sold Price | Price Change |
Sold Properties
|
|---|---|---|---|
| 2025 | £234,246 | 1% |
55 Properties |
| 2024 | £232,095 | -5% |
76 Properties |
| 2023 | £244,182 | -2% |
67 Properties |
| 2022 | £248,074 | 4% |
75 Properties |
| 2021 | £238,311 | 18% |
122 Properties |
| 2020 | £196,591 | 3% |
56 Properties |
| 2019 | £191,114 | -7% |
90 Properties |
| 2018 | £204,675 | 2% |
118 Properties |
| 2017 | £200,162 | 14% |
98 Properties |
| 2016 | £172,828 | 2% |
173 Properties |
| 2015 | £169,689 | 10% |
85 Properties |
| 2014 | £151,994 | 13% |
64 Properties |
| 2013 | £132,844 | -7% |
70 Properties |
| 2012 | £142,125 | 4% |
49 Properties |
| 2011 | £136,860 | 1% |
44 Properties |
| 2010 | £135,741 | 13% |
53 Properties |
| 2009 | £118,064 | -28% |
54 Properties |
| 2008 | £151,080 | 4% |
55 Properties |
| 2007 | £145,576 | 6% |
98 Properties |
| 2006 | £136,821 | 3% |
105 Properties |
| 2005 | £133,169 | -13% |
81 Properties |
| 2004 | £150,051 | 23% |
125 Properties |
| 2003 | £115,977 | 20% |
103 Properties |
| 2002 | £92,539 | 9% |
149 Properties |
| 2001 | £84,588 | 21% |
103 Properties |
| 2000 | £66,646 | 6% |
91 Properties |
| 1999 | £62,846 | 1% |
115 Properties |
| 1998 | £62,006 | 5% |
108 Properties |
| 1997 | £58,966 | 19% |
111 Properties |
| 1996 | £47,987 | 7% |
87 Properties |
| 1995 | £44,793 | - |
80 Properties |
Property Price per Property Type in Sunnyside
Here you can find historic sold price data in order to help with your property search.
The average Property Paid Price for specific property types in the last three years are:
| Property Type | Average Sold Price | Sold Properties |
|---|---|---|
| Semi Detached House | £241,555.00 | 78 Semi Detached Houses |
| Detached House | £332,983.00 | 31 Detached Houses |
| Terraced House | £214,135.00 | 68 Terraced Houses |
| Flat | £150,380.00 | 21 Flats |

