Houses for sale & to rent in Park, Northampton
House Prices in Park
Properties in Park have an average house price of £493,160.00 and had 227 Property Transactions within the last 3 years¹.
Park is an area in Northampton, Northamptonshire with 1,825 households², where the most expensive property was sold for £6,120,119.00.
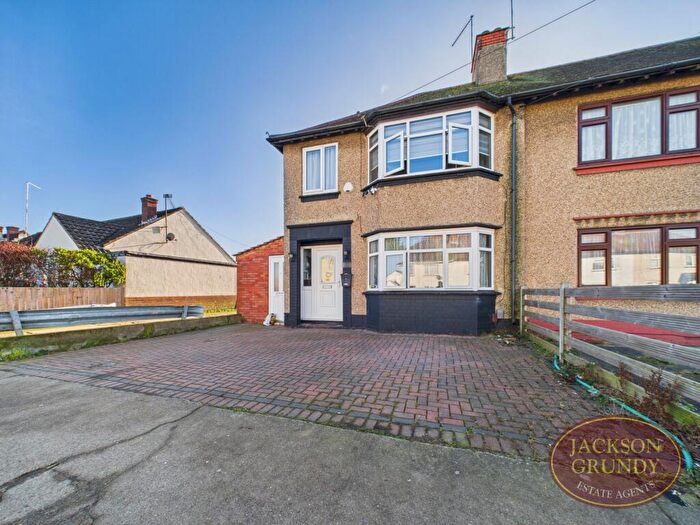
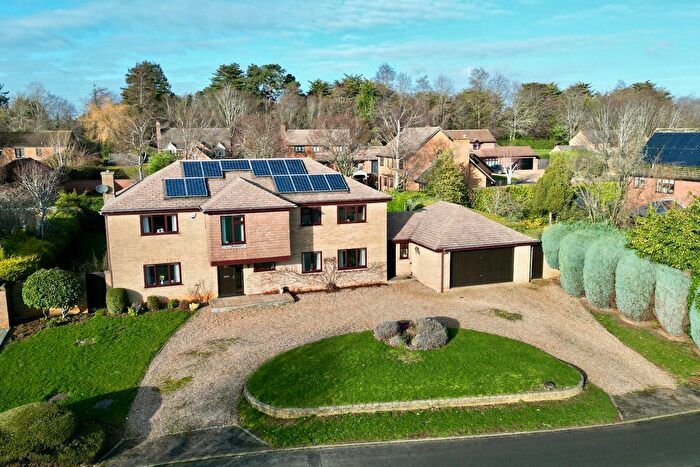
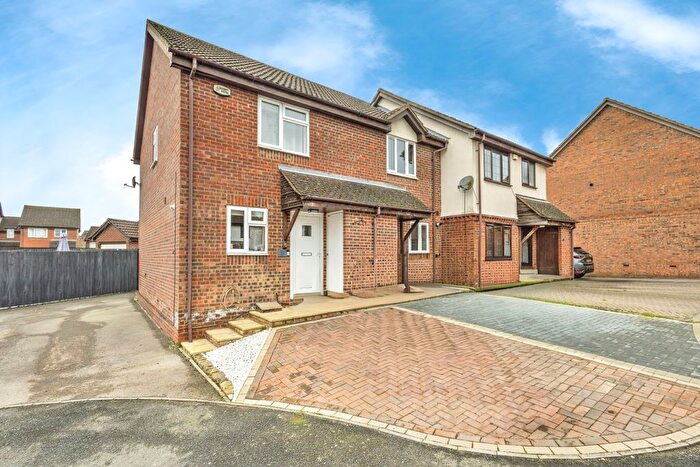
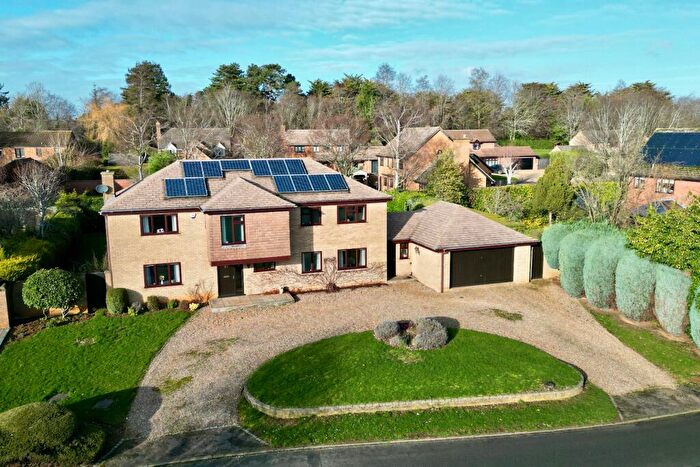
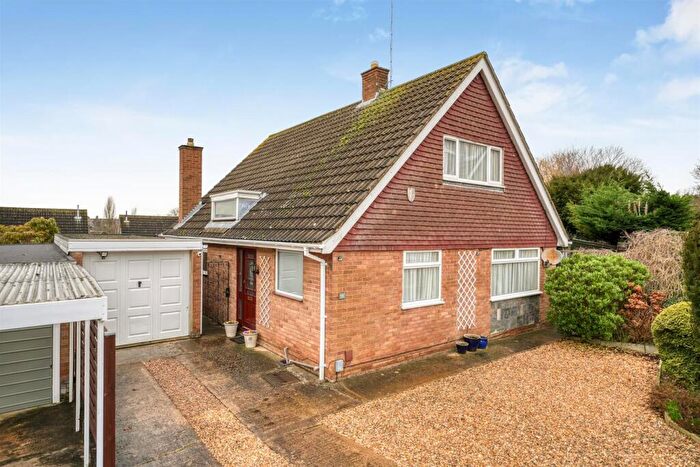
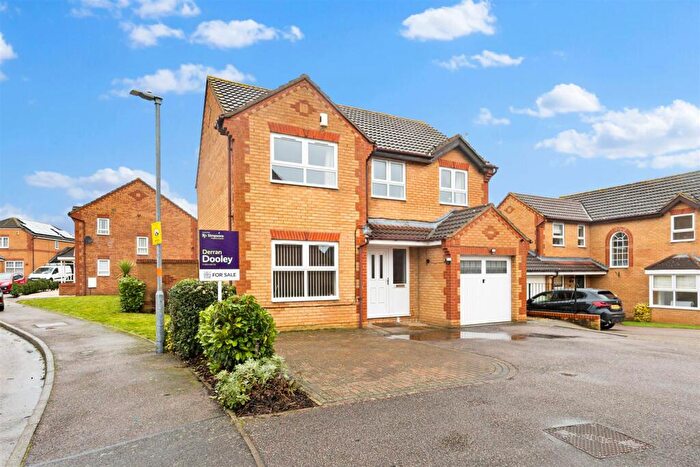
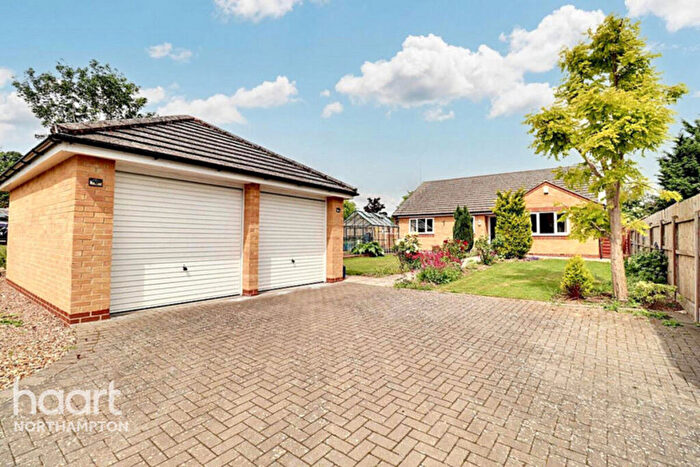
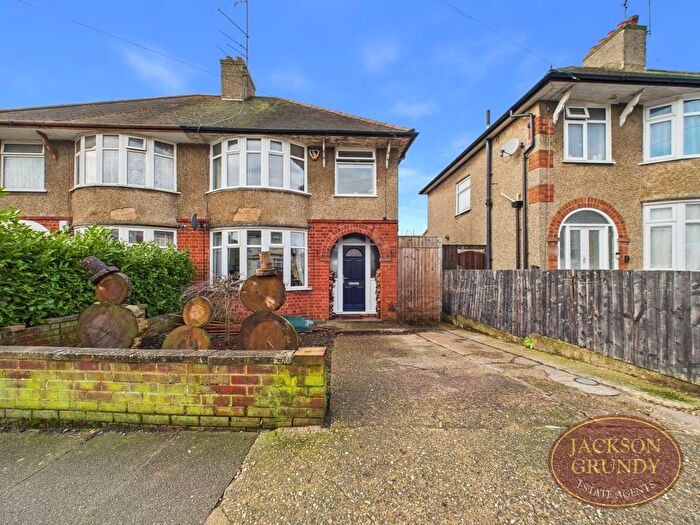
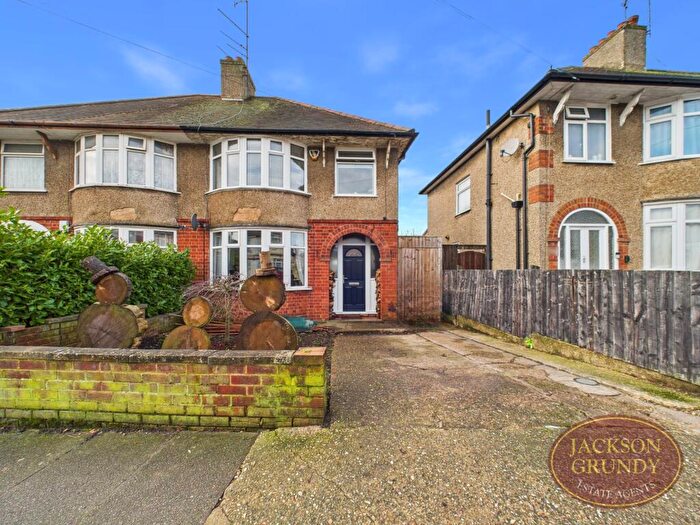
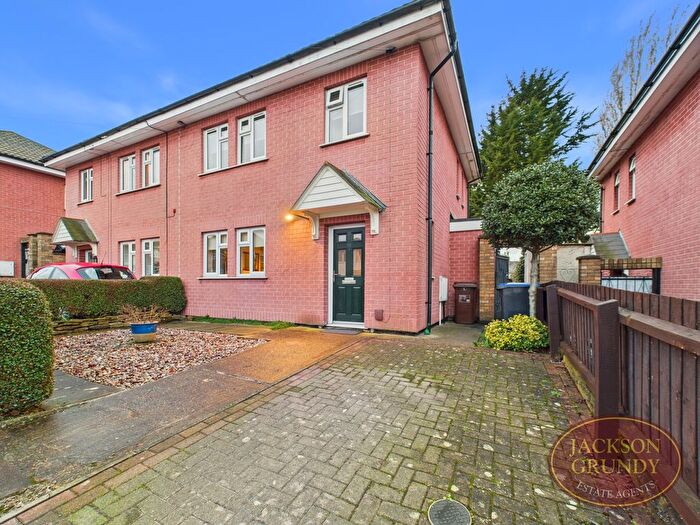
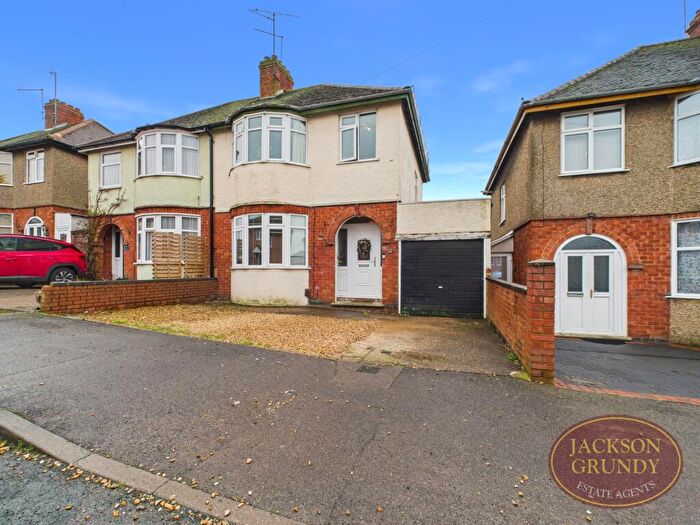
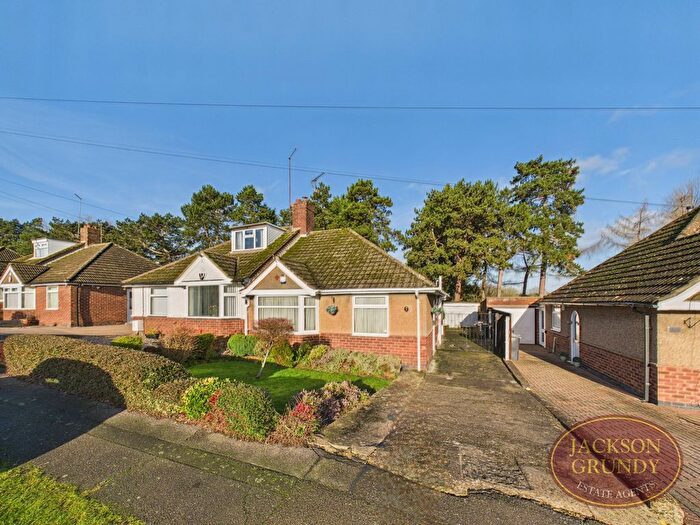
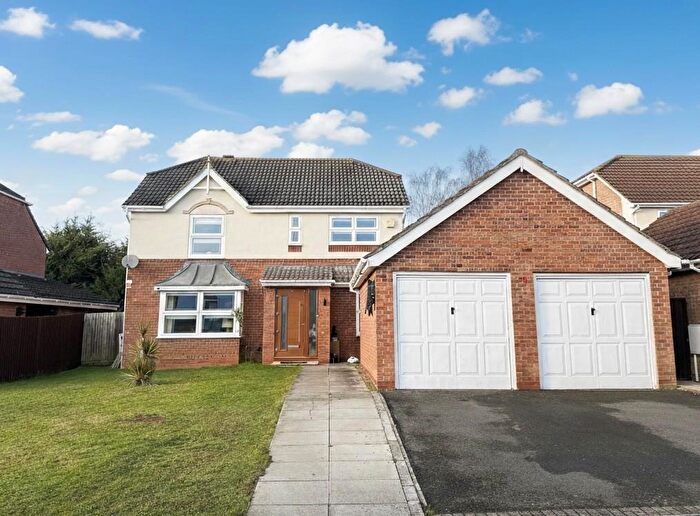
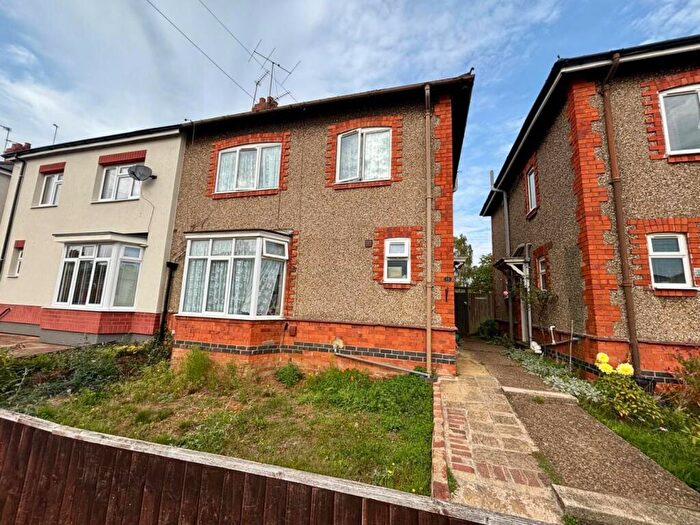
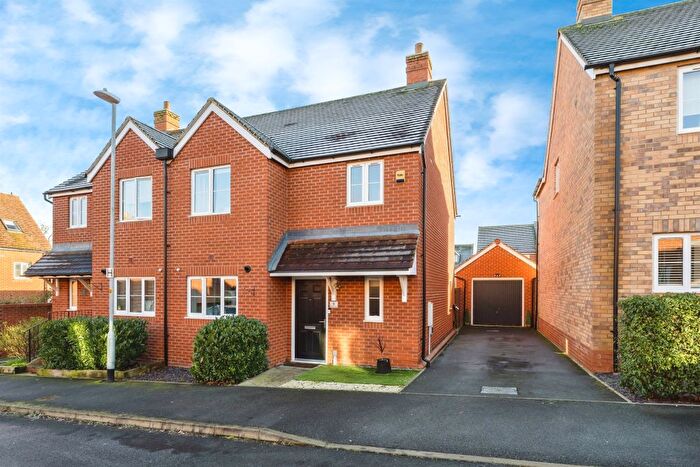
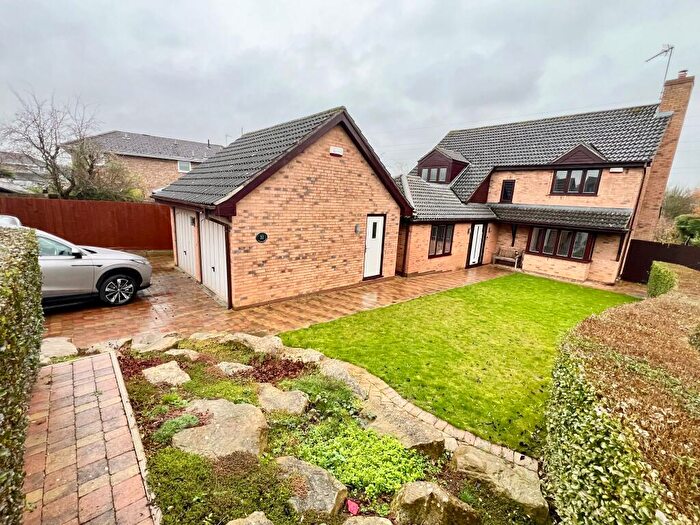
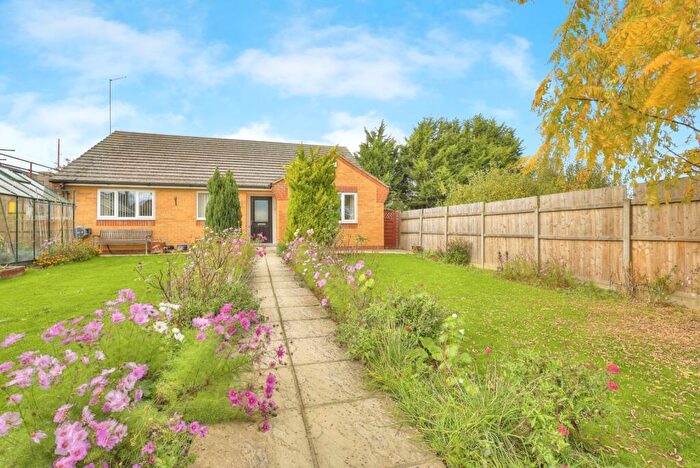
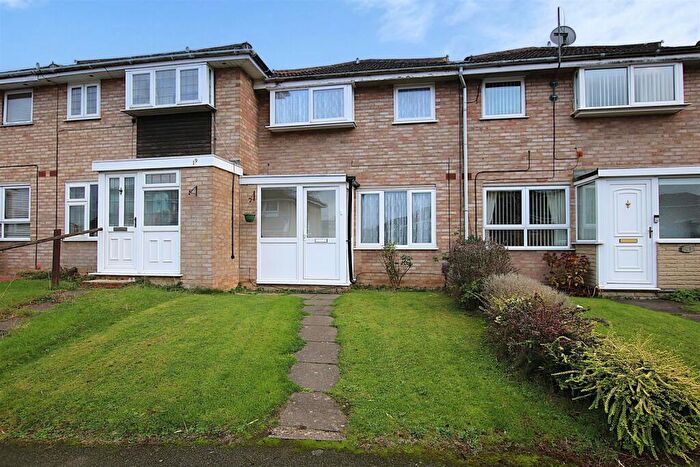
Properties for sale in Park
Roads and Postcodes in Park
Navigate through our locations to find the location of your next house in Park, Northampton for sale or to rent.
| Streets | Postcodes |
|---|---|
| Abington Park Crescent | NN3 3AD NN3 3AL |
| Ashford Close | NN3 3NQ |
| Barnstaple Close | NN3 3BH |
| Bideford Close | NN3 3AY |
| Billing Road East | NN3 3LG NN3 3LL |
| Brayford Close | NN3 3LU |
| Brendon Close | NN3 3AQ |
| Bridgewater Drive | NN3 3AF NN3 3AG NN3 3BB |
| Burtram Close | NN3 3PH |
| Calstock Close | NN3 3BA |
| Chelfham Close | NN3 3AH |
| Chulmleigh Walk | NN3 3LP |
| Church Way | NN3 3BQ NN3 3BT NN3 3BX NN3 3BY NN3 3EN |
| Clumber Drive | NN3 3NX |
| Crediton Close | NN3 3AJ |
| Donovan Court | NN3 3DD |
| Draycott Close | NN3 3BD |
| Dulverton Road | NN3 3AZ |
| Edgemont Road | NN3 3DF NN3 3PQ |
| Edwinstowe Close | NN3 3NW |
| Ellis Way | NN3 3BF |
| Exmoor Close | NN3 3AU |
| Favell Way | NN3 3BZ |
| Filleigh Way | NN3 3LZ |
| Gable Court Mews | NN3 3NS |
| Graspin Lane | NN3 3BU |
| Greenway | NN3 3BW |
| High Street | NN3 3JS NN3 3JW NN3 3JX |
| Hillside Way | NN3 3AW |
| Holmfield Way | NN3 3BJ |
| Holte End | NN3 3FD |
| Holyoak Terrace | NN3 3JP |
| Huntsham Close | NN3 3AX |
| Jesslyn Close | NN3 3FB |
| Kestrel Close | NN3 3JG |
| Knowle Close | NN3 3LW |
| Landcross Drive | NN3 3LN NN3 3LR NN3 3LS NN3 3NA NN3 3NB NN3 3NJ |
| Lynmouth Avenue | NN3 3LT |
| Maclean Close | NN3 3DJ |
| Marwood Close | NN3 3NE |
| Meadway | NN3 3BP |
| Meshaw Crescent | NN3 3NF NN3 3NG |
| Milverton Crescent | NN3 3AT |
| Mountclair Court | NN3 3DG |
| Naomi Close | NN3 3PG |
| Neale Close | NN3 3DB |
| Nesbitt Close | NN3 3DQ |
| Park Way | NN3 3BS |
| Parracombe Way | NN3 3ND |
| Patterson Close | NN3 3PE |
| Princess Close | NN3 3NR |
| Pyket Way | NN3 3JU |
| Ridgeway | NN3 3AN NN3 3AP NN3 3AR |
| Rixon Close | NN3 3PF |
| Rowlandson Close | NN3 3PB |
| Ruddington Close | NN3 3NZ |
| Rufford Avenue | NN3 3NY |
| Seedfield Close | NN3 3PA |
| St Christophers Home | NN3 3AE |
| St Peters Gardens | NN3 3JT |
| Taborley Close | NN3 3PJ |
| Taunton Avenue | NN3 3LX NN3 3LY |
| The Archway | NN3 3HP |
| The Mews | NN3 3JZ |
| The Smithy | NN3 3PL |
| Thorburn Road | NN3 3DA |
| Trinity Road | NN3 3FA |
| Wellingborough Road | NN3 3HX NN3 3HY NN3 3HZ NN3 3JA NN3 3JB |
| Westcott Way | NN3 3BE |
| Weston Way | NN3 3BL NN3 3BN |
| Williton Close | NN3 3BG |
| Winsford Way | NN3 3AS |
Transport near Park
- FAQ
- Price Paid By Year
- Property Type Price
Frequently asked questions about Park
What is the average price for a property for sale in Park?
The average price for a property for sale in Park is £493,160. This amount is 72% higher than the average price in Northampton. There are 926 property listings for sale in Park.
What streets have the most expensive properties for sale in Park?
The streets with the most expensive properties for sale in Park are St Peters Gardens at an average of £2,256,706, Church Way at an average of £1,140,462 and Mountclair Court at an average of £775,000.
What streets have the most affordable properties for sale in Park?
The streets with the most affordable properties for sale in Park are Gable Court Mews at an average of £237,000, Meshaw Crescent at an average of £247,890 and Chulmleigh Walk at an average of £250,900.
Which train stations are available in or near Park?
Some of the train stations available in or near Park are Northampton, Wellingborough and Long Buckby.
Property Price Paid in Park by Year
The average sold property price by year was:
| Year | Average Sold Price | Price Change |
Sold Properties
|
|---|---|---|---|
| 2025 | £418,956 | 5% |
62 Properties |
| 2024 | £396,147 | -74% |
95 Properties |
| 2023 | £690,545 | 38% |
70 Properties |
| 2022 | £427,221 | 8% |
91 Properties |
| 2021 | £392,135 | 8% |
94 Properties |
| 2020 | £360,509 | 3% |
68 Properties |
| 2019 | £350,920 | -1% |
86 Properties |
| 2018 | £354,692 | -1% |
80 Properties |
| 2017 | £359,781 | 9% |
78 Properties |
| 2016 | £328,518 | 7% |
110 Properties |
| 2015 | £306,290 | 11% |
107 Properties |
| 2014 | £271,250 | 5% |
110 Properties |
| 2013 | £256,912 | -8% |
65 Properties |
| 2012 | £276,291 | 4% |
60 Properties |
| 2011 | £266,557 | 15% |
52 Properties |
| 2010 | £227,171 | -8% |
70 Properties |
| 2009 | £244,587 | -10% |
69 Properties |
| 2008 | £268,871 | 0,4% |
43 Properties |
| 2007 | £267,682 | 4% |
78 Properties |
| 2006 | £256,561 | 7% |
94 Properties |
| 2005 | £239,215 | 2% |
69 Properties |
| 2004 | £233,623 | 13% |
89 Properties |
| 2003 | £202,453 | 16% |
73 Properties |
| 2002 | £169,479 | -6% |
85 Properties |
| 2001 | £179,438 | 15% |
86 Properties |
| 2000 | £152,935 | 24% |
75 Properties |
| 1999 | £116,299 | -0,4% |
83 Properties |
| 1998 | £116,753 | 4% |
83 Properties |
| 1997 | £111,590 | 20% |
68 Properties |
| 1996 | £88,925 | 8% |
85 Properties |
| 1995 | £81,965 | - |
76 Properties |
Property Price per Property Type in Park
Here you can find historic sold price data in order to help with your property search.
The average Property Paid Price for specific property types in the last three years are:
| Property Type | Average Sold Price | Sold Properties |
|---|---|---|
| Semi Detached House | £467,599.00 | 88 Semi Detached Houses |
| Detached House | £610,477.00 | 103 Detached Houses |
| Terraced House | £291,399.00 | 15 Terraced Houses |
| Flat | £168,976.00 | 21 Flats |

