Houses for sale & to rent in Trinity, Northampton
House Prices in Trinity
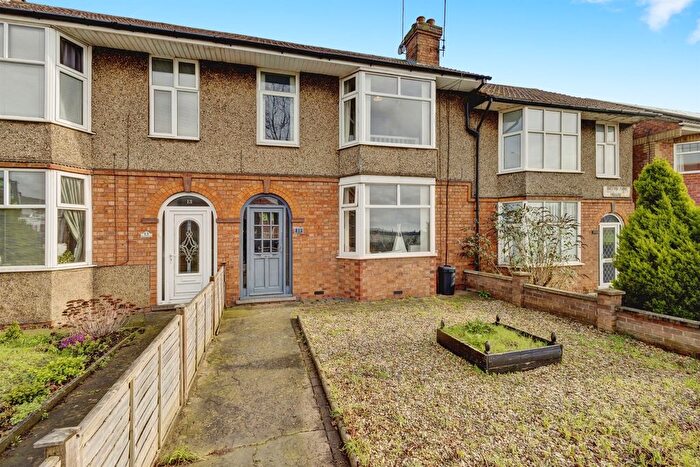
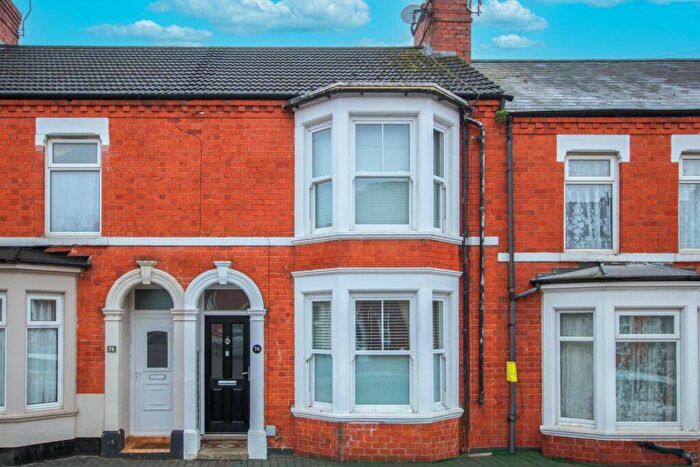
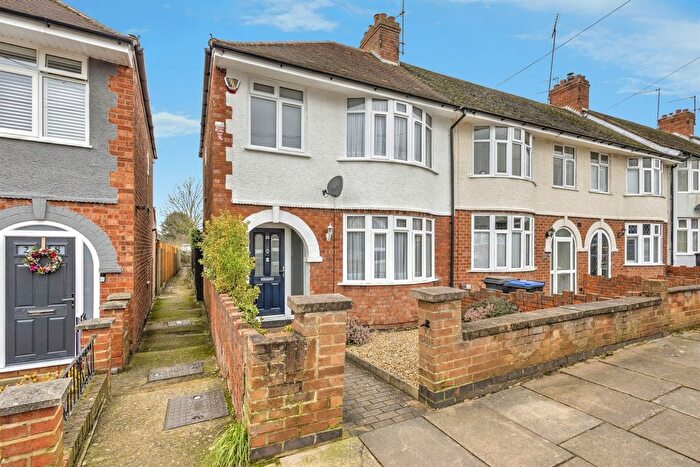
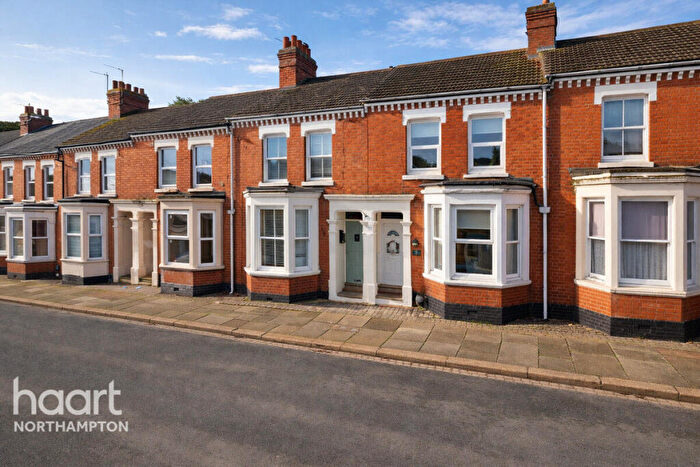
Properties in Trinity have an average house price of £246,978.00 and had 187 Property Transactions within the last 3 years¹.
Trinity is an area in Northampton, Northamptonshire with 1,686 households², where the most expensive property was sold for £645,000.00.
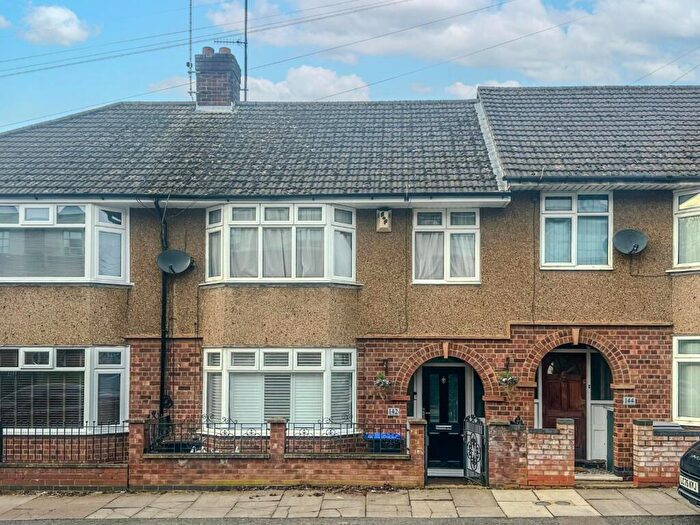
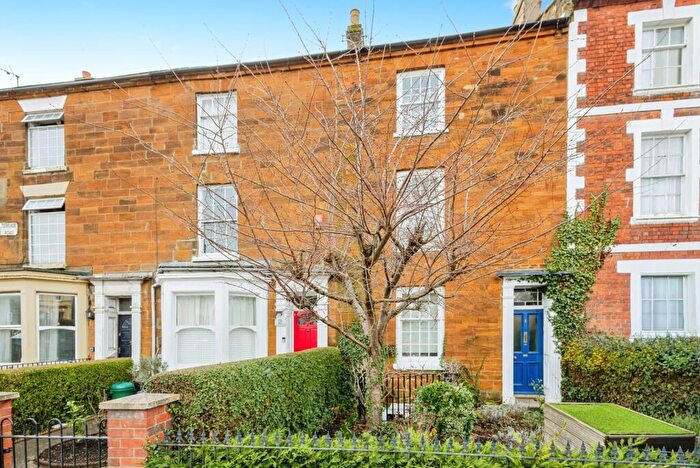
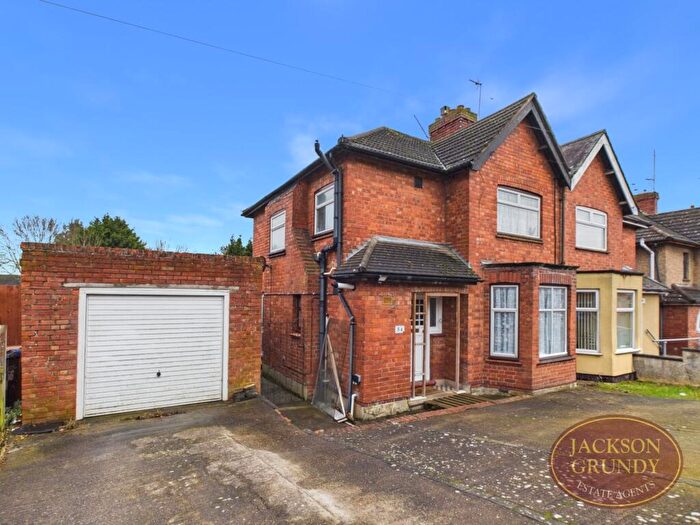
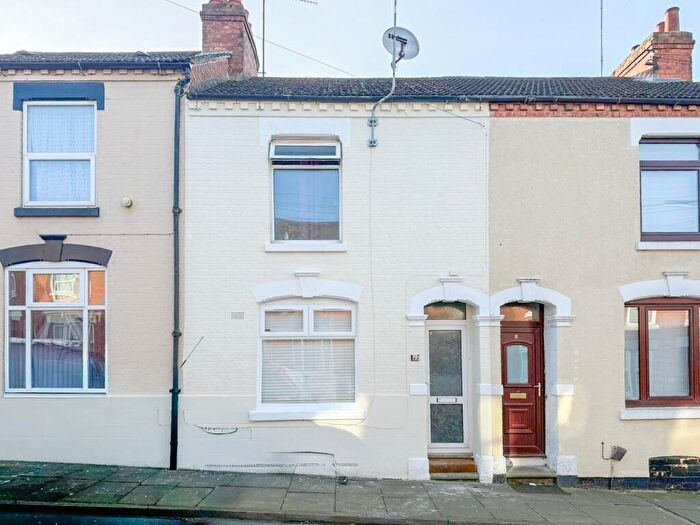
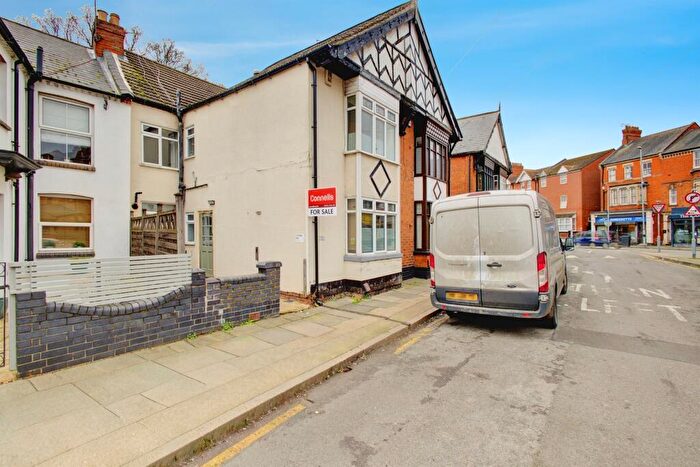
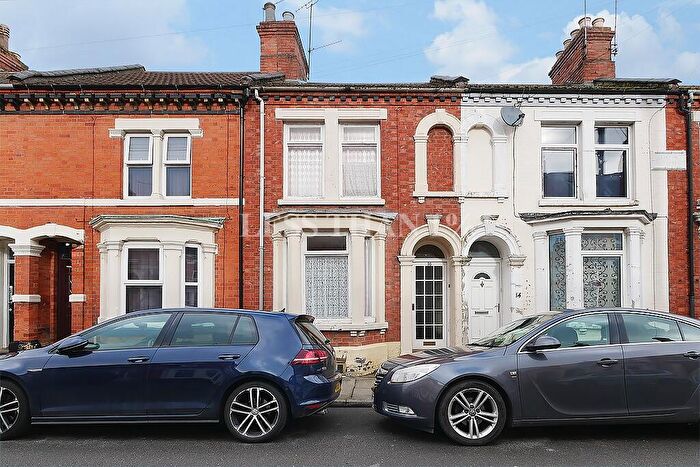
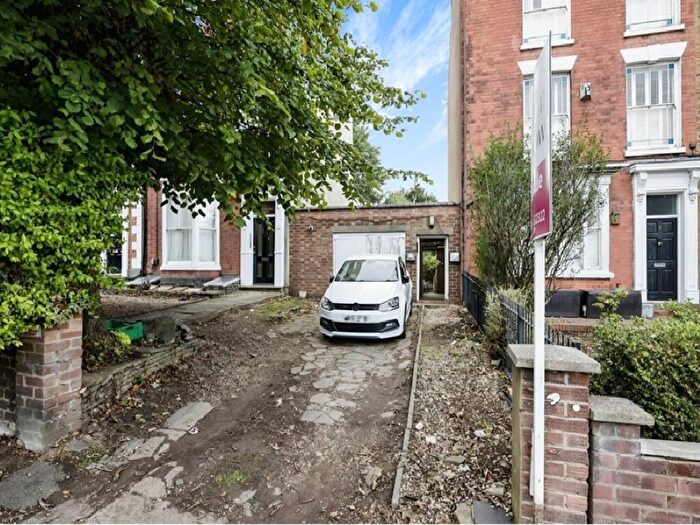
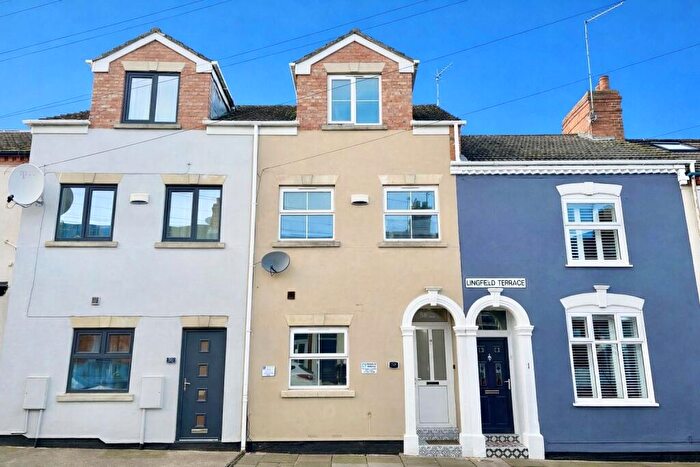
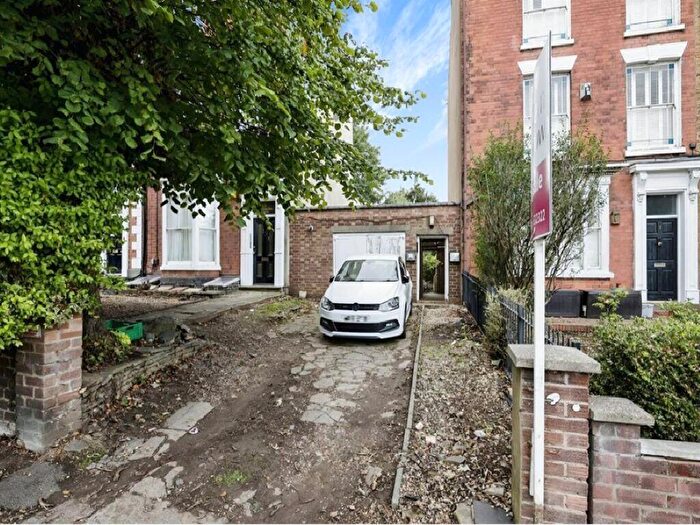
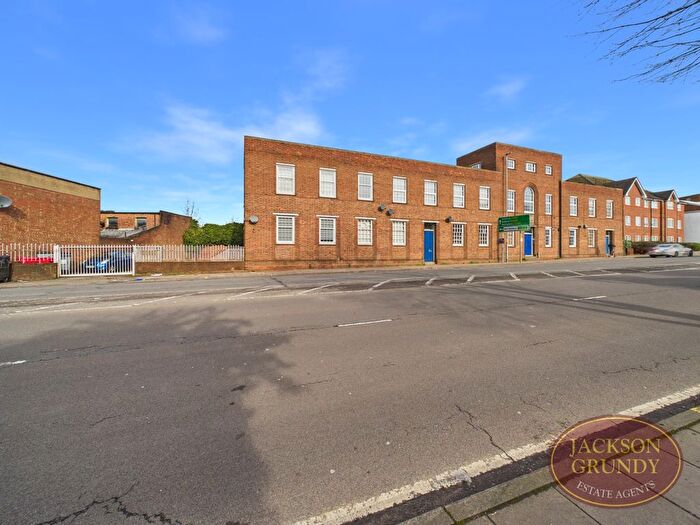
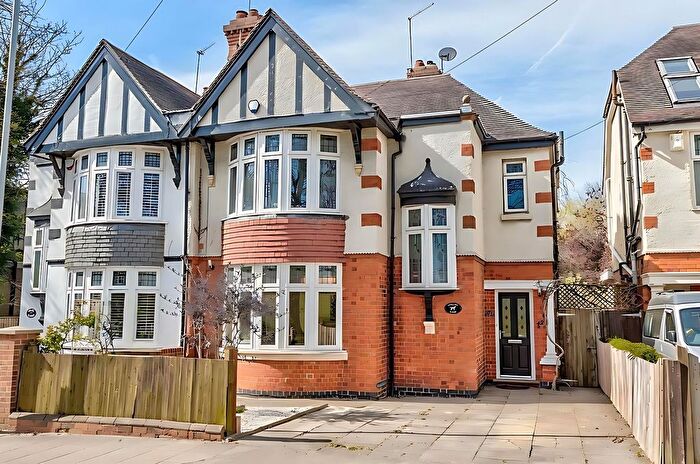
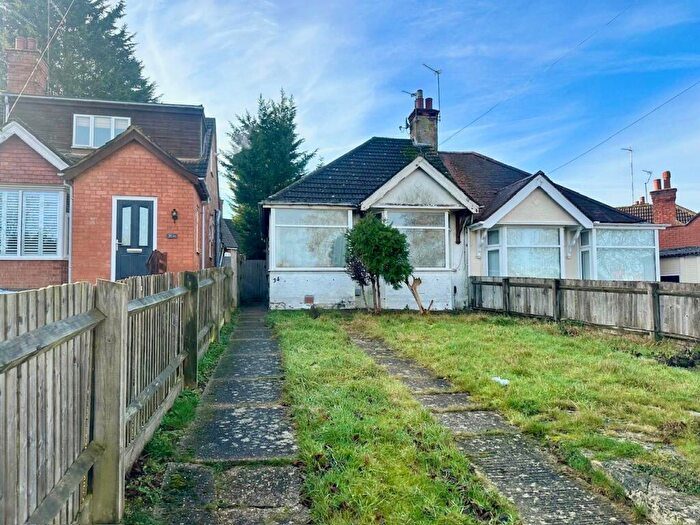
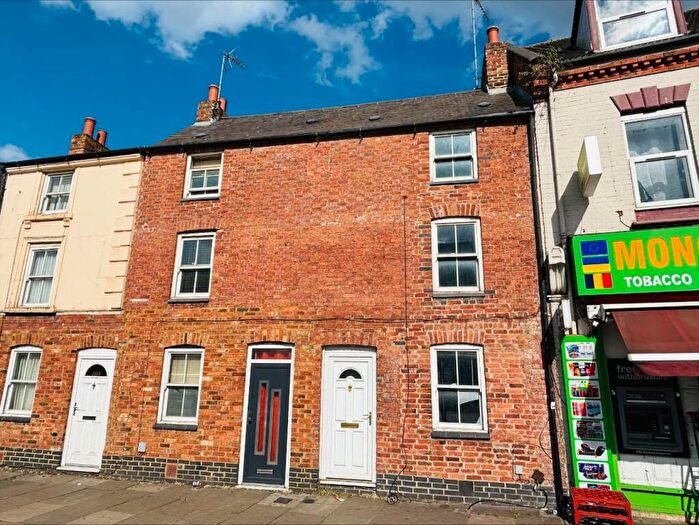
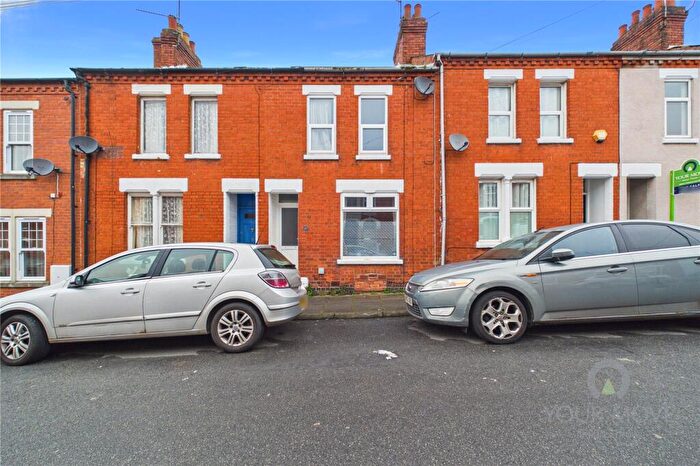
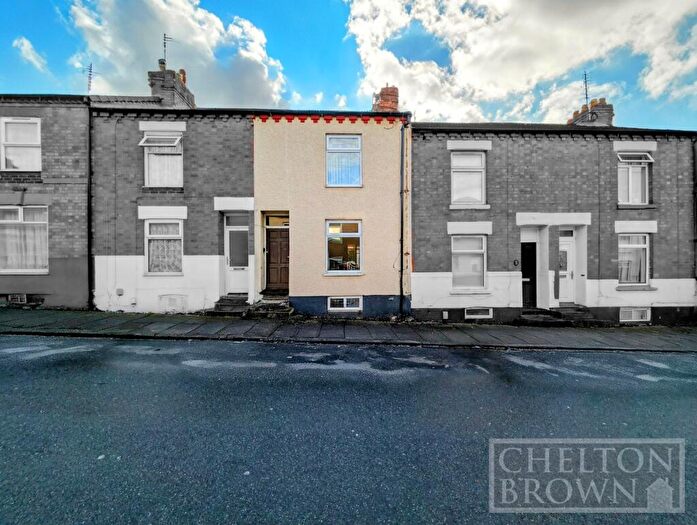
Properties for sale in Trinity
Roads and Postcodes in Trinity
Navigate through our locations to find the location of your next house in Trinity, Northampton for sale or to rent.
| Streets | Postcodes |
|---|---|
| Balfour Road | NN2 6JE NN2 6JP |
| Balmoral Place | NN2 6LB NN2 6NB NN2 6NJ |
| Balmoral Road | NN2 6JY NN2 6JZ NN2 6LA |
| Barrack Road | NN2 6AE |
| Brick Kiln Lane | NN2 6HZ |
| Brockton Street | NN2 6EQ NN2 6HA |
| Bunting Road | NN2 6EE NN2 6HU |
| Cecil Road | NN2 6PG NN2 6PQ |
| Clarence Avenue | NN2 6NX NN2 6NY NN2 6NZ NN2 6PA |
| Cranbrook Road | NN2 6JT |
| Dardis Close | NN2 7DN |
| East Park Parade | NN1 4LA NN1 4LB NN1 4LE |
| Edinburgh Road | NN2 6PH |
| Elysium Terrace | NN2 6EN |
| Freehold Street | NN2 6BF NN2 6EW |
| Harborough Road | NN2 7AX NN2 7JP |
| Hawtin Close | NN2 7BF |
| Homestead Way | NN2 6JG NN2 6JH |
| Kettering Road | NN1 4LG |
| Kingsley Gardens | NN2 7BW |
| Kingsley Road | NN2 7BL NN2 7BN NN2 7BT NN2 7BX NN2 7BY NN2 6JL NN2 7BP NN2 7DP NN2 7DS |
| Kingsthorpe Grove | NN2 6NT NN2 6PD |
| Kingsthorpe Road | NN2 6EZ NN2 6HT NN2 6LW |
| Langham Place | NN2 6AA |
| Monarch Terrace | NN2 6EJ |
| Murray Avenue | NN2 7BS |
| Nene Enterprise Centre | NN2 6EF |
| Osborne Road | NN2 6NU |
| Queens Park Parade | NN2 6LP NN2 6LR NN2 6LE |
| St Georges Avenue | NN2 6JA NN2 6JF NN2 6FB NN2 6JB NN2 6JD |
| St Georges Place | NN2 6EP |
| Stanhope Road | NN2 6JU NN2 6JX |
| Trinity Avenue | NN2 6JJ NN2 6JN NN2 6JW NN2 6LD |
Transport near Trinity
- FAQ
- Price Paid By Year
- Property Type Price
Frequently asked questions about Trinity
What is the average price for a property for sale in Trinity?
The average price for a property for sale in Trinity is £246,978. This amount is 14% lower than the average price in Northampton. There are 2,747 property listings for sale in Trinity.
What streets have the most expensive properties for sale in Trinity?
The streets with the most expensive properties for sale in Trinity are St Georges Avenue at an average of £463,833, Brick Kiln Lane at an average of £460,000 and Trinity Avenue at an average of £431,500.
What streets have the most affordable properties for sale in Trinity?
The streets with the most affordable properties for sale in Trinity are Freehold Street at an average of £179,132, Osborne Road at an average of £187,375 and Bunting Road at an average of £200,000.
Which train stations are available in or near Trinity?
Some of the train stations available in or near Trinity are Northampton, Long Buckby and Wellingborough.
Property Price Paid in Trinity by Year
The average sold property price by year was:
| Year | Average Sold Price | Price Change |
Sold Properties
|
|---|---|---|---|
| 2025 | £266,435 | -1% |
42 Properties |
| 2024 | £268,232 | 18% |
66 Properties |
| 2023 | £218,876 | -28% |
79 Properties |
| 2022 | £280,169 | 8% |
94 Properties |
| 2021 | £259,130 | 15% |
105 Properties |
| 2020 | £221,223 | 1% |
59 Properties |
| 2019 | £219,691 | -9% |
79 Properties |
| 2018 | £239,428 | 19% |
77 Properties |
| 2017 | £195,078 | 6% |
78 Properties |
| 2016 | £183,768 | -2% |
122 Properties |
| 2015 | £187,290 | 16% |
106 Properties |
| 2014 | £157,802 | 1% |
73 Properties |
| 2013 | £155,661 | -6% |
62 Properties |
| 2012 | £164,568 | 2% |
45 Properties |
| 2011 | £160,716 | 6% |
45 Properties |
| 2010 | £151,627 | 9% |
37 Properties |
| 2009 | £137,491 | -30% |
54 Properties |
| 2008 | £178,920 | 4% |
57 Properties |
| 2007 | £171,783 | -4% |
129 Properties |
| 2006 | £179,244 | 8% |
144 Properties |
| 2005 | £164,187 | -5% |
108 Properties |
| 2004 | £171,985 | 13% |
133 Properties |
| 2003 | £149,407 | 19% |
138 Properties |
| 2002 | £120,914 | 21% |
195 Properties |
| 2001 | £95,702 | 9% |
127 Properties |
| 2000 | £87,134 | 7% |
109 Properties |
| 1999 | £80,766 | 15% |
135 Properties |
| 1998 | £68,394 | 12% |
125 Properties |
| 1997 | £59,889 | 11% |
119 Properties |
| 1996 | £53,106 | 2% |
118 Properties |
| 1995 | £51,932 | - |
82 Properties |
Property Price per Property Type in Trinity
Here you can find historic sold price data in order to help with your property search.
The average Property Paid Price for specific property types in the last three years are:
| Property Type | Average Sold Price | Sold Properties |
|---|---|---|
| Semi Detached House | £270,585.00 | 17 Semi Detached Houses |
| Detached House | £315,199.00 | 9 Detached Houses |
| Terraced House | £256,915.00 | 137 Terraced Houses |
| Flat | £147,947.00 | 24 Flats |

