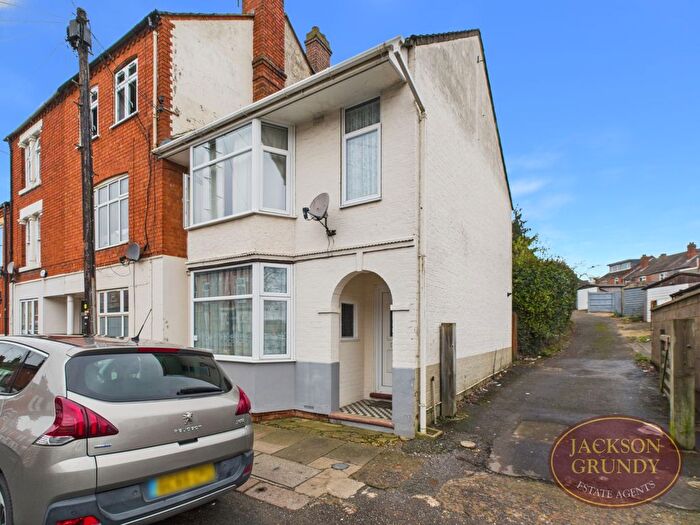
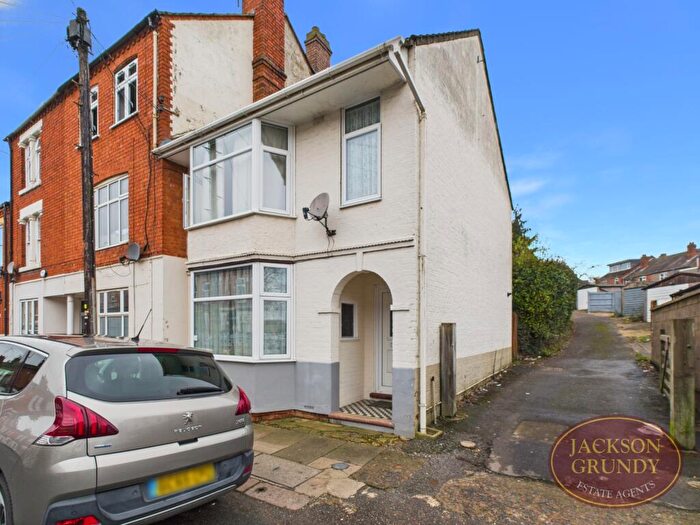
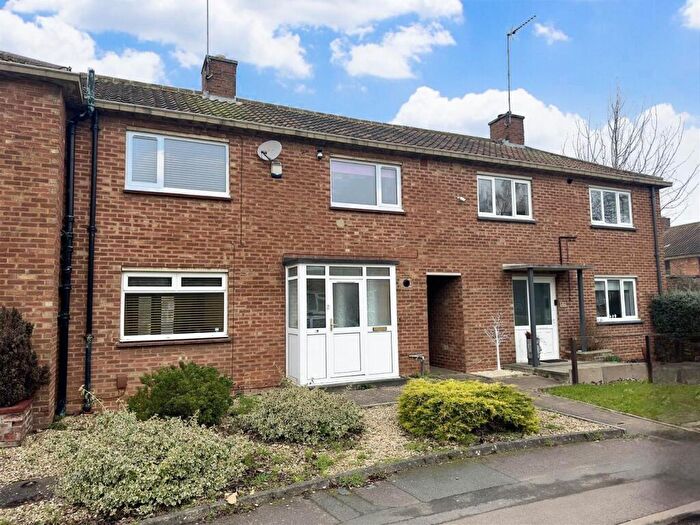
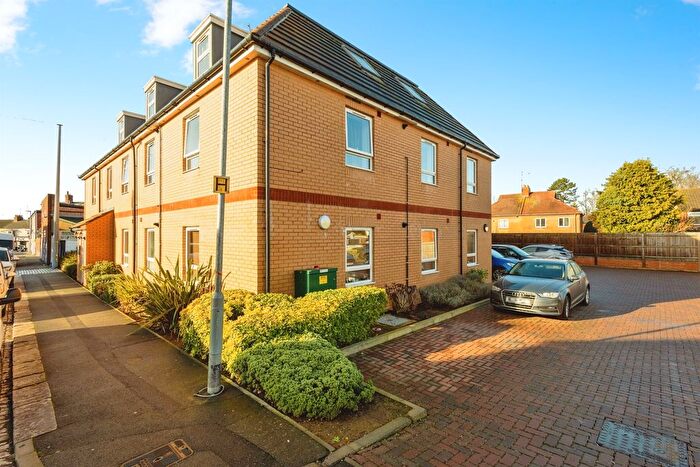
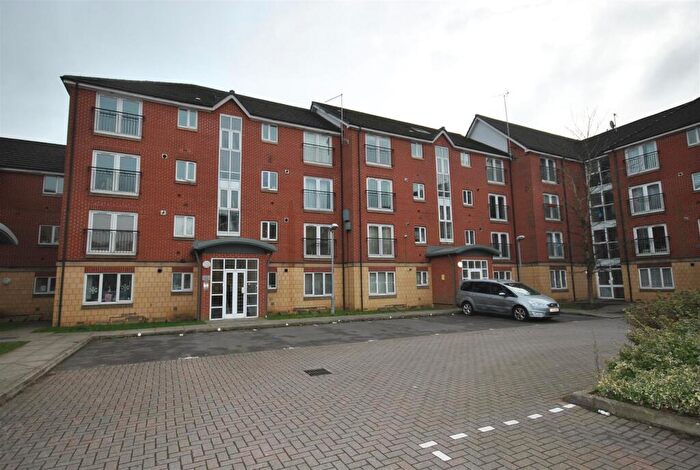
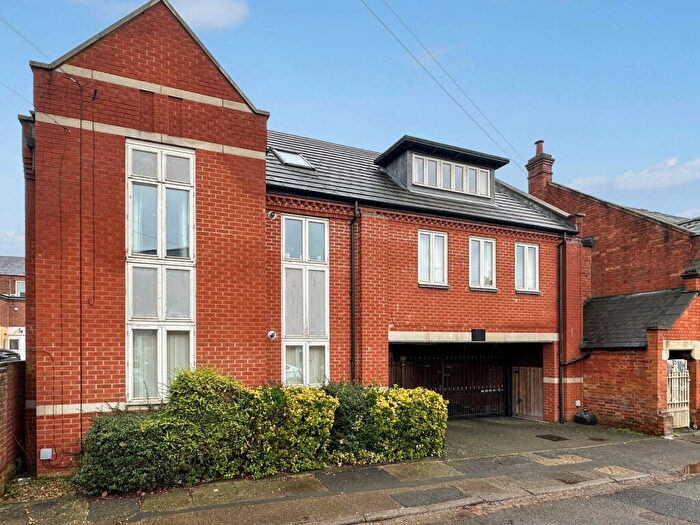
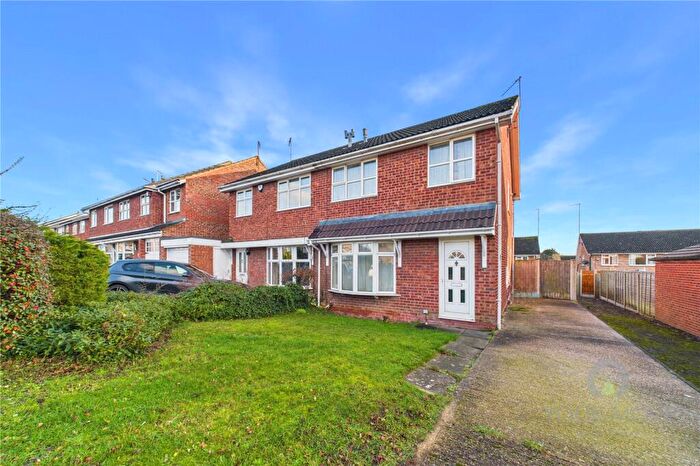
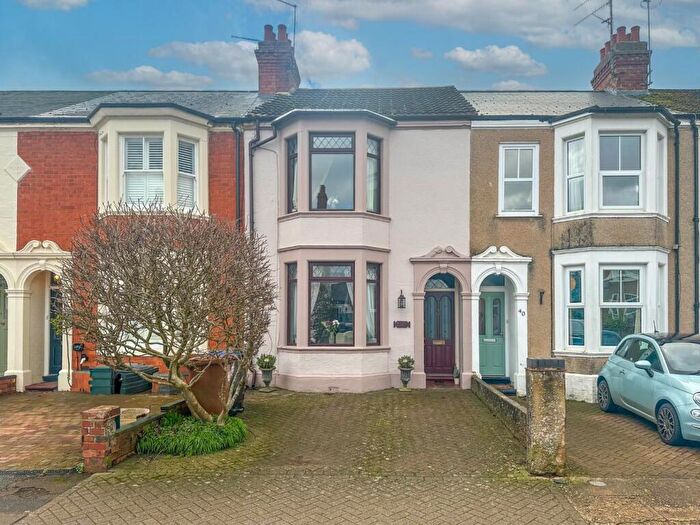
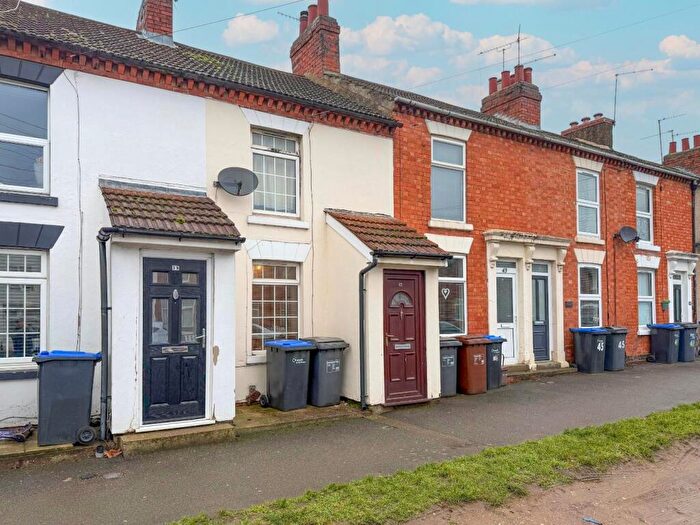
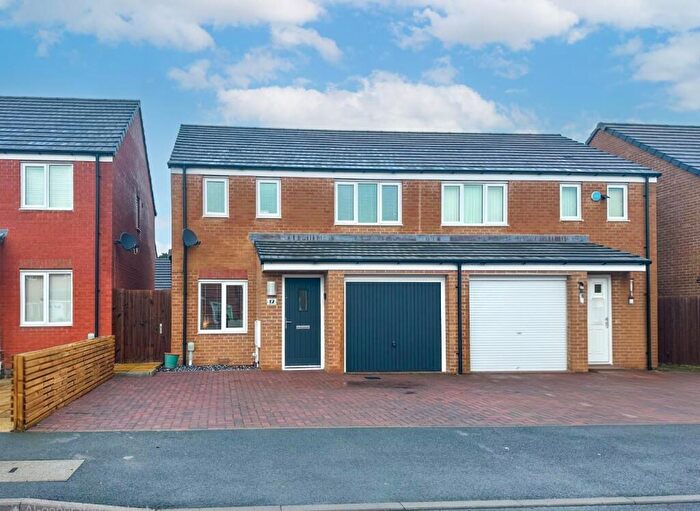
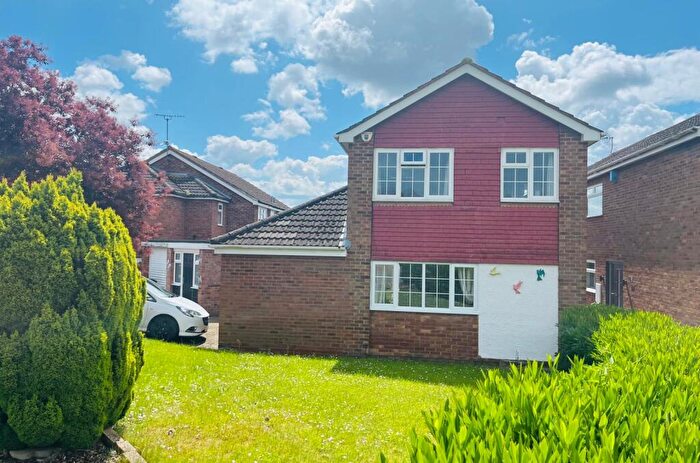
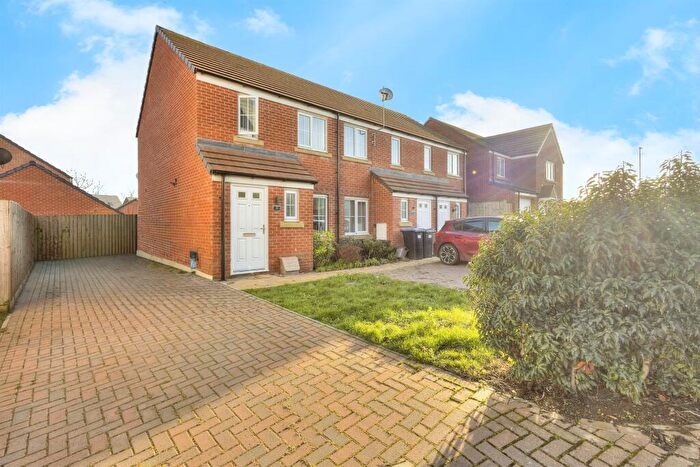
Houses for sale & to rent in St Davids, Northampton
House Prices in St Davids
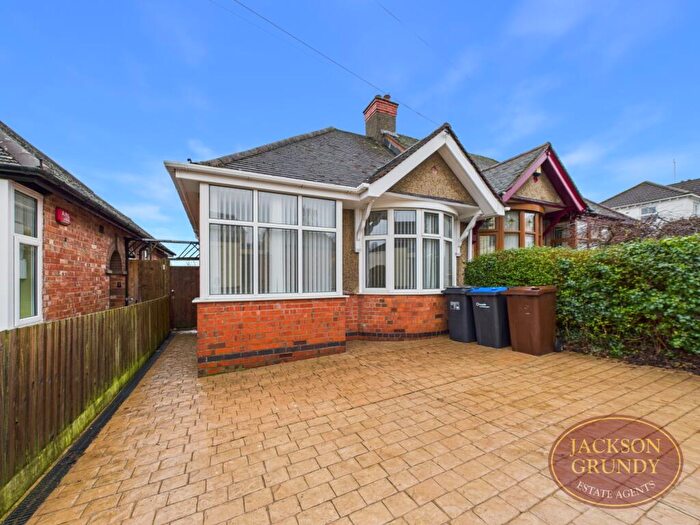
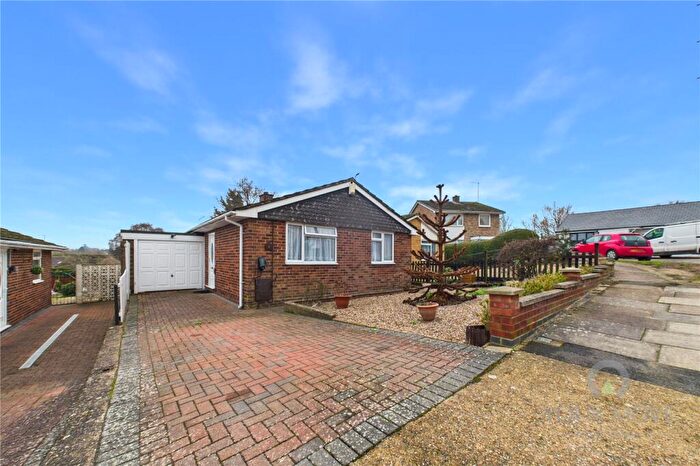
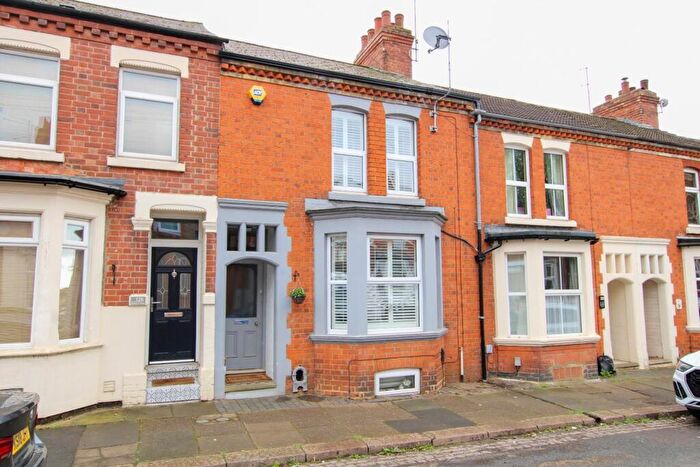
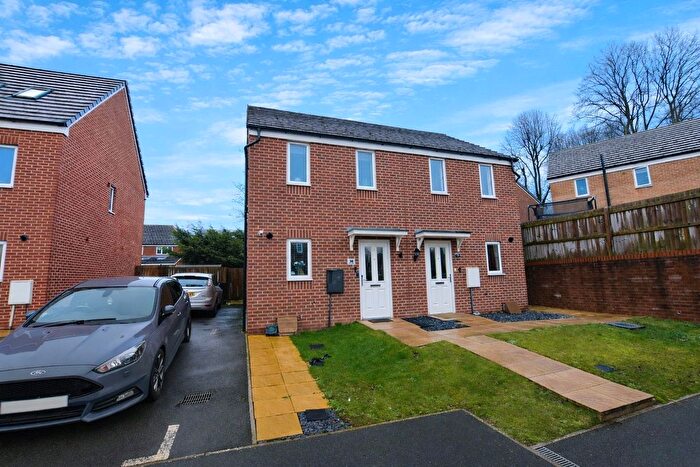
Properties in St Davids have an average house price of £214,091.63 and had 167 Property Transactions within the last 3 years¹.
St Davids is an area in Northampton, Northamptonshire with 2,108 households², where the most expensive property was sold for £393,250.00.
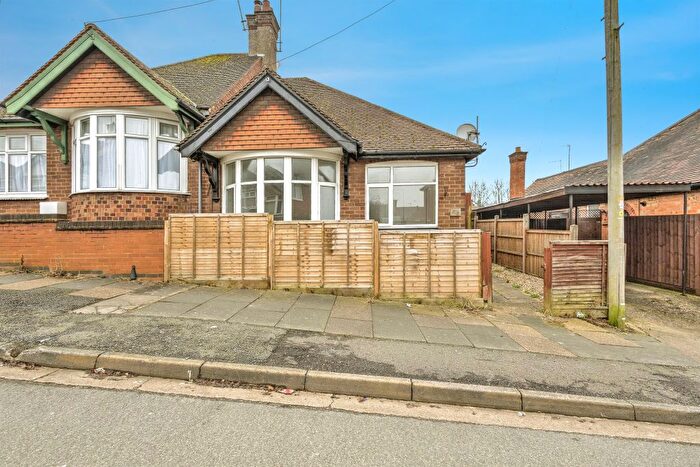
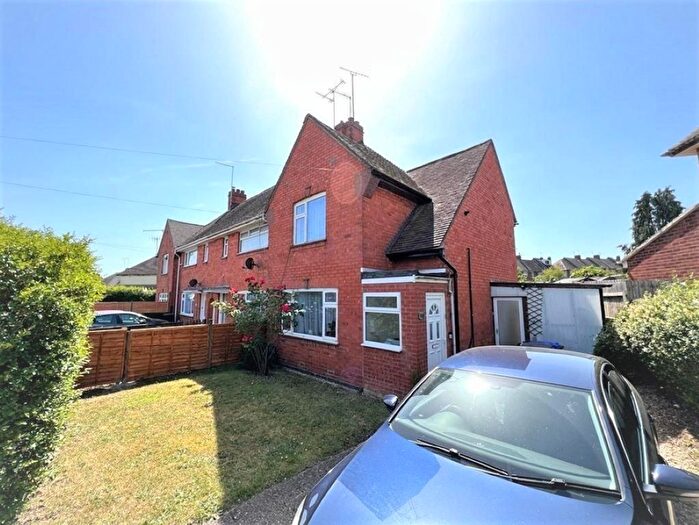
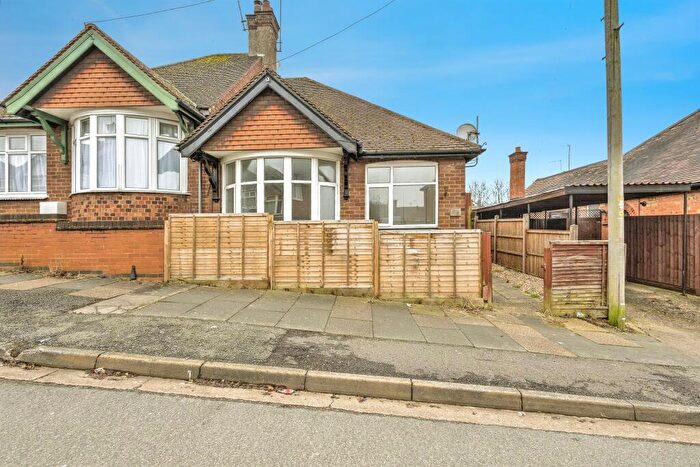
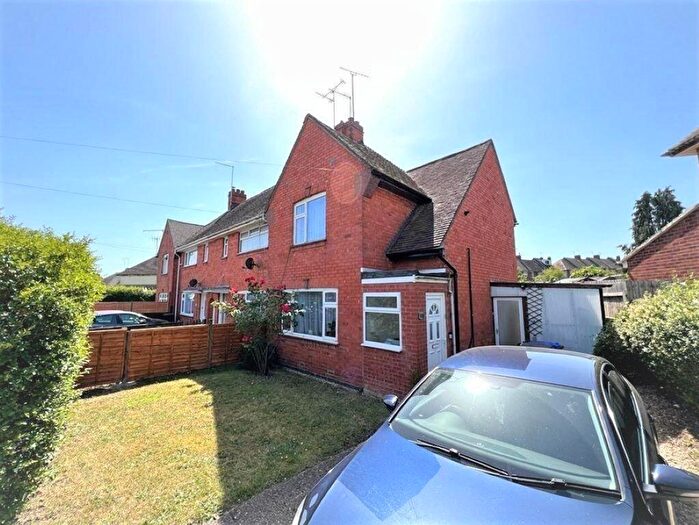
Properties for sale in St Davids
Roads and Postcodes in St Davids
Navigate through our locations to find the location of your next house in St Davids, Northampton for sale or to rent.
| Streets | Postcodes |
|---|---|
| Auckland Close | NN2 7BJ |
| Badby Close | NN2 7SG |
| Barnwell Road | NN2 7RP |
| Bondfield Avenue | NN2 7RD |
| Boughton Green Road | NN2 7HR |
| Brockhall Close | NN2 7RZ |
| Brockhall Road | NN2 7RY |
| Catesby Close | NN2 7RQ |
| Churchfield Close | NN2 7SQ |
| Cranford Road | NN2 7QU NN2 7QX NN2 7QY |
| Dorset Gardens | NN2 7PX |
| Dorset Road | NN2 7PU |
| Drayton Walk | NN2 7SD NN2 7SE NN2 7FG |
| Eastern Avenue North | NN2 7AS NN2 7AT NN2 7RB NN2 7RT NN2 7RU |
| Eastern Avenue South | NN2 7BE NN2 7QB NN2 7QD NN2 7JN |
| Eastern Close | NN2 7AU |
| Everdon Close | NN2 7RH |
| Faxton Close | NN2 7RJ |
| Grosvenor Gardens | NN2 7RS |
| Harborough Road | NN2 7BB NN2 7SH |
| Hastings Road | NN2 7RL NN2 7RN |
| Hellidon Close | NN2 7SF |
| Holdenby Road | NN2 7RG NN2 7RX |
| Kingsland Avenue | NN2 7PN NN2 7PP NN2 7PR NN2 7PS |
| Kingsland Close | NN2 7QA |
| Kingsland Gardens | NN2 7PW NN2 7BH |
| Kingsthorpe Grove | NN2 6NS NN2 6PB |
| Langdale Road | NN2 7QH NN2 7QQ |
| Morris Road | NN2 7PZ |
| Newnham Road | NN2 7QT NN2 7RE |
| Norton Road | NN2 7TL NN2 7TN |
| Nursery Lane | NN2 7PT NN2 7QG NN2 7TJ |
| Queens Crescent | NN2 7BQ |
| Queensland Gardens | NN2 7BG |
| Rosedale Road | NN2 7QE NN2 7QF |
| St Davids Road | NN2 7QJ NN2 7QL |
| Wakefield Road | NN2 7RW |
| West Ridge | NN2 7QZ NN2 7RA |
| Whilton Road | NN2 7SB |
| Whiston Road | NN2 7RR |
| Windyridge | NN2 7PY |
| Yelvertoft Road | NN2 7TG |
Transport near St Davids
- FAQ
- Price Paid By Year
- Property Type Price
Frequently asked questions about St Davids
What is the average price for a property for sale in St Davids?
The average price for a property for sale in St Davids is £214,092. This amount is 25% lower than the average price in Northampton. There are 1,816 property listings for sale in St Davids.
What streets have the most expensive properties for sale in St Davids?
The streets with the most expensive properties for sale in St Davids are Auckland Close at an average of £355,468, Kingsthorpe Grove at an average of £315,817 and Eastern Close at an average of £253,666.
What streets have the most affordable properties for sale in St Davids?
The streets with the most affordable properties for sale in St Davids are Grosvenor Gardens at an average of £92,500, Drayton Walk at an average of £120,000 and Windyridge at an average of £158,000.
Which train stations are available in or near St Davids?
Some of the train stations available in or near St Davids are Northampton, Long Buckby and Wellingborough.
Property Price Paid in St Davids by Year
The average sold property price by year was:
| Year | Average Sold Price | Price Change |
Sold Properties
|
|---|---|---|---|
| 2025 | £211,767 | 0,2% |
44 Properties |
| 2024 | £211,276 | -4% |
65 Properties |
| 2023 | £219,009 | -2% |
58 Properties |
| 2022 | £223,874 | 13% |
68 Properties |
| 2021 | £195,303 | 12% |
77 Properties |
| 2020 | £171,191 | -2% |
47 Properties |
| 2019 | £175,308 | 4% |
84 Properties |
| 2018 | £168,613 | -6% |
70 Properties |
| 2017 | £178,985.63 | 17% |
71 Properties |
| 2016 | £148,852 | 9% |
77 Properties |
| 2015 | £136,135 | 8% |
72 Properties |
| 2014 | £124,659 | 6% |
82 Properties |
| 2013 | £117,516 | 0,3% |
59 Properties |
| 2012 | £117,195 | 5% |
44 Properties |
| 2011 | £111,307 | -4% |
42 Properties |
| 2010 | £115,681 | 7% |
52 Properties |
| 2009 | £107,033 | -15% |
28 Properties |
| 2008 | £123,419 | 0,3% |
54 Properties |
| 2007 | £123,026 | 6% |
95 Properties |
| 2006 | £115,059 | 4% |
118 Properties |
| 2005 | £110,635 | -10% |
88 Properties |
| 2004 | £122,028 | 23% |
130 Properties |
| 2003 | £93,512 | 24% |
110 Properties |
| 2002 | £70,634 | 12% |
113 Properties |
| 2001 | £62,319 | 14% |
83 Properties |
| 2000 | £53,340 | 14% |
70 Properties |
| 1999 | £46,017 | 9% |
88 Properties |
| 1998 | £42,068 | 5% |
69 Properties |
| 1997 | £39,878 | 13% |
81 Properties |
| 1996 | £34,603 | 4% |
73 Properties |
| 1995 | £33,345 | - |
55 Properties |
Property Price per Property Type in St Davids
Here you can find historic sold price data in order to help with your property search.
The average Property Paid Price for specific property types in the last three years are:
| Property Type | Average Sold Price | Sold Properties |
|---|---|---|
| Semi Detached House | £223,124.00 | 49 Semi Detached Houses |
| Detached House | £359,964.00 | 7 Detached Houses |
| Terraced House | £204,768.00 | 106 Terraced Houses |
| Flat | £119,000.00 | 5 Flats |

