
Houses for sale in Blyth, Northumberland
House Prices in Blyth
Properties in Blyth have an average house price of £141k and had 1,732 Property Transactions within the last 3 years.¹
Blyth is an area in Northumberland with 16,675 households², where the most expensive property was sold for £650k.
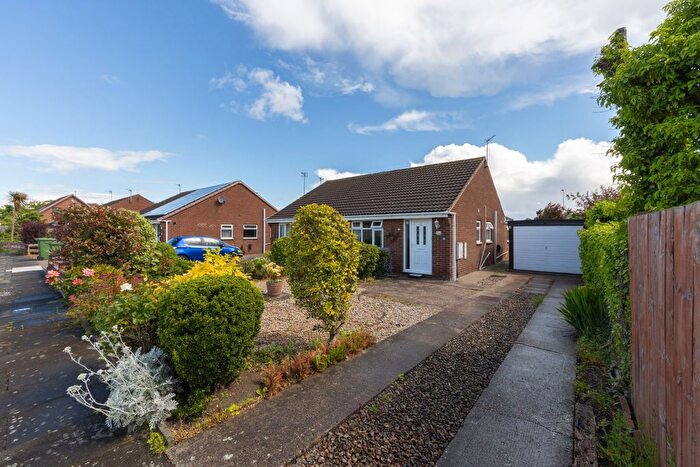
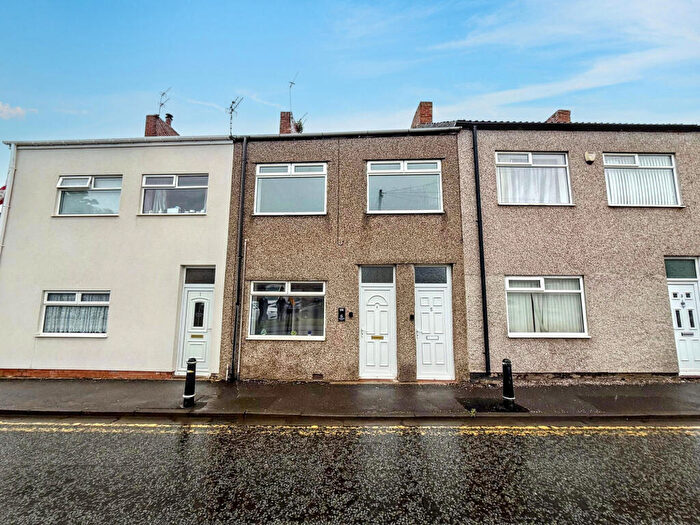
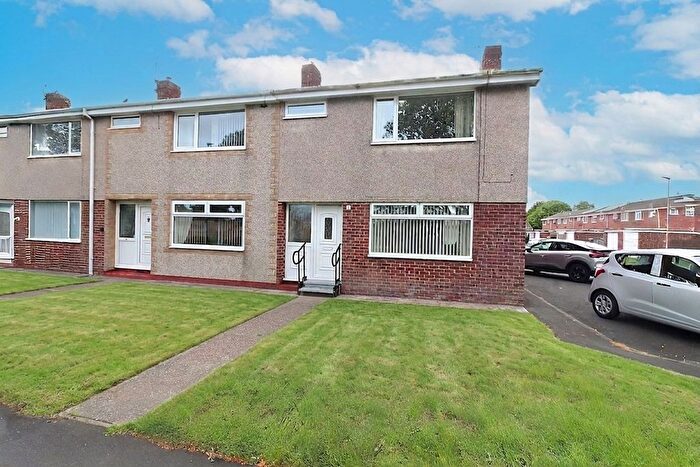
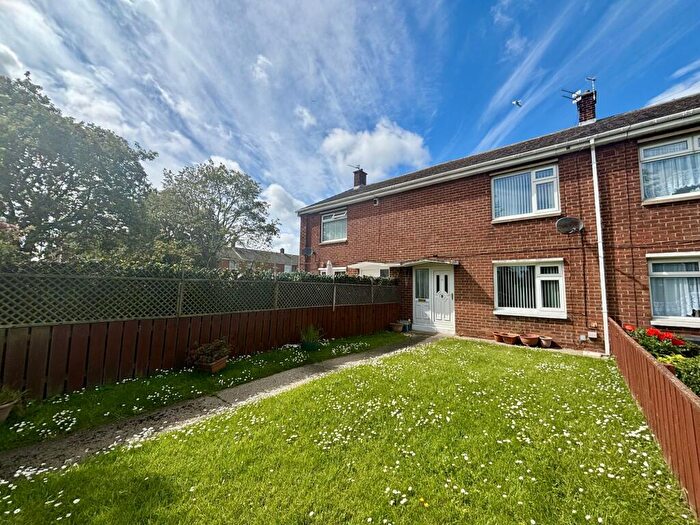
Properties for sale in Blyth
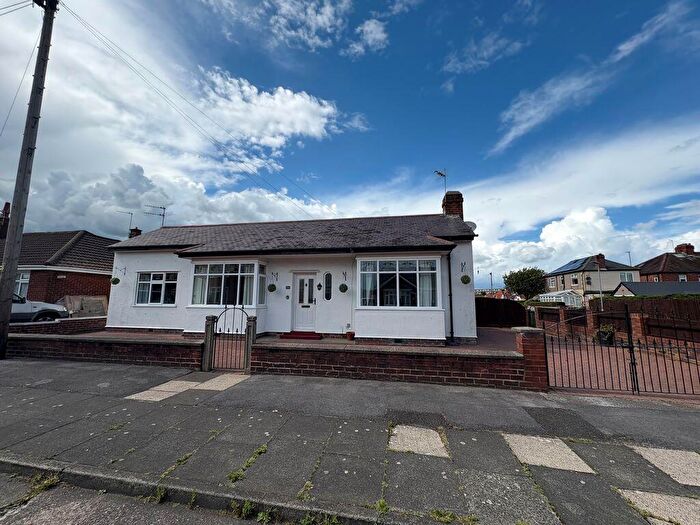
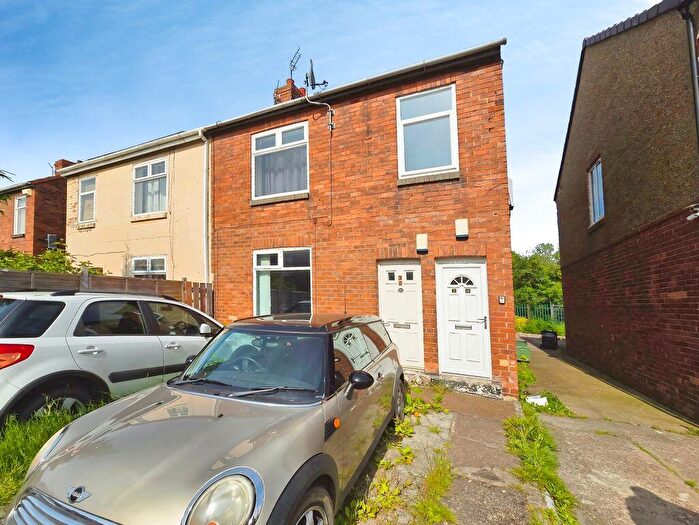
![]()
If you are looking to sell your house, let it out, or receive a property valuation, an expert can help you.
Click the button below to get started.
Neighbourhoods in Blyth
Navigate through our locations to find the location of your next house in Blyth, Northumberland for sale or to rent.
Property price trends in Blyth
According to the latest Land Registry data, the average home in Blyth sold for £134,142 in 2026. That figure comes from a substantial record of 20,048 sales logged over the past 31 years.
Prices have held fairly steady over the last three years. Compared with 2023, when the typical sale came in around £133,827, values are broadly unchanged.
Looking back five years, average prices are up about 4.9% since 2021, a gain of around £6,238 in cash terms.
Zoom out to the past decade for the fuller picture. Back in 2016, homes here averaged £127,282, so the typical sold price has climbed about 5.4% since then, roughly 0.5% a year. Stretch the view to fifteen years and that annual pace edges up closer to 1.5%.
Frequently asked questions about Blyth
What is the average price for a property for sale in Blyth?
The average price for a property for sale in Blyth is £140,795. This amount is 40% lower than the average price in Northumberland. There are 5,401 property listings for sale in Blyth.
What locations have the most expensive properties for sale in Blyth?
The locations with the most expensive properties for sale in Blyth are South Blyth at an average of £202,723, Kitty Brewster at an average of £161,665 and Plessey at an average of £160,765.
What locations have the most affordable properties for sale in Blyth?
The locations with the most affordable properties for sale in Blyth are Isabella at an average of £92,956, Croft at an average of £93,584 and Sleekburn at an average of £95,151.
Which train stations are available in or near Blyth?
Some of the train stations available in or near Blyth are Cramlington, Pegswood and Morpeth.
Property Price Paid in Blyth by Year
The average sold property price by year was:
| Year | Average Sold Price | Price Change |
Sold Properties
|
|---|---|---|---|
| 2026 | £134,142 | -10% |
38 Properties |
| 2025 | £147,952 | 5% |
554 Properties |
| 2024 | £141,098 | 5% |
582 Properties |
| 2023 | £133,827 | -4% |
558 Properties |
| 2022 | £139,031 | 8% |
691 Properties |
| 2021 | £127,904 | 3% |
732 Properties |
| 2020 | £124,213 | -1% |
591 Properties |
| 2019 | £126,048 | -4% |
727 Properties |
| 2018 | £131,040 | -0,2% |
833 Properties |
| 2017 | £131,250 | 3% |
772 Properties |
Property Price per Property Type in Blyth
Here you can find historic sold price data in order to help with your property search.
The average Property Paid Price for specific property types in the last three years are:
| Property Type | Average Sold Price | Sold Properties |
|---|---|---|
| Semi Detached House | £145,160.00 | 612 Semi Detached Houses |
| Detached House | £244,318.00 | 297 Detached Houses |
| Terraced House | £110,575.00 | 632 Terraced Houses |
| Flat | £65,828.00 | 191 Flats |
Transport in Blyth
Please see below transportation links in this area:
