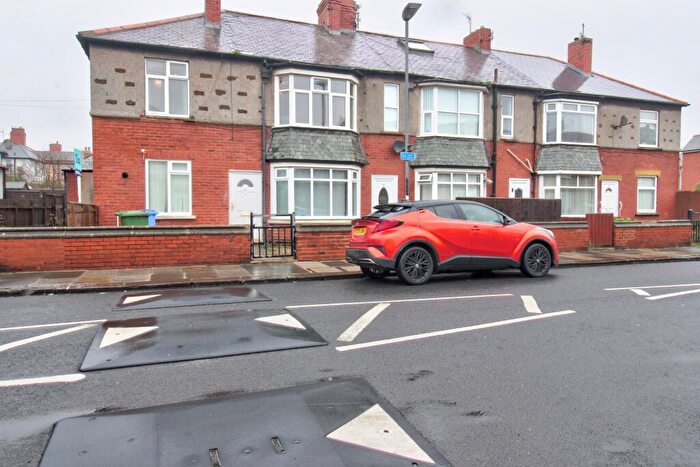
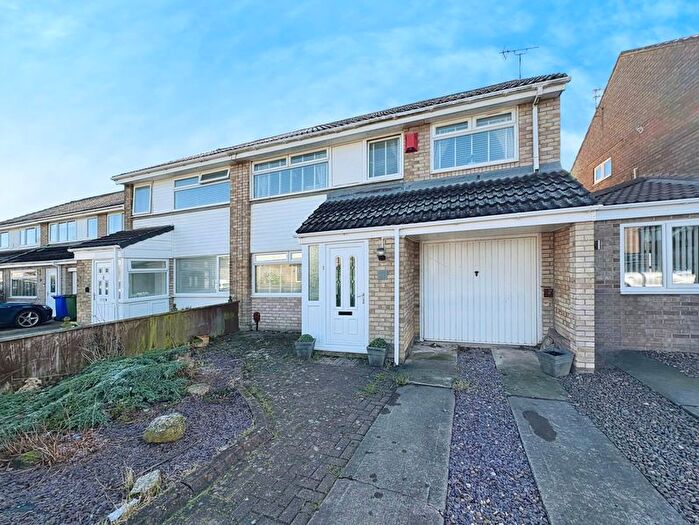
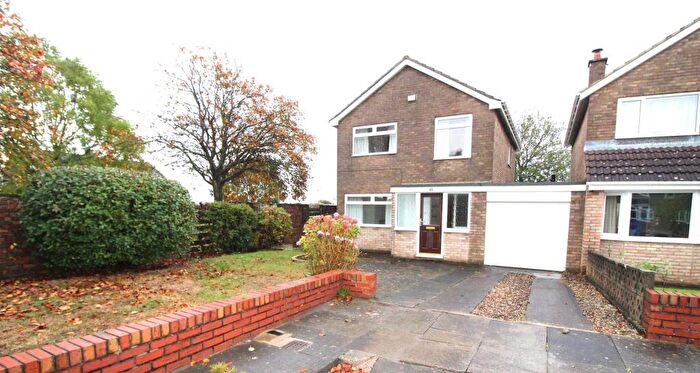
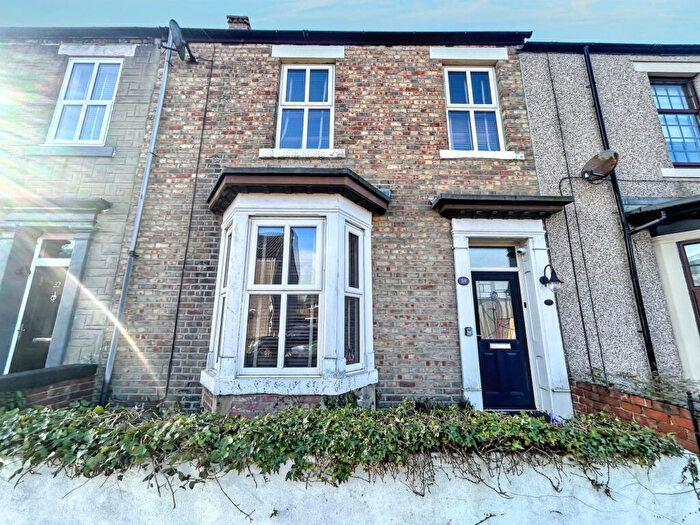
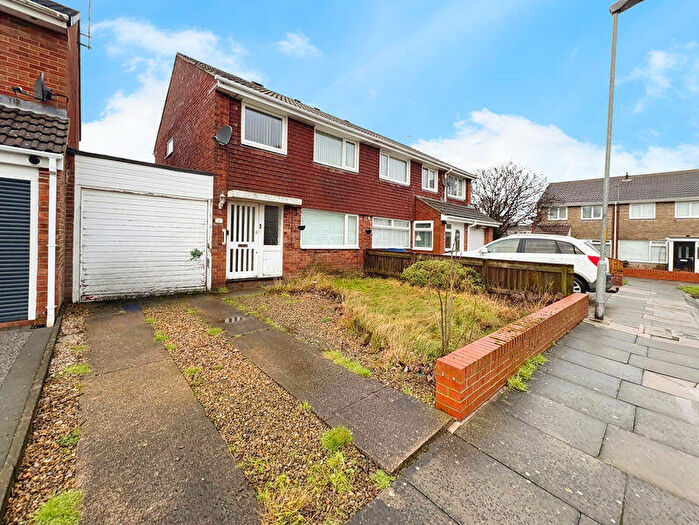
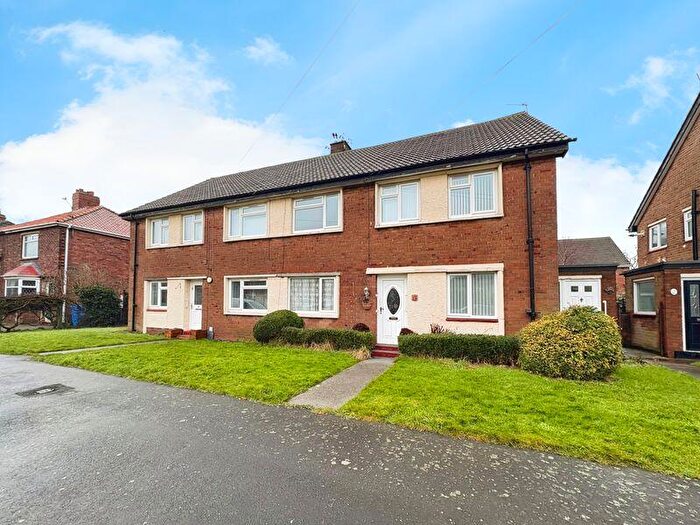
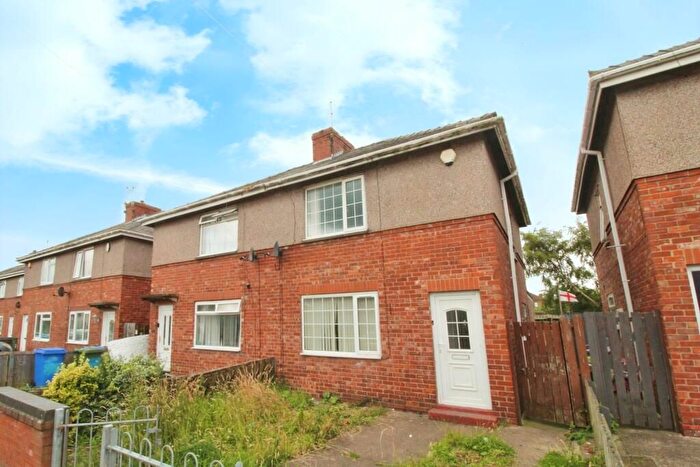
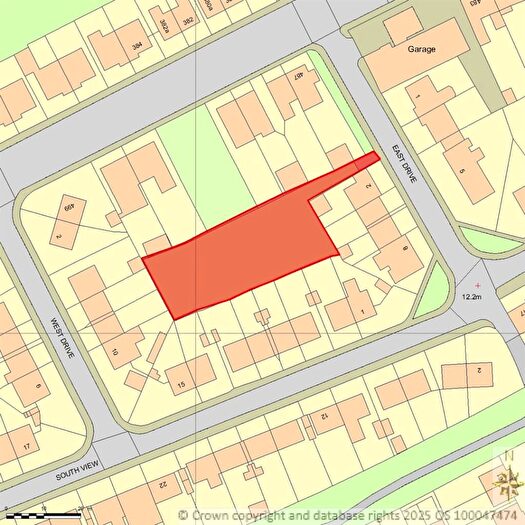
Houses for sale & to rent in Plessey, Blyth
House Prices in Plessey
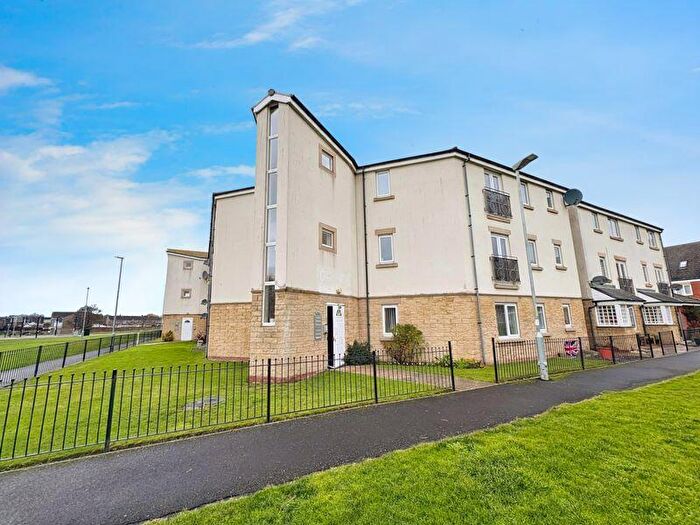
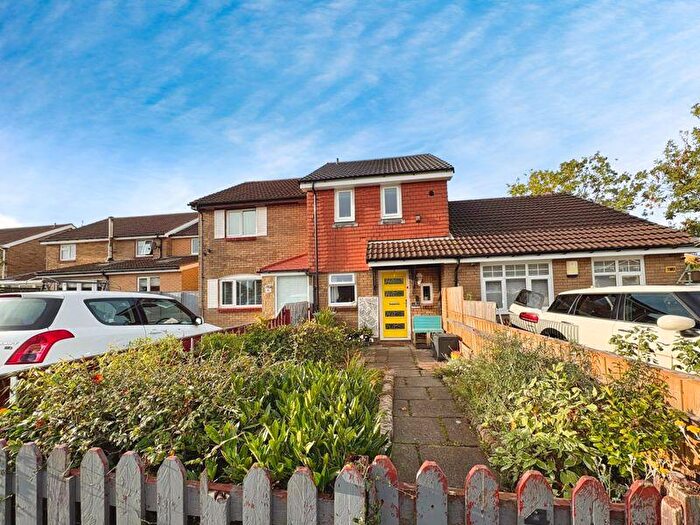
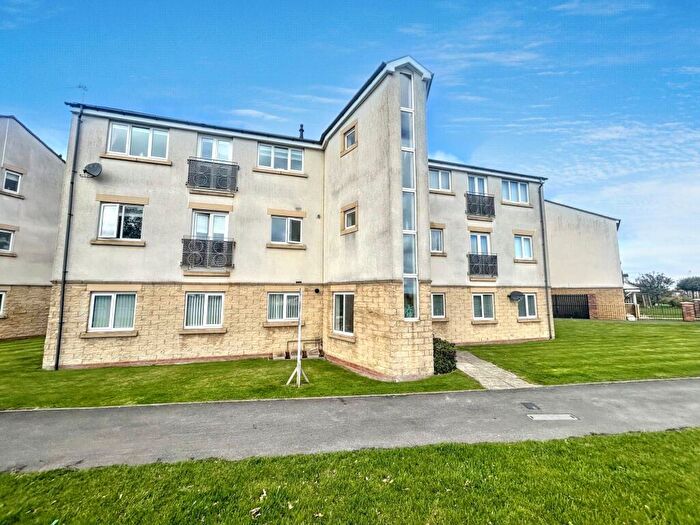
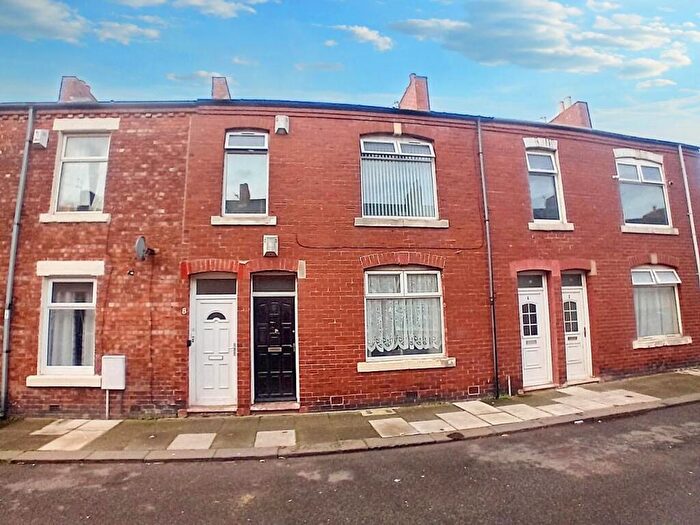
Properties in Plessey have an average house price of £162,715.00 and had 159 Property Transactions within the last 3 years¹.
Plessey is an area in Blyth, Northumberland with 1,907 households², where the most expensive property was sold for £355,000.00.
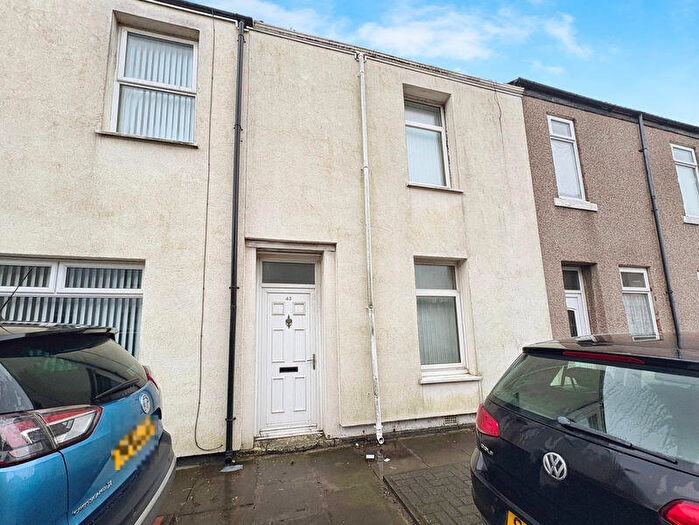
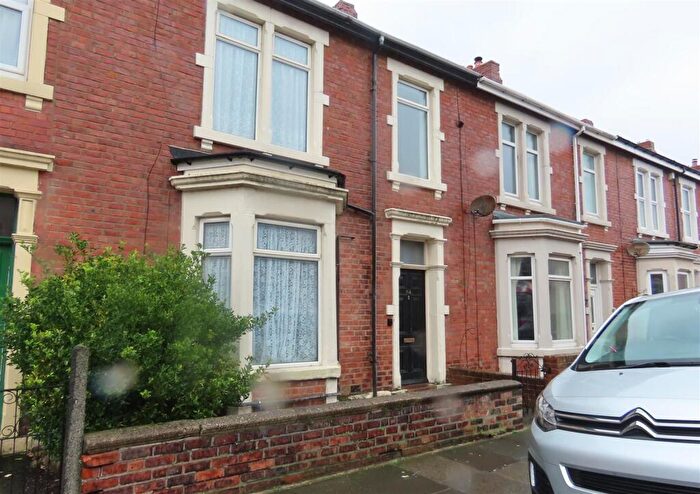
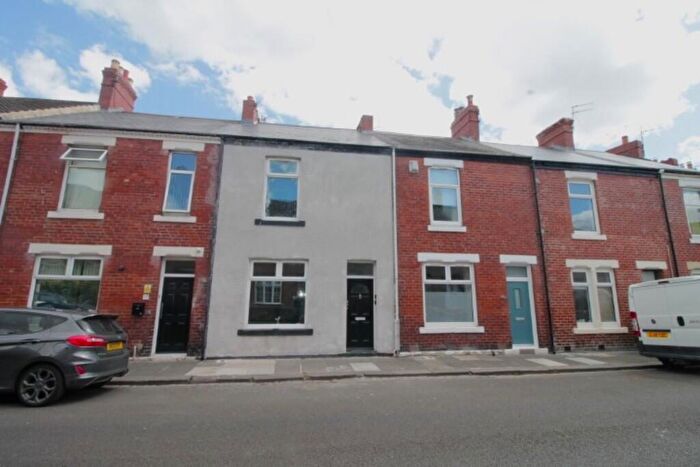
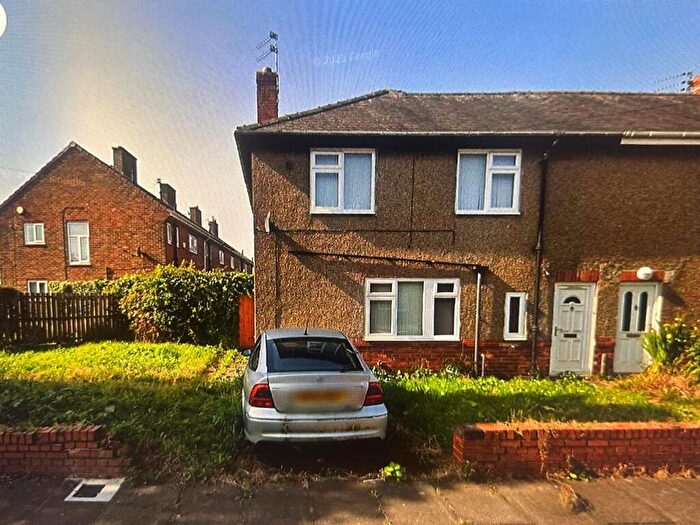
Properties for sale in Plessey
Roads and Postcodes in Plessey
Navigate through our locations to find the location of your next house in Plessey, Blyth for sale or to rent.
| Streets | Postcodes |
|---|---|
| Addington Drive | NE24 3TH |
| Alconbury Close | NE24 3TL NE24 3TN |
| Amberley Way | NE24 3TA NE24 3TB NE24 3TD |
| Appledore Road | NE24 3TE NE24 3TF NE24 3TG NE24 3TQ |
| Ashford Close | NE24 3TJ |
| Aylesford Square | NE24 3TW |
| Banbury Way | NE24 3TY NE24 3TZ |
| Barras Avenue | NE24 3LL |
| Barras Avenue West | NE24 3LR |
| Bexhill Square | NE24 3TX |
| Broadway | NE24 2PP NE24 2PR |
| Bromley Gardens | NE24 3TP NE24 3TR NE24 3TS NE24 3TU NE24 3TT |
| Burnham Close | NE24 3UB |
| Carrick Court | NE24 3HB |
| Carrick Drive | NE24 3SX |
| Clifton Gardens | NE24 3SY |
| Coquet Avenue | NE24 3LQ |
| Curlew Way | NE24 3SA NE24 3SB NE24 3SD |
| Dunlin Drive | NE24 3SH NE24 3SQ |
| East Drive | NE24 3LT |
| Eleventh Avenue | NE24 2PX |
| Fairfield Avenue | NE24 3HW |
| Farndale Court | NE24 3HP |
| Farnham Grove | NE24 3HN |
| Felstead Place | NE24 3HL |
| Fenwick Avenue | NE24 3LN |
| Fifteenth Avenue | NE24 2QH |
| Grange Close | NE24 3HS |
| Grebe Close | NE24 3QU NE24 3QX |
| Guillemot Close | NE24 3SL NE24 3SN |
| Kingfisher Way | NE24 3QP NE24 3QR NE24 3QW |
| Medwyn Close | NE24 3SZ |
| Melville Avenue | NE24 3SU |
| Newlands Avenue | NE24 2QN |
| Newlands Place | NE24 2QL |
| Newlands Road | NE24 2QJ |
| Ninth Avenue | NE24 2TD NE24 2TE |
| Osprey Drive | NE24 3QS NE24 3QT |
| Plessey Road | NE24 3LD NE24 3LJ NE24 3LP NE24 3LU NE24 3LW NE24 3NH NE24 3NJ NE24 3NN NE24 3NW NE24 3QY NE24 3LE |
| Plover Close | NE24 3SF NE24 3SG |
| Redshank Drive | NE24 3SJ |
| Rowan Court | NE24 2SL |
| Seafield Road | NE24 3LG |
| Seventh Avenue | NE24 2TA NE24 2TB |
| Sixth Avenue | NE24 2ST NE24 2SU |
| South View | NE24 3RA NE24 3RB |
| Tenth Avenue | NE24 2PS NE24 2PT NE24 2PU |
| Titania Court | NE24 3UD |
| Twelfth Avenue | NE24 2PY NE24 2PZ NE24 2QA NE24 2QB |
| Twentyfifth Avenue | NE24 2QW |
| Wansbeck Avenue | NE24 3LF |
| Warkworth Avenue | NE24 3LH |
| West Drive | NE24 3QZ |
Transport near Plessey
- FAQ
- Price Paid By Year
- Property Type Price
Frequently asked questions about Plessey
What is the average price for a property for sale in Plessey?
The average price for a property for sale in Plessey is £162,715. This amount is 15% higher than the average price in Blyth. There are 1,815 property listings for sale in Plessey.
What streets have the most expensive properties for sale in Plessey?
The streets with the most expensive properties for sale in Plessey are Farnham Grove at an average of £291,000, Felstead Place at an average of £288,750 and Fairfield Avenue at an average of £276,775.
What streets have the most affordable properties for sale in Plessey?
The streets with the most affordable properties for sale in Plessey are Twelfth Avenue at an average of £63,250, Seventh Avenue at an average of £72,666 and Ninth Avenue at an average of £82,500.
Which train stations are available in or near Plessey?
Some of the train stations available in or near Plessey are Cramlington, Pegswood and Morpeth.
Property Price Paid in Plessey by Year
The average sold property price by year was:
| Year | Average Sold Price | Price Change |
Sold Properties
|
|---|---|---|---|
| 2025 | £171,849 | 6% |
48 Properties |
| 2024 | £161,024 | 3% |
54 Properties |
| 2023 | £156,627 | 7% |
57 Properties |
| 2022 | £145,818 | -3% |
61 Properties |
| 2021 | £150,071 | 17% |
73 Properties |
| 2020 | £125,231 | -6% |
53 Properties |
| 2019 | £132,176 | 4% |
71 Properties |
| 2018 | £127,049 | -4% |
79 Properties |
| 2017 | £131,975 | 8% |
58 Properties |
| 2016 | £120,833 | -3% |
60 Properties |
| 2015 | £125,059 | - |
70 Properties |
| 2014 | £125,038 | 9% |
59 Properties |
| 2013 | £114,263 | -9% |
59 Properties |
| 2012 | £124,860 | 9% |
41 Properties |
| 2011 | £113,977 | -19% |
44 Properties |
| 2010 | £135,969 | 3% |
43 Properties |
| 2009 | £131,921 | -0,3% |
42 Properties |
| 2008 | £132,333 | 4% |
45 Properties |
| 2007 | £126,625 | -1% |
112 Properties |
| 2006 | £128,195 | 6% |
82 Properties |
| 2005 | £120,114 | 9% |
72 Properties |
| 2004 | £109,648 | 24% |
78 Properties |
| 2003 | £83,637 | 26% |
77 Properties |
| 2002 | £61,636 | 8% |
87 Properties |
| 2001 | £56,792 | 6% |
95 Properties |
| 2000 | £53,247 | 5% |
113 Properties |
| 1999 | £50,726 | 7% |
111 Properties |
| 1998 | £47,028 | 3% |
79 Properties |
| 1997 | £45,823 | 2% |
72 Properties |
| 1996 | £45,024 | -0,5% |
81 Properties |
| 1995 | £45,244 | - |
62 Properties |
Property Price per Property Type in Plessey
Here you can find historic sold price data in order to help with your property search.
The average Property Paid Price for specific property types in the last three years are:
| Property Type | Average Sold Price | Sold Properties |
|---|---|---|
| Semi Detached House | £155,358.00 | 93 Semi Detached Houses |
| Detached House | £251,585.00 | 23 Detached Houses |
| Terraced House | £132,695.00 | 41 Terraced Houses |
| Flat | £98,250.00 | 2 Flats |

