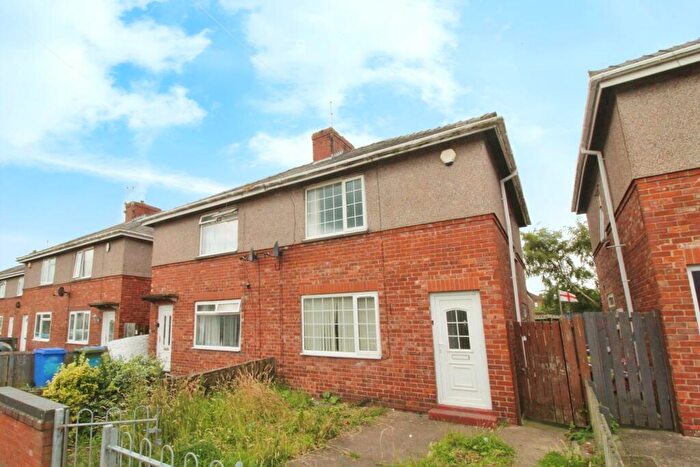
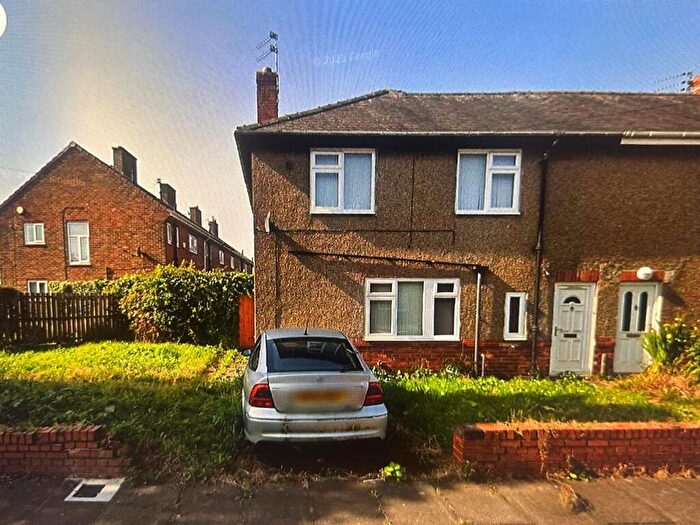
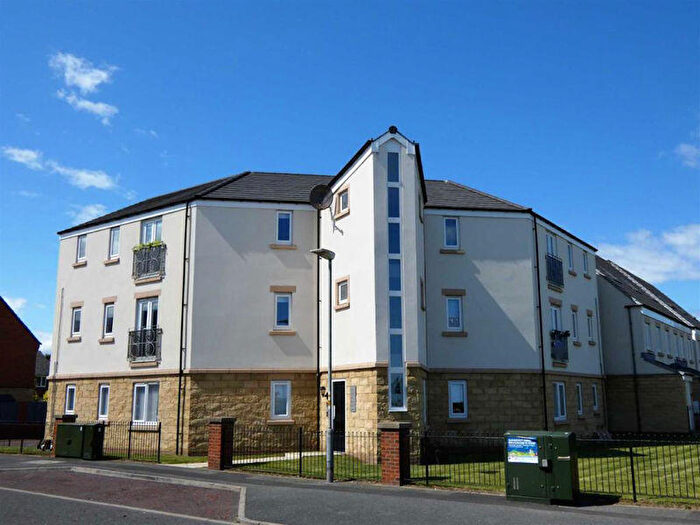
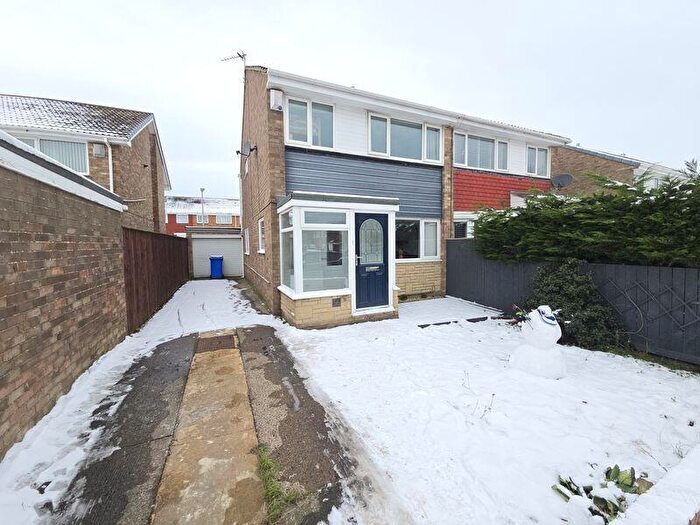
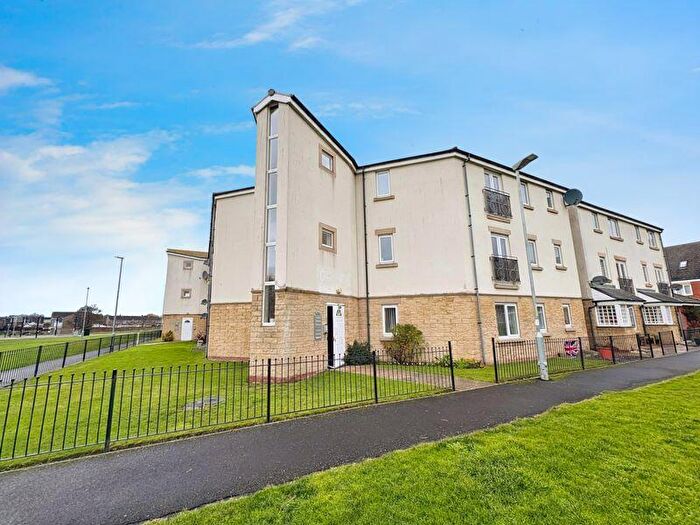
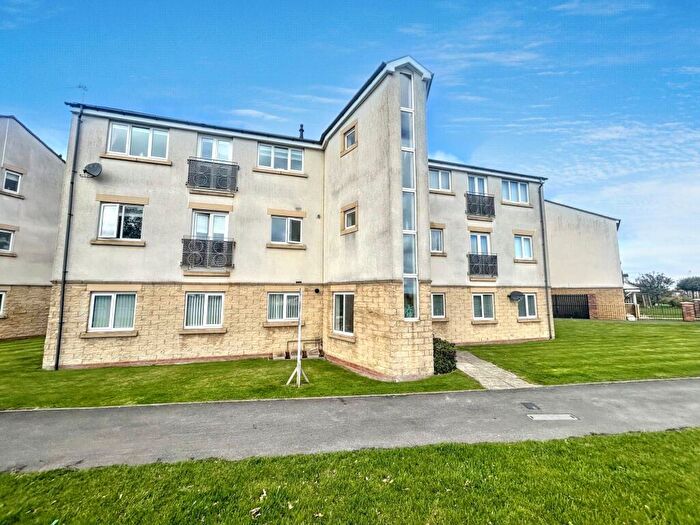
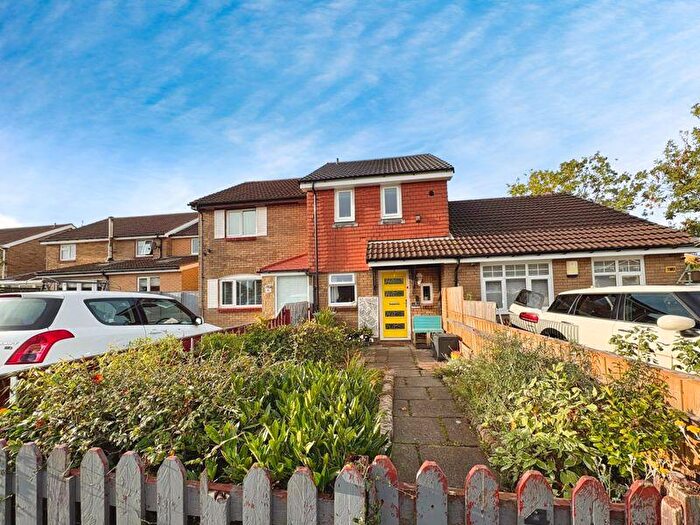
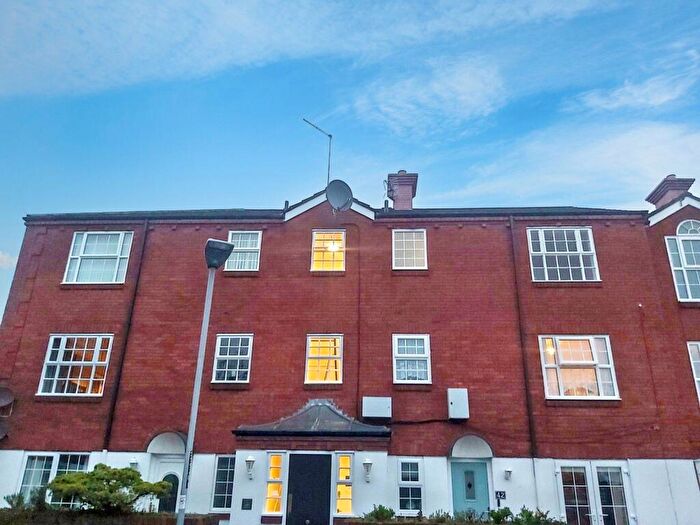
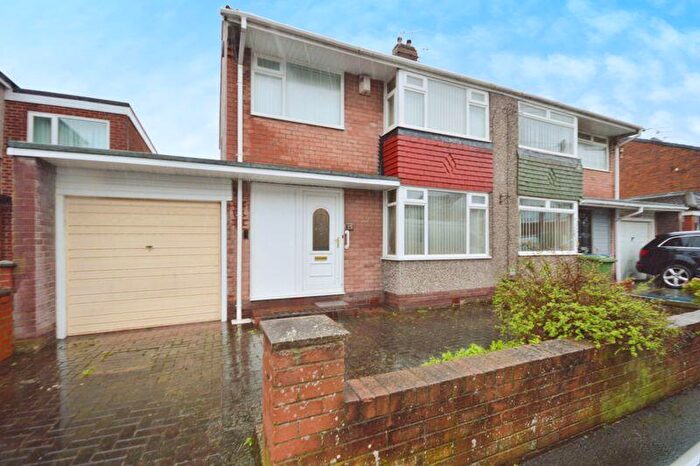
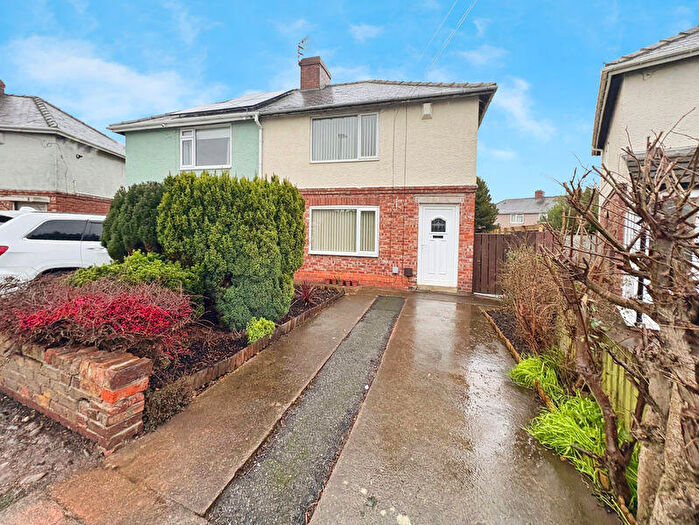
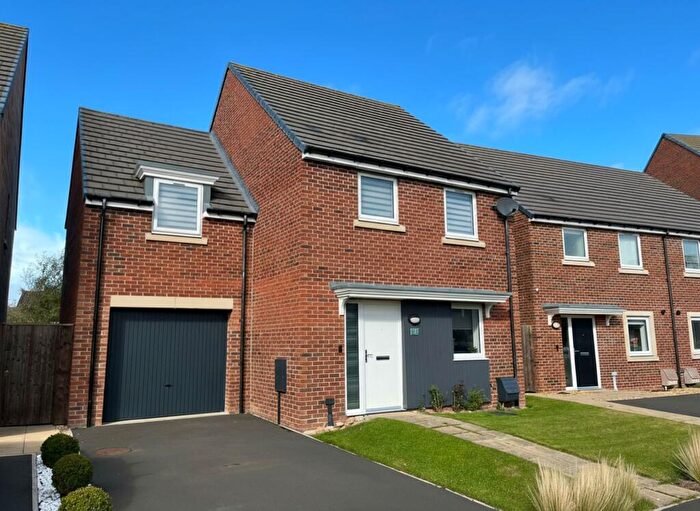
Houses for sale & to rent in South Blyth, Blyth
House Prices in South Blyth
Properties in South Blyth have an average house price of £200,978.00 and had 196 Property Transactions within the last 3 years¹.
South Blyth is an area in Blyth, Northumberland with 1,867 households², where the most expensive property was sold for £415,000.00.
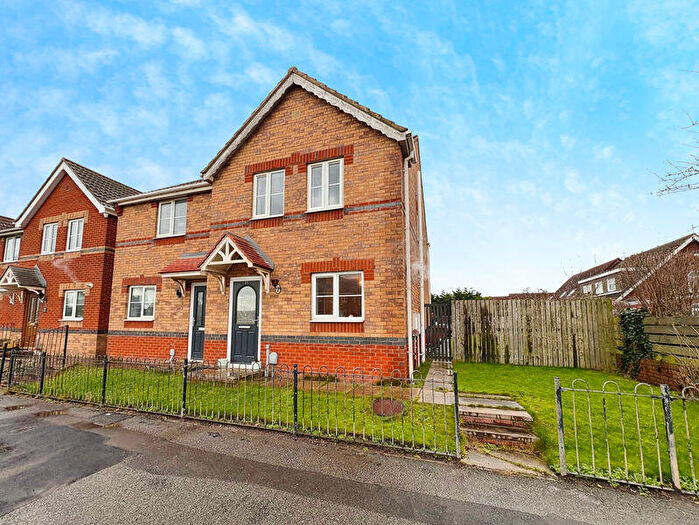
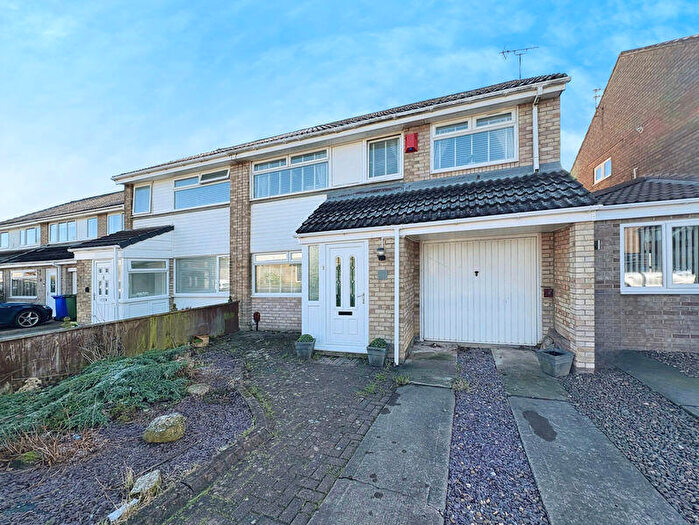
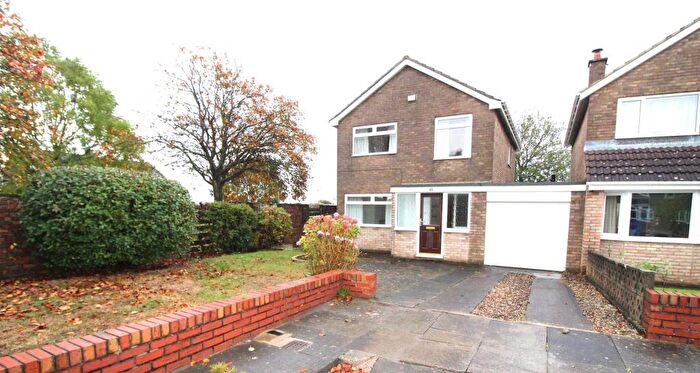
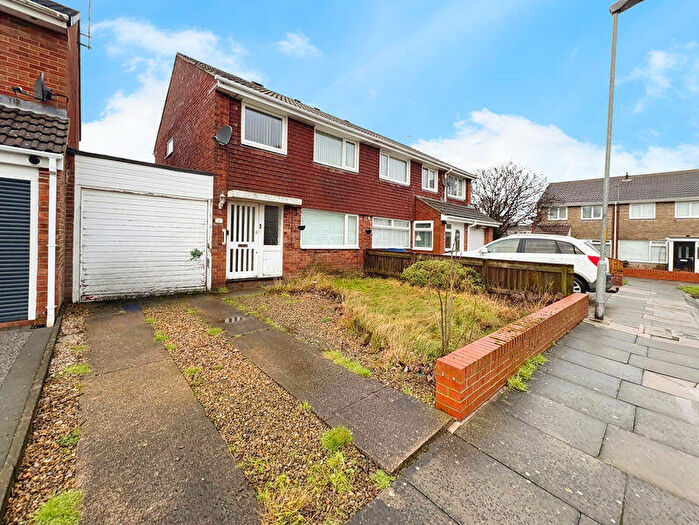
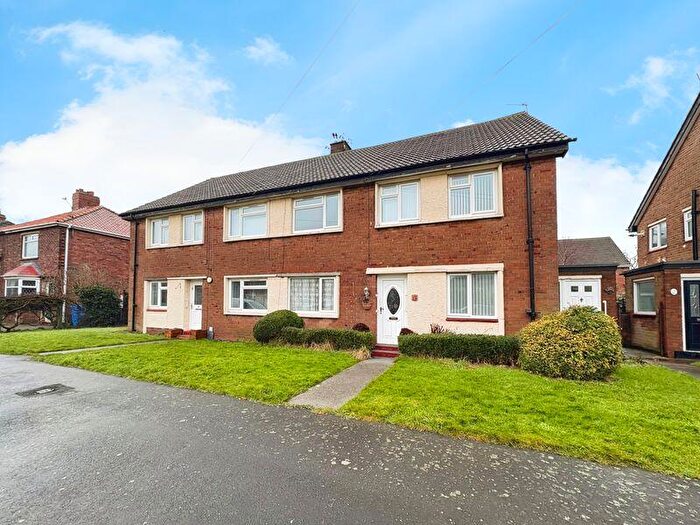
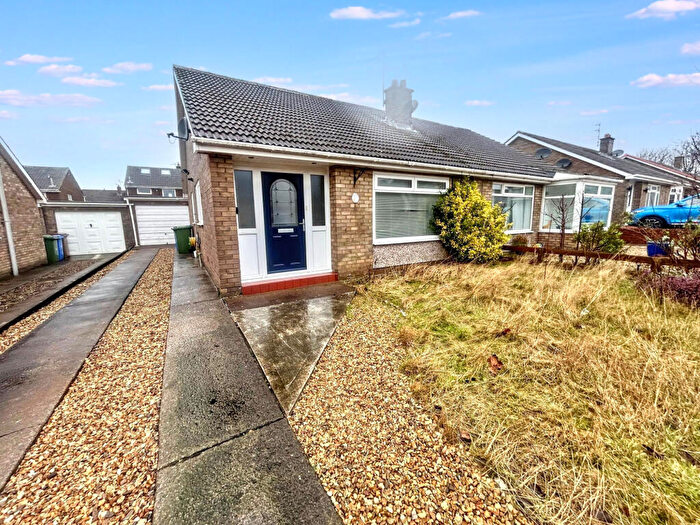
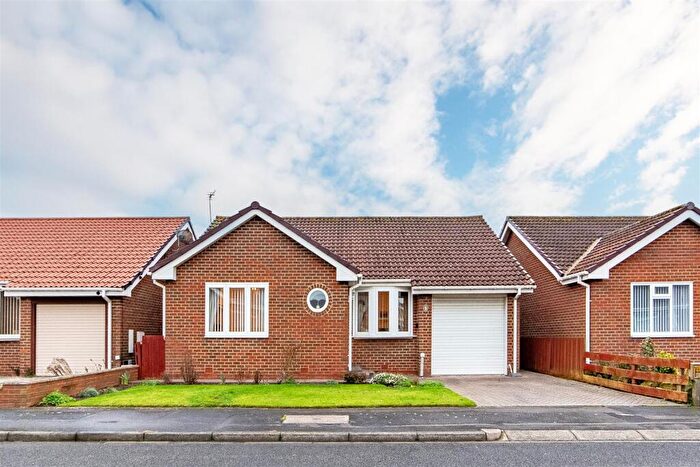
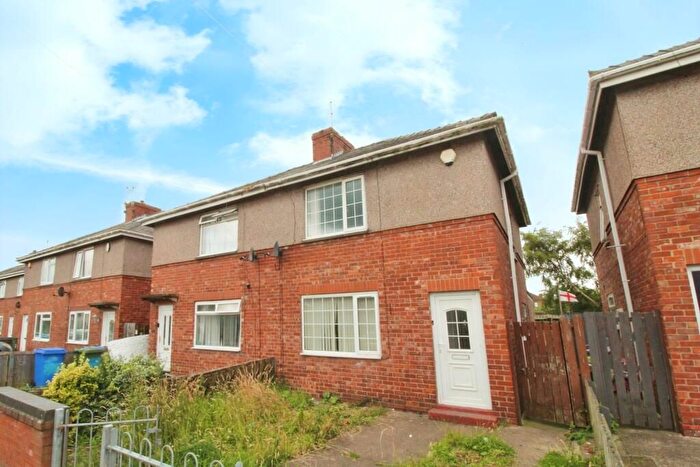
Properties for sale in South Blyth
Previously listed properties in South Blyth
Roads and Postcodes in South Blyth
Navigate through our locations to find the location of your next house in South Blyth, Blyth for sale or to rent.
| Streets | Postcodes |
|---|---|
| Albatross Way | NE24 3QH |
| Almond Grove | NE24 3XX |
| Aspen Way | NE24 3XP |
| Avocet Close | NE24 3RF |
| Blackthorn Drive | NE24 3XW |
| Blagdon Drive | NE24 3NA |
| Blenheim Court | NE24 3XN |
| Bramble Close | NE24 3XS |
| Cedar Grove | NE24 3XT |
| Cormorant Close | NE24 3PY |
| Dalston Place | NE24 3SR |
| Deal Close | NE24 3ST |
| Dewberry Close | NE24 3XJ |
| Dolphin Grove | NE24 3UA |
| Dorking Close | NE24 3LX |
| Downe Close | NE24 3RX |
| Dunblane Drive | NE24 3SW |
| Dunkeld Close | NE24 3SP |
| Earlswood Grove | NE24 3RT |
| Eastwood Avenue | NE24 3RN |
| Eider Close | NE24 3QD |
| Elfin Way | NE24 3RQ |
| Elstree Gardens | NE24 3RW |
| Epsom Way | NE24 3RS |
| Esher Gardens | NE24 3RR |
| Farm Drive | NE24 3BU |
| Foxglove Close | NE24 3XH |
| Fulmar Drive | NE24 3QF NE24 3QG NE24 3RJ |
| Garasdale Close | NE24 3HH |
| Gateley Avenue | NE24 3HG |
| Glendford Place | NE24 3HQ |
| Gosport Way | NE24 3HJ |
| Hadrian Road | NE24 3XA |
| Hampstead Close | NE24 3XE |
| Hedgefield Grove | NE24 3XD |
| Heron Close | NE24 3QQ |
| Herring Gull Close | NE24 3RH |
| Honister Way | NE24 3XB |
| Ingleby Way | NE24 3PD |
| Ingleton Gardens | NE24 3PE |
| Juniper Close | NE24 3XQ |
| Kensington Court | NE24 3XY |
| Kittiwake Close | NE24 3RG |
| Lapwing Close | NE24 3SE |
| Larch Grove | NE24 3XU |
| Links Road | NE24 3PJ NE24 3PL NE24 3PQ NE24 3FE |
| Mallard Way | NE24 3PZ NE24 3QA |
| Mayfield Close | NE24 3BT |
| Meadowsweet Close | NE24 3XG |
| Mulberry Close | NE24 3XR |
| Oberon Way | NE24 3RU |
| Otus Grove | NE24 3RY |
| Otway Grove | NE24 3SS |
| Petrel Way | NE24 3QL |
| Puffin Close | NE24 3QE |
| Rotha Court | NE24 3UF |
| Sandpiper Close | NE24 3QN |
| Sandringham Drive | NE24 3PS |
| Sandringham Meadows | NE24 3AN NE24 3AS NE24 3BD |
| Shearwater Way | NE24 3PU NE24 3PX |
| South Newsham Road | NE24 3PP NE24 3QJ |
| Sweetbriar Way | NE24 3XF |
| Taku Court | NE24 3UH |
| Talisman Way | NE24 3RP |
| Teal Avenue | NE24 3PT |
| Tern Close | NE24 3QB |
| The Pastures | NE24 3HA |
| Trident Drive | NE24 3RL |
| Ultor Court | NE24 3UE |
| Viking Court | NE24 3UG |
| Volary Grove | NE24 3RZ |
| Windsor Drive | NE24 3XL |
Transport near South Blyth
- FAQ
- Price Paid By Year
- Property Type Price
Frequently asked questions about South Blyth
What is the average price for a property for sale in South Blyth?
The average price for a property for sale in South Blyth is £200,978. This amount is 42% higher than the average price in Blyth. There are 1,215 property listings for sale in South Blyth.
What streets have the most expensive properties for sale in South Blyth?
The streets with the most expensive properties for sale in South Blyth are Blenheim Court at an average of £340,000, Windsor Drive at an average of £317,500 and Sweetbriar Way at an average of £294,833.
What streets have the most affordable properties for sale in South Blyth?
The streets with the most affordable properties for sale in South Blyth are Viking Court at an average of £112,500, Taku Court at an average of £115,000 and Ultor Court at an average of £122,439.
Which train stations are available in or near South Blyth?
Some of the train stations available in or near South Blyth are Cramlington, Pegswood and Morpeth.
Property Price Paid in South Blyth by Year
The average sold property price by year was:
| Year | Average Sold Price | Price Change |
Sold Properties
|
|---|---|---|---|
| 2025 | £211,881 | 8% |
51 Properties |
| 2024 | £195,239 | -2% |
82 Properties |
| 2023 | £199,622 | -3% |
63 Properties |
| 2022 | £205,492 | 15% |
85 Properties |
| 2021 | £174,715 | 0,4% |
76 Properties |
| 2020 | £174,065 | 3% |
67 Properties |
| 2019 | £168,621 | -0,4% |
84 Properties |
| 2018 | £169,349 | 10% |
113 Properties |
| 2017 | £153,201 | 4% |
85 Properties |
| 2016 | £146,500 | -8% |
93 Properties |
| 2015 | £158,770 | 5% |
86 Properties |
| 2014 | £150,357 | 0,5% |
97 Properties |
| 2013 | £149,652 | -5% |
104 Properties |
| 2012 | £157,537 | 5% |
79 Properties |
| 2011 | £148,978 | -10% |
85 Properties |
| 2010 | £163,534 | -1% |
92 Properties |
| 2009 | £164,693 | -3% |
64 Properties |
| 2008 | £170,057 | 0,3% |
89 Properties |
| 2007 | £169,527 | 14% |
207 Properties |
| 2006 | £146,369 | -1% |
114 Properties |
| 2005 | £147,908 | 1% |
66 Properties |
| 2004 | £146,956 | 19% |
81 Properties |
| 2003 | £118,591 | 25% |
144 Properties |
| 2002 | £88,646 | 10% |
219 Properties |
| 2001 | £79,543 | 9% |
165 Properties |
| 2000 | £72,722 | 13% |
122 Properties |
| 1999 | £63,059 | 1% |
145 Properties |
| 1998 | £62,360 | 5% |
119 Properties |
| 1997 | £59,515 | -6% |
111 Properties |
| 1996 | £63,196 | 11% |
83 Properties |
| 1995 | £56,034 | - |
102 Properties |
Property Price per Property Type in South Blyth
Here you can find historic sold price data in order to help with your property search.
The average Property Paid Price for specific property types in the last three years are:
| Property Type | Average Sold Price | Sold Properties |
|---|---|---|
| Semi Detached House | £174,296.00 | 79 Semi Detached Houses |
| Detached House | £265,201.00 | 74 Detached Houses |
| Terraced House | £156,146.00 | 27 Terraced Houses |
| Flat | £111,345.00 | 16 Flats |

