Houses for sale & to rent in Isabella, Blyth
House Prices in Isabella
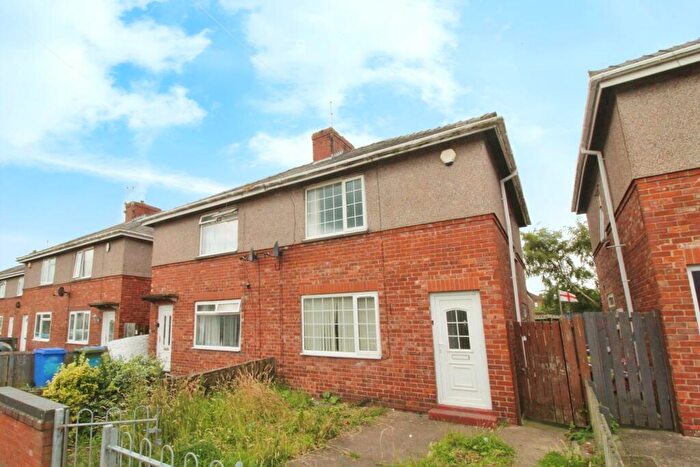
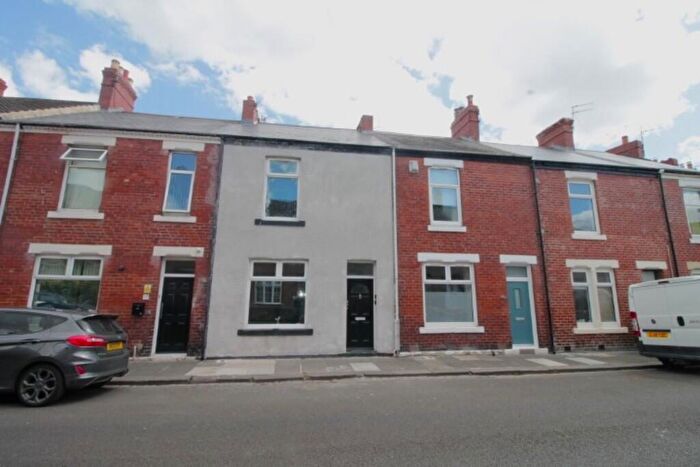
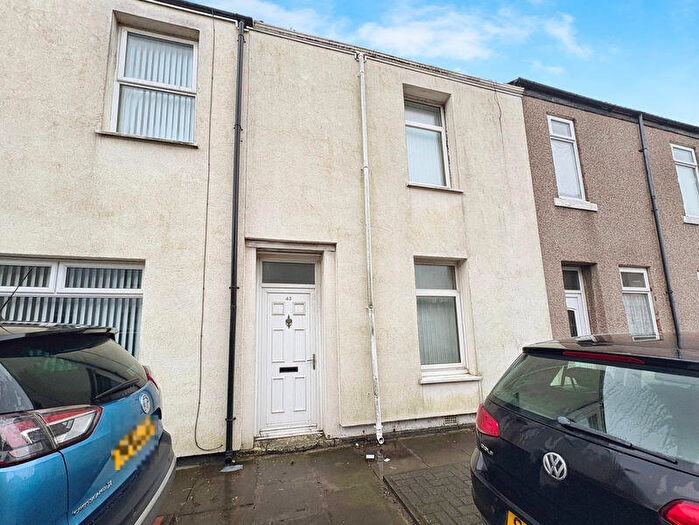
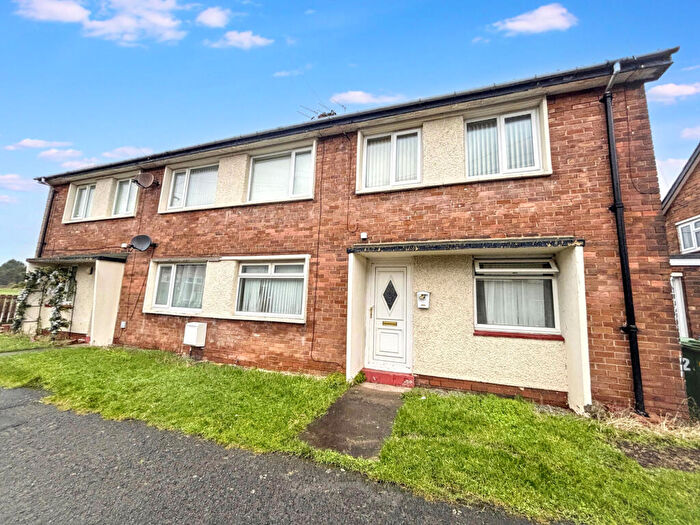
Properties in Isabella have an average house price of £93,176.00 and had 136 Property Transactions within the last 3 years¹.
Isabella is an area in Blyth, Northumberland with 2,147 households², where the most expensive property was sold for £227,600.00.
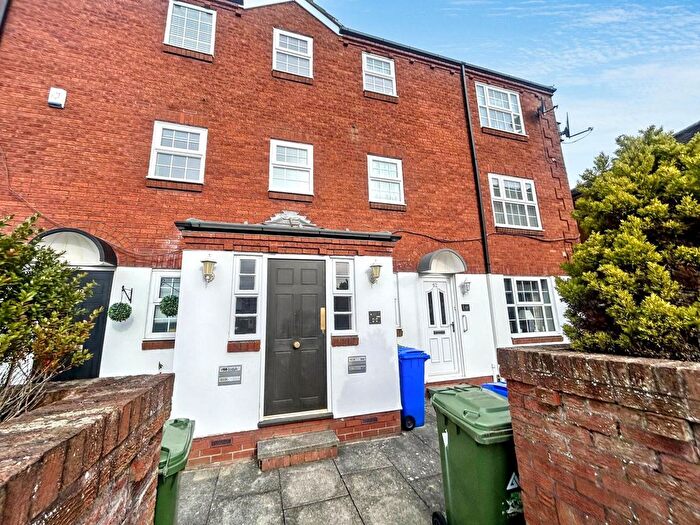
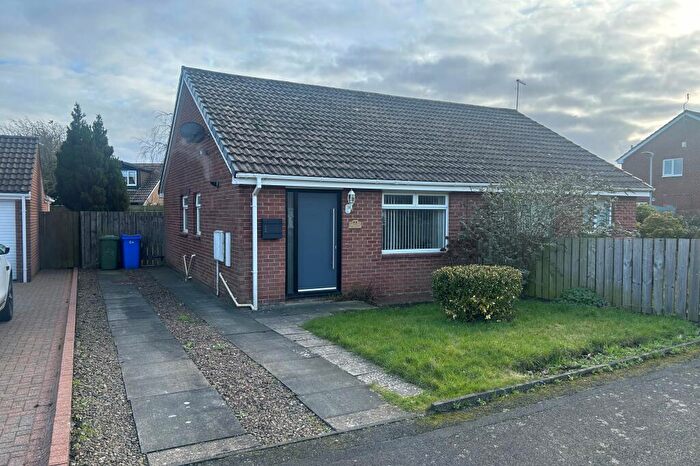
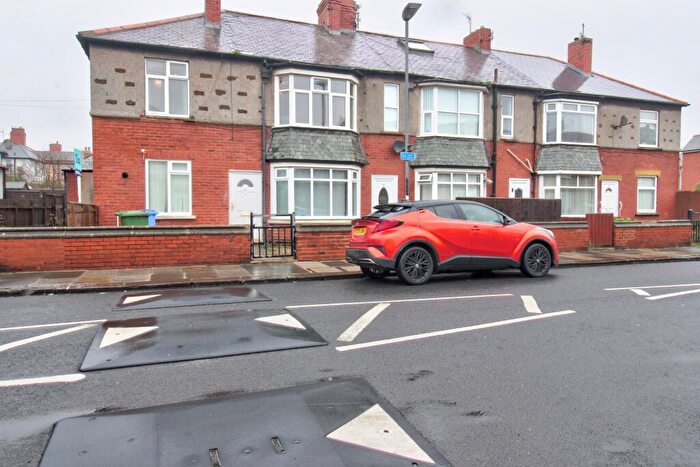
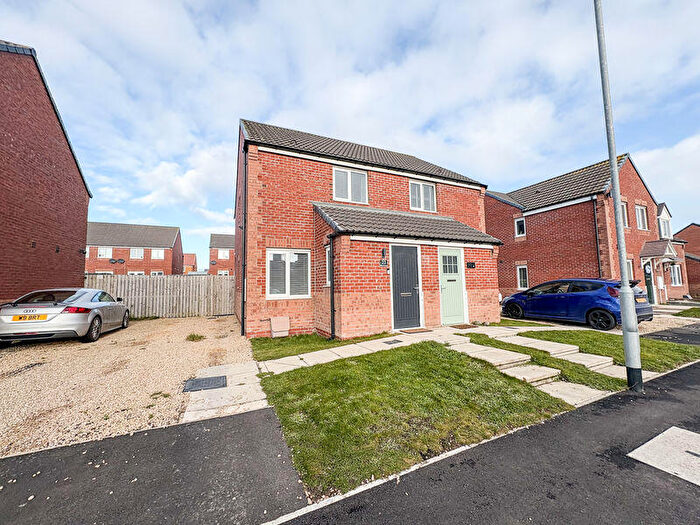
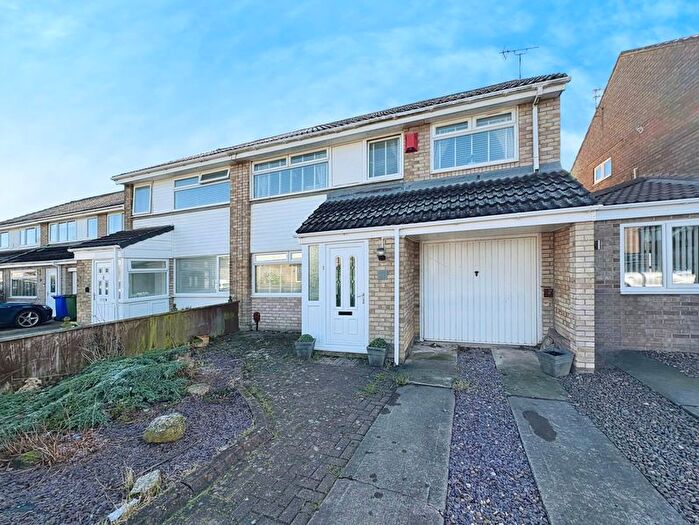
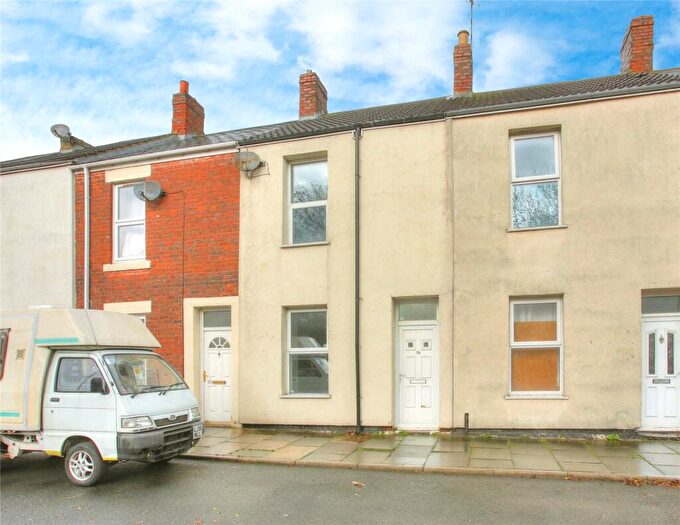
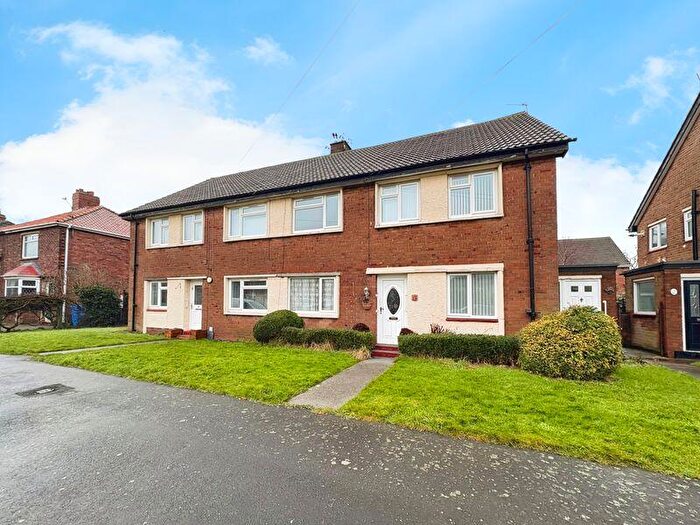
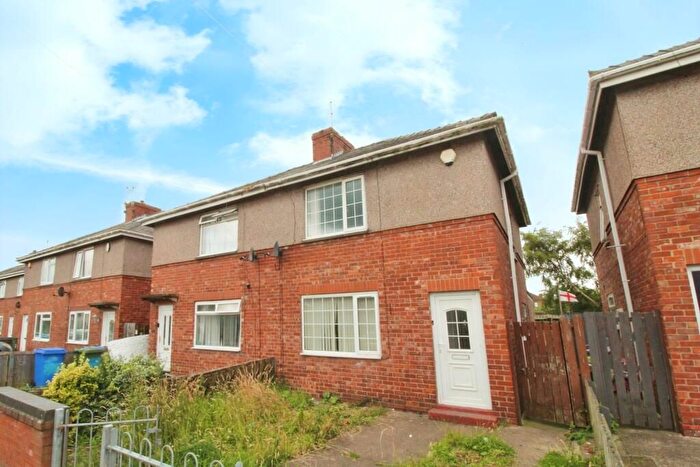
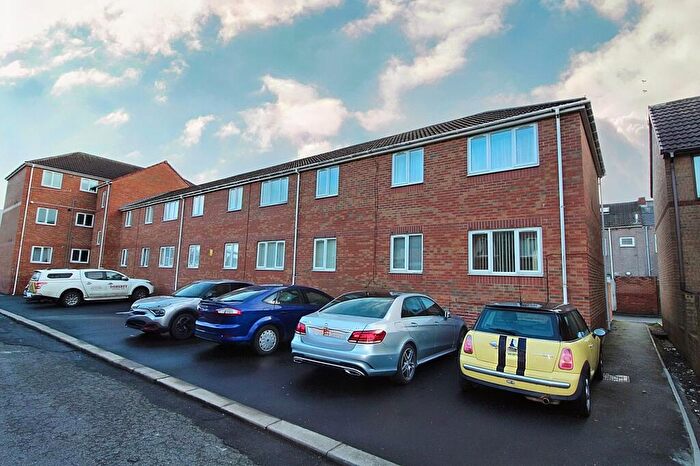
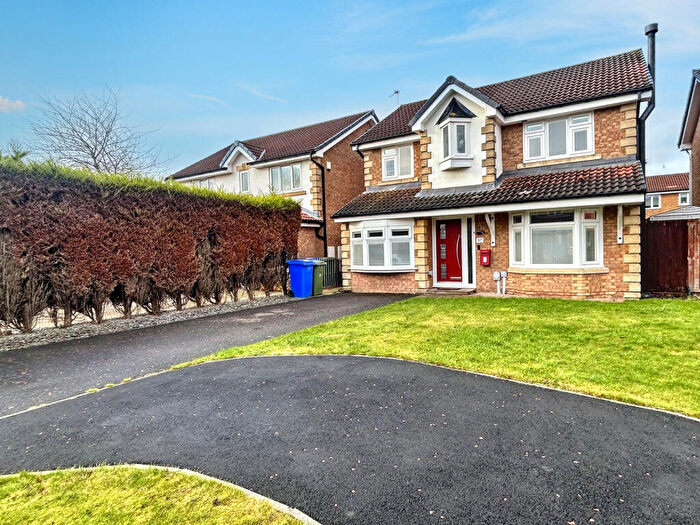
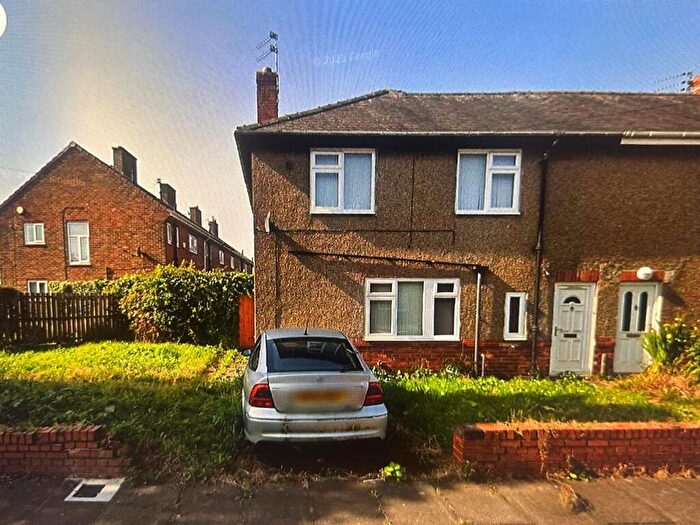
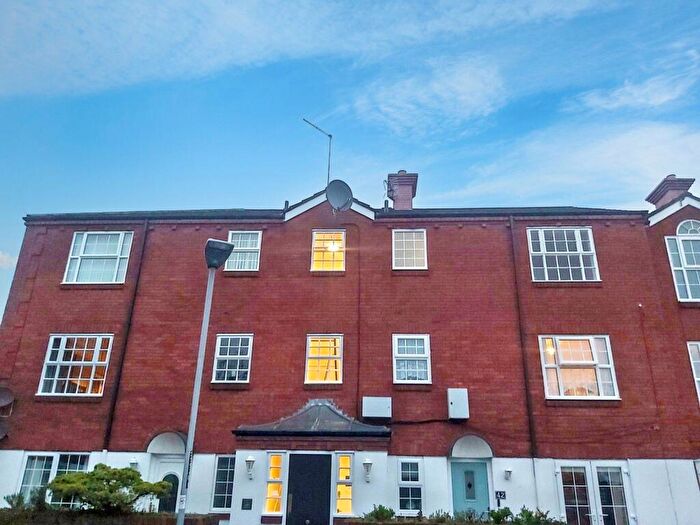
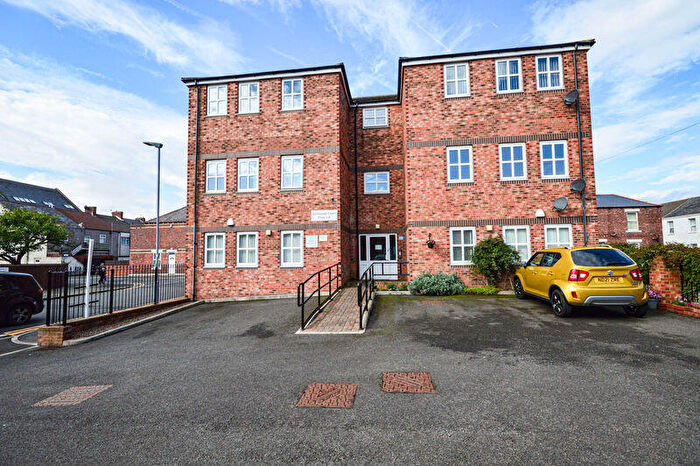
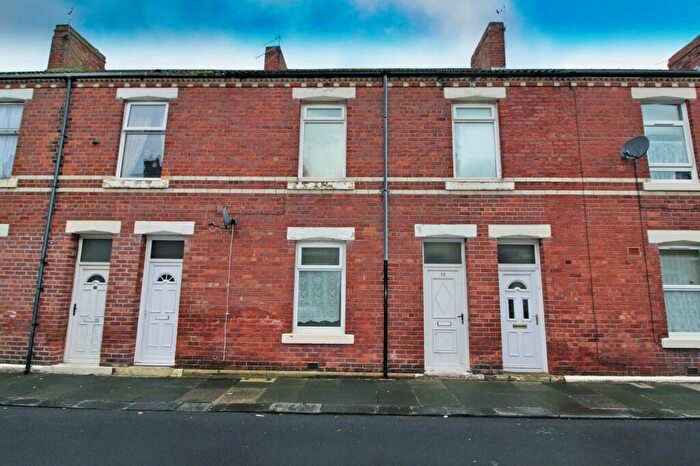
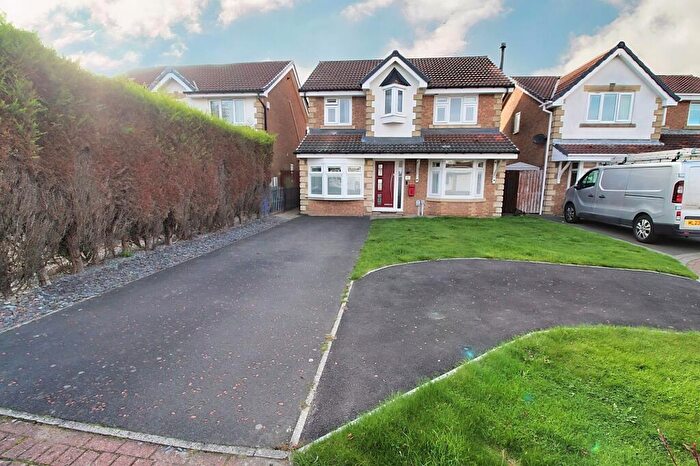
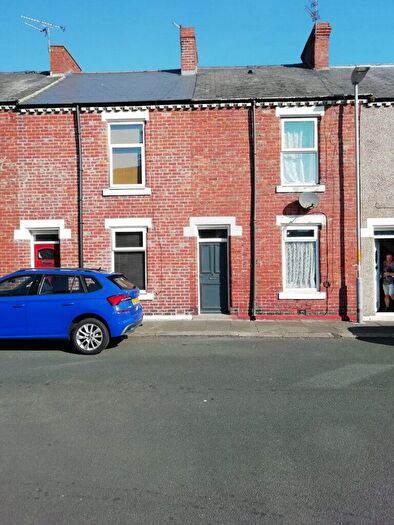
Properties for sale in Isabella
Roads and Postcodes in Isabella
Navigate through our locations to find the location of your next house in Isabella, Blyth for sale or to rent.
| Streets | Postcodes |
|---|---|
| Abbie Court | NE24 2JU |
| Amber Court | NE24 5RU |
| Bebdon Court | NE24 5RY |
| Broadway | NE24 2PN NE24 2PW |
| Broadway Circle | NE24 2PG |
| Burns Avenue | NE24 5RQ |
| Byron Avenue | NE24 5RN |
| Chancery Lane | NE24 2LB |
| Charlton Street | NE24 2LF |
| Chester Grove | NE24 5SH NE24 5SJ NE24 5SL NE24 5SN |
| Civic Centre | NE24 2BX |
| Claremont Terrace | NE24 2LE |
| Eighteenth Avenue | NE24 2UQ |
| Eighth Avenue | NE24 2QE NE24 2QG NE24 2QF |
| Fallow Park Avenue | NE24 5RS NE24 5RT |
| Fifth Avenue | NE24 2SR |
| First Avenue | NE24 2SB NE24 2SD NE24 2SE NE24 2SF |
| Ford Drive | NE24 5EQ |
| Fourteenth Avenue | NE24 2QQ |
| Fourth Avenue | NE24 2SP NE24 2SJ |
| Hargrave Court | NE24 5TN |
| Harper Street | NE24 2RJ |
| Haven Court | NE24 5RX |
| Hepple Court | NE24 5EN |
| Isabella Road | NE24 5RR |
| Jubilee Court | NE24 2TF |
| Keats Avenue | NE24 5RL |
| Kendal Avenue | NE24 5RE |
| Leaholme Crescent | NE24 5SF NE24 5SG |
| Lynn Street | NE24 2JT |
| Marlow Street | NE24 2RH NE24 2RQ |
| Mitford Avenue | NE24 5SQ |
| Newsham Road | NE24 5QX NE24 5QY NE24 5QZ NE24 5RA NE24 5RB NE24 5RD NE24 5TH NE24 5TJ NE24 5TL NE24 5QU |
| Norham Close | NE24 5EJ NE24 5EL |
| Ogle Drive | NE24 5EH NE24 5JF |
| Plessey Road | NE24 3RD NE24 3RE |
| Princess Louise Road | NE24 2TS |
| Railway Terrace | NE24 2LD NE24 2RF |
| Regent Court | NE24 2LT |
| Renwick Road | NE24 2LQ NE24 2NX NE24 2RG |
| Rosebery Avenue | NE24 2LJ |
| Rutherford Street | NE24 2LG |
| Second Avenue | NE24 2SG NE24 2SQ NE24 2SH |
| Shelley Crescent | NE24 5RH NE24 5RJ |
| Sidney Street | NE24 2RD NE24 2RE |
| Sixth Avenue | NE24 2SS NE24 2SY NE24 2SX |
| Southend Avenue | NE24 5RW |
| Third Avenue | NE24 2SA |
| Thropton Court | NE24 5EW |
| Trevelyan Avenue | NE24 5SB NE24 5SD NE24 5SE |
| Twelfth Avenue | NE24 2QD |
| Twentieth Avenue | NE24 2TT NE24 2TU NE24 2UB |
| Twentyfifth Avenue | NE24 2UG |
| Twentysecond Avenue | NE24 2UE |
| Twentysixth Avenue | NE24 2UF |
| Twentythird Avenue | NE24 2UD |
| Victoria Mews | NE24 2TR |
| West Court | NE24 5RZ |
| Wordsworth Avenue | NE24 5RF NE24 5RG |
Transport near Isabella
- FAQ
- Price Paid By Year
- Property Type Price
Frequently asked questions about Isabella
What is the average price for a property for sale in Isabella?
The average price for a property for sale in Isabella is £93,176. This amount is 34% lower than the average price in Blyth. There are 1,832 property listings for sale in Isabella.
What streets have the most expensive properties for sale in Isabella?
The streets with the most expensive properties for sale in Isabella are Rosebery Avenue at an average of £227,600, Broadway at an average of £159,750 and Haven Court at an average of £156,500.
What streets have the most affordable properties for sale in Isabella?
The streets with the most affordable properties for sale in Isabella are Railway Terrace at an average of £32,500, West Court at an average of £44,500 and Sidney Street at an average of £52,000.
Which train stations are available in or near Isabella?
Some of the train stations available in or near Isabella are Cramlington, Pegswood and Morpeth.
Property Price Paid in Isabella by Year
The average sold property price by year was:
| Year | Average Sold Price | Price Change |
Sold Properties
|
|---|---|---|---|
| 2025 | £100,133 | 5% |
37 Properties |
| 2024 | £95,325 | 9% |
47 Properties |
| 2023 | £86,283 | -3% |
52 Properties |
| 2022 | £89,160 | 7% |
47 Properties |
| 2021 | £82,580 | 13% |
67 Properties |
| 2020 | £71,865 | -5% |
46 Properties |
| 2019 | £75,353 | 7% |
48 Properties |
| 2018 | £70,043 | -8% |
39 Properties |
| 2017 | £75,459 | 3% |
32 Properties |
| 2016 | £73,532 | 0,3% |
54 Properties |
| 2015 | £73,336 | 3% |
46 Properties |
| 2014 | £71,282 | 8% |
38 Properties |
| 2013 | £65,330 | -19% |
33 Properties |
| 2012 | £78,002 | 7% |
24 Properties |
| 2011 | £72,231 | -10% |
32 Properties |
| 2010 | £79,515 | 8% |
28 Properties |
| 2009 | £72,815 | -17% |
18 Properties |
| 2008 | £85,366 | -11% |
34 Properties |
| 2007 | £94,783 | 16% |
82 Properties |
| 2006 | £79,275 | 1% |
72 Properties |
| 2005 | £78,284 | 9% |
82 Properties |
| 2004 | £70,851 | 25% |
82 Properties |
| 2003 | £53,238 | 29% |
97 Properties |
| 2002 | £37,640 | 10% |
77 Properties |
| 2001 | £33,929 | 15% |
55 Properties |
| 2000 | £28,856 | -8% |
31 Properties |
| 1999 | £31,158 | -24% |
72 Properties |
| 1998 | £38,765 | 31% |
64 Properties |
| 1997 | £26,619 | -5% |
24 Properties |
| 1996 | £27,973 | 1% |
28 Properties |
| 1995 | £27,622 | - |
29 Properties |
Property Price per Property Type in Isabella
Here you can find historic sold price data in order to help with your property search.
The average Property Paid Price for specific property types in the last three years are:
| Property Type | Average Sold Price | Sold Properties |
|---|---|---|
| Semi Detached House | £106,200.00 | 54 Semi Detached Houses |
| Detached House | £140,000.00 | 1 Detached House |
| Terraced House | £97,559.00 | 54 Terraced Houses |
| Flat | £56,629.00 | 27 Flats |

