
Houses for sale & to rent in NE65 7QE, Addycombe Crescent, Rothbury, Morpeth
House Prices in NE65 7QE, Addycombe Crescent, Rothbury
Properties in NE65 7QE have an average house price of £185k and had 1 Property Transaction within the last 3 years.¹ NE65 7QE is a postcode in Addycombe Crescent located in Rothbury, an area in Morpeth, Northumberland, with 4 households², where the most expensive property was sold for £185k.
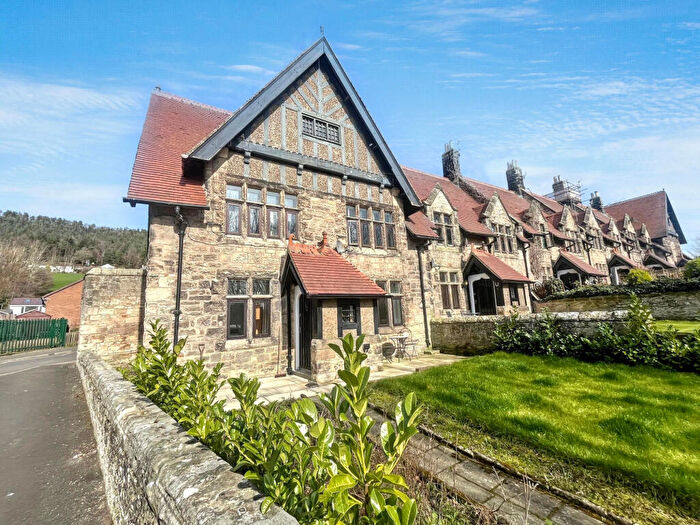
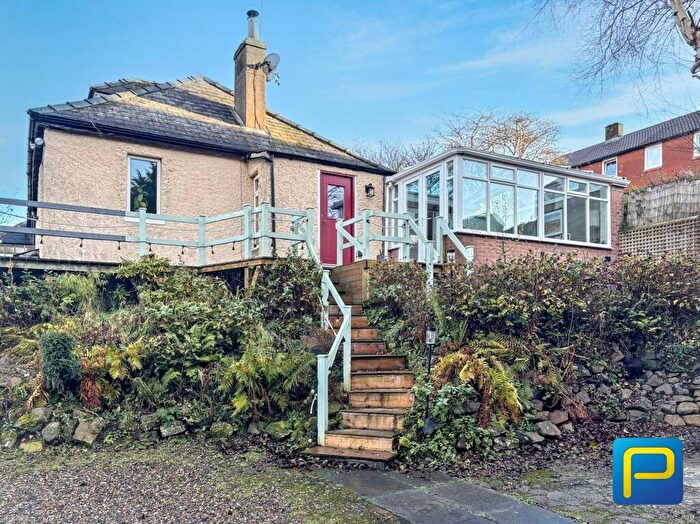
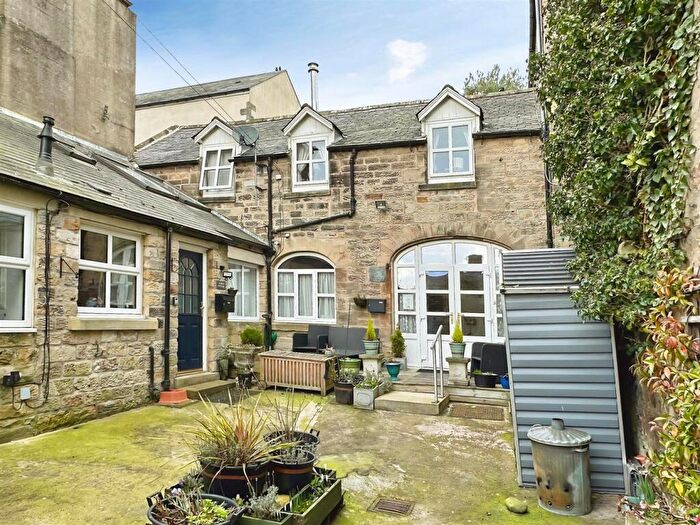
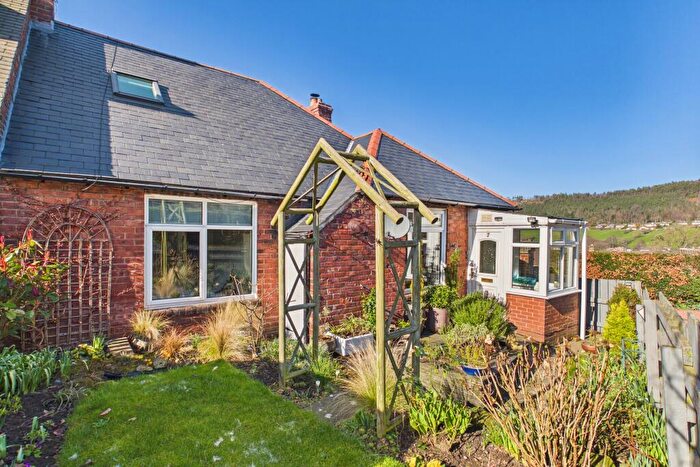
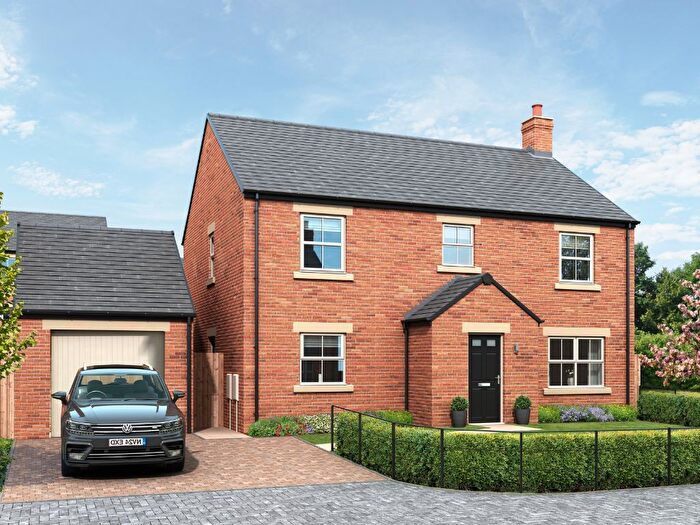
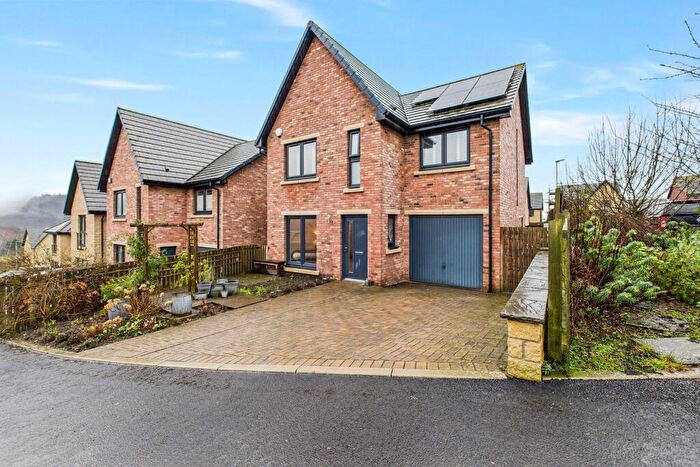
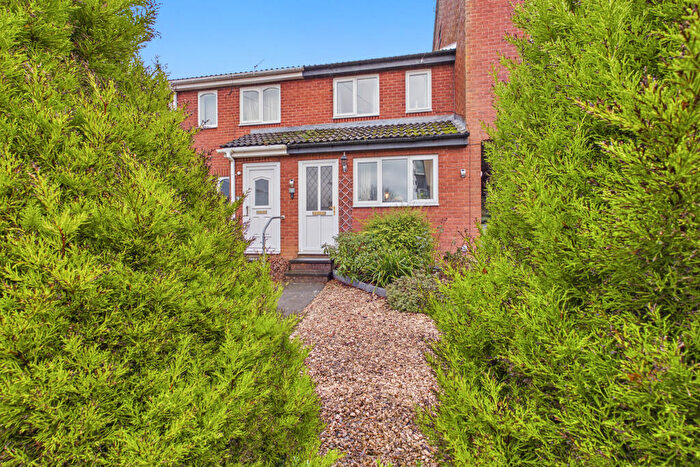
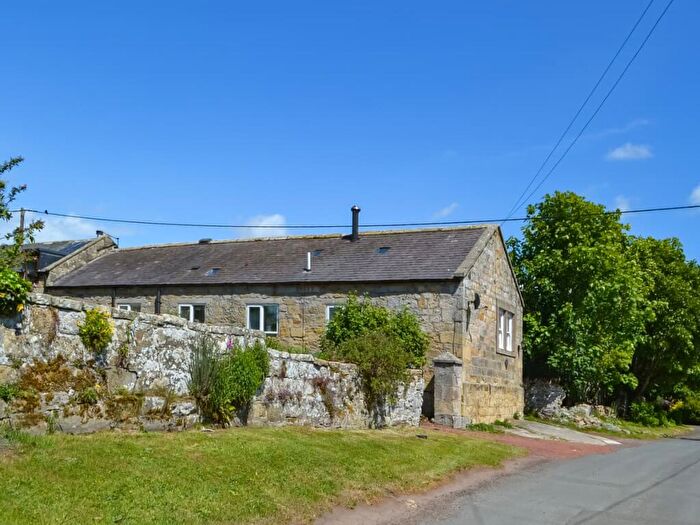
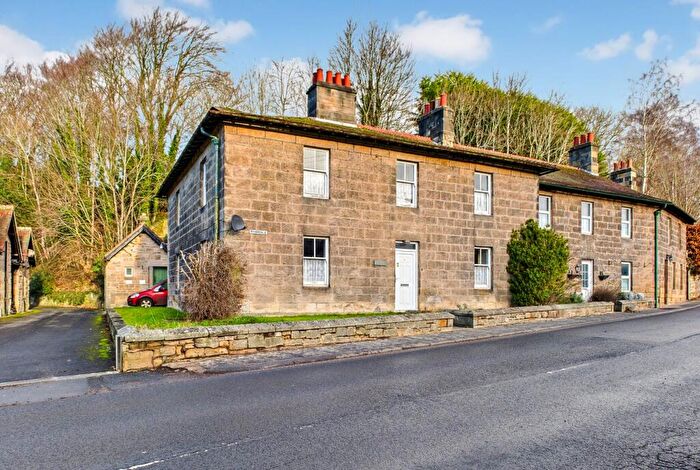
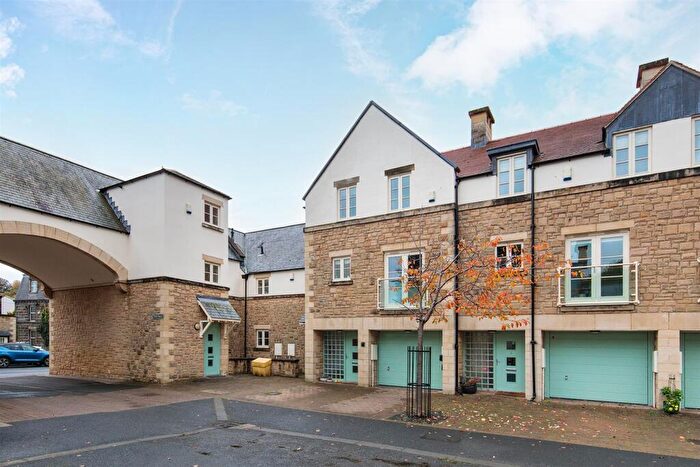
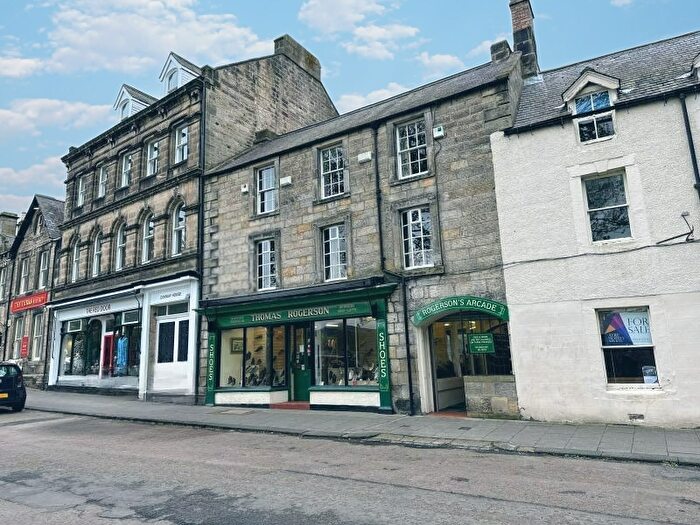
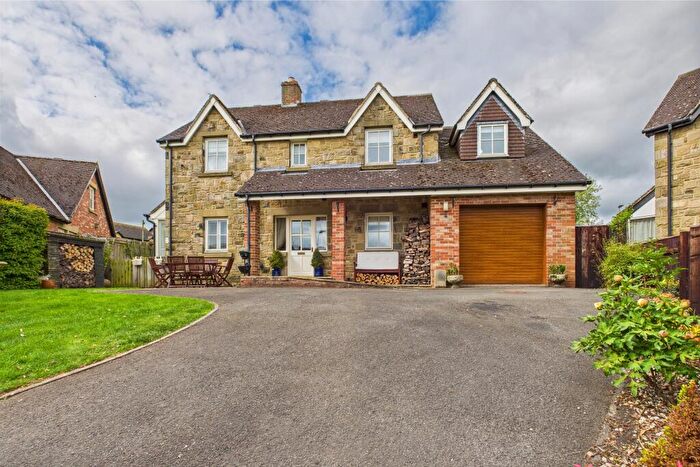
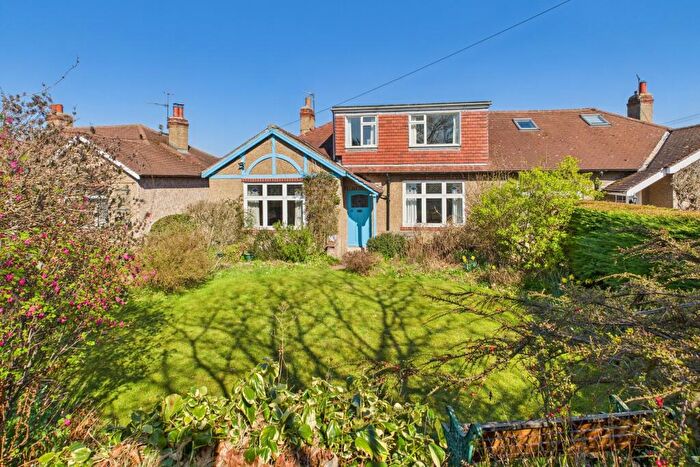
Properties for sale near NE65 7QE, Addycombe Crescent
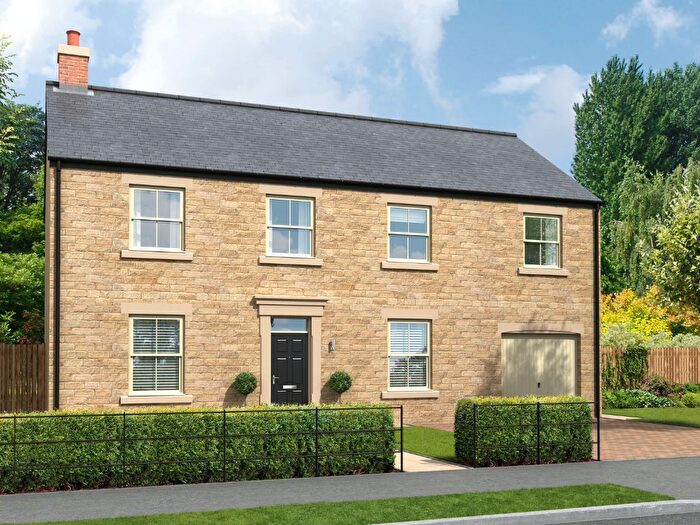
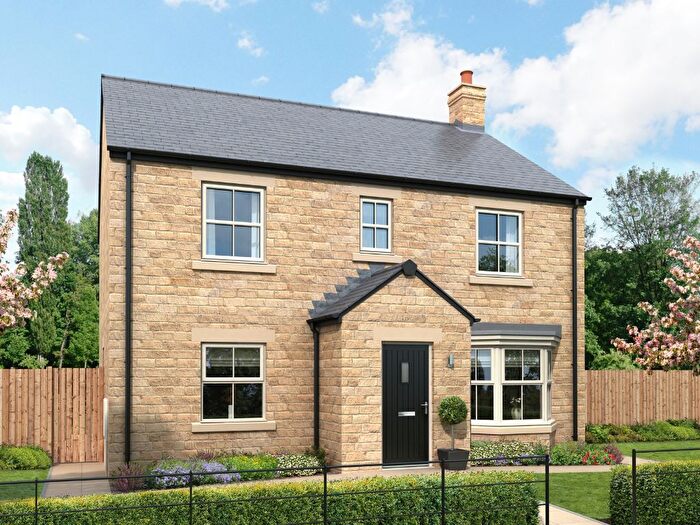
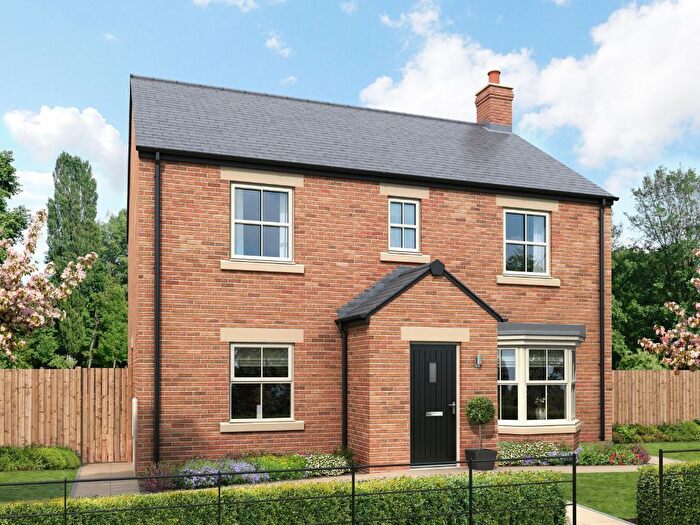
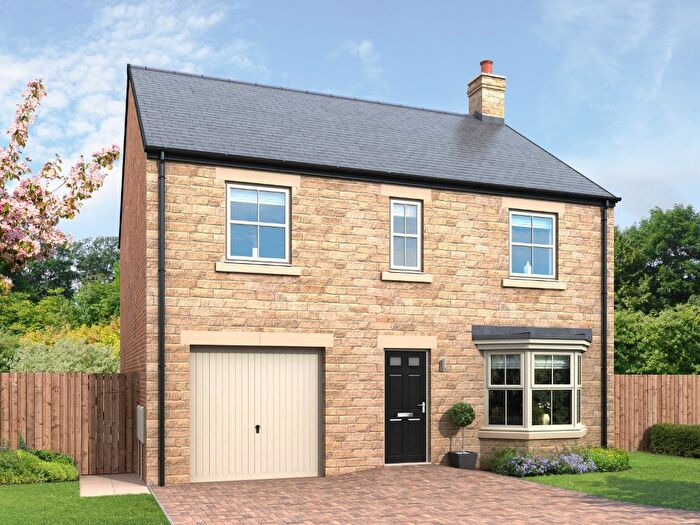
![]()
If you are looking to sell your house, let it out, or receive a property valuation, an expert can help you.
Click the button below to get started.

Price Paid in Addycombe Crescent, NE65 7QE, Rothbury
3 Addycombe Crescent, NE65 7QE, Rothbury Morpeth
Property 3 has been sold 2 times. The last time it was sold was in 28/02/2025 and the sold price was £185,000.00.
This terraced house, sold as a freehold on 28/02/2025, is a 77 sqm mid-terrace house with an EPC rating of C.
| Date | Price | Property Type | Tenure | Classification |
|---|---|---|---|---|
| 28/02/2025 | £185,000.00 | Terraced House | freehold | Established Building |
| 12/06/2015 | £125,000.00 | Terraced House | freehold | Established Building |
5 Addycombe Crescent, NE65 7QE, Rothbury Morpeth
Property 5 has been sold 2 times. The last time it was sold was in 17/05/2019 and the sold price was £130,000.00.
This terraced house, sold as a freehold on 17/05/2019, is a 81 sqm mid-terrace house with an EPC rating of D.
| Date | Price | Property Type | Tenure | Classification |
|---|---|---|---|---|
| 17/05/2019 | £130,000.00 | Terraced House | freehold | Established Building |
| 26/05/2006 | £157,000.00 | Terraced House | freehold | Established Building |
1 Addycombe Crescent Rothbury, NE65 7QE, Rothbury Morpeth
This is a 93 square meter End-terrace House with an EPC rating of C. Currently, there is no transaction history available for this property.
Transport near NE65 7QE, Addycombe Crescent

House price paid reports for NE65 7QE, Addycombe Crescent
Click on the buttons below to see price paid reports by year or property price:
- Price Paid By Year
- Property Type Price
Property Price Paid in NE65 7QE, Addycombe Crescent by Year
The average sold property price by year was:
| Year | Average Sold Price | Price Change |
Sold Properties
|
|---|---|---|---|
| 2025 | £185,000 | 30% |
1 Property |
| 2019 | £130,000 | 4% |
1 Property |
| 2015 | £125,000 | -26% |
1 Property |
| 2006 | £157,000 | - |
1 Property |
Property Price per Property Type in NE65 7QE, Addycombe Crescent
Here you can find historic sold price data in order to help with your property search.
The average Property Paid Price for specific property types in the last three years are:
| Property Type | Average Sold Price | Sold Properties |
|---|---|---|
| Terraced House | £185,000.00 | 1 Terraced House |