
Houses for sale & to rent in NE65 9QU, Kenmore Croft, Shilbottle, Morpeth
House Prices in NE65 9QU, Kenmore Croft, Shilbottle
Properties in NE65 9QU have an average house price of £400k and had 1 Property Transaction within the last 3 years.¹ NE65 9QU is a postcode in Kenmore Croft located in Shilbottle, an area in Morpeth, Northumberland, with 4 households², where the most expensive property was sold for £400k.
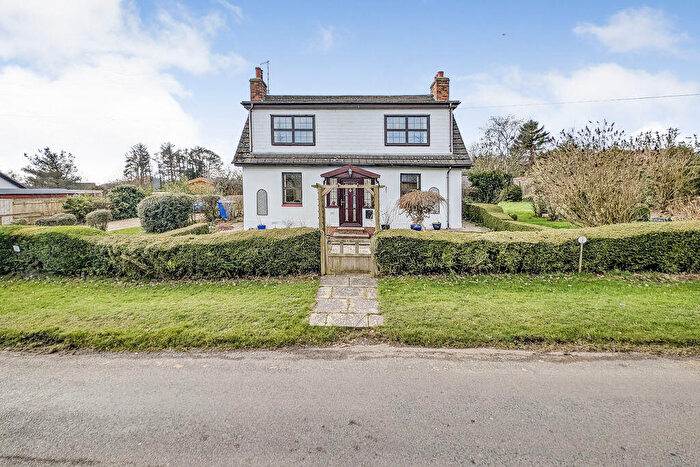
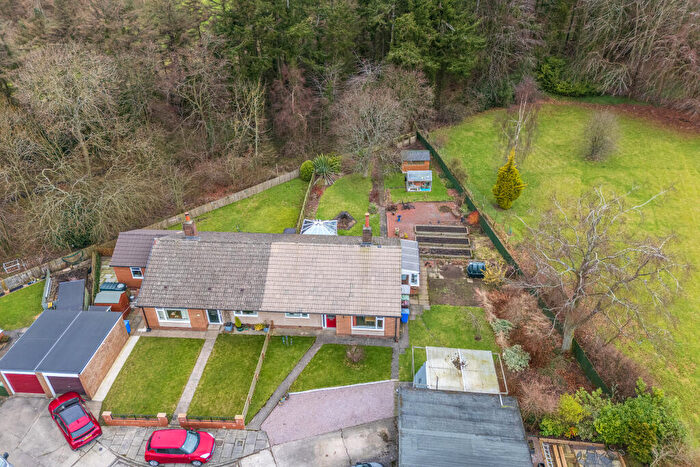
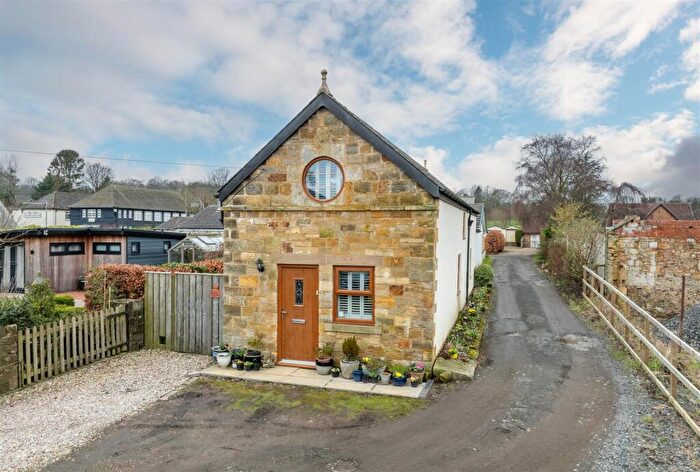
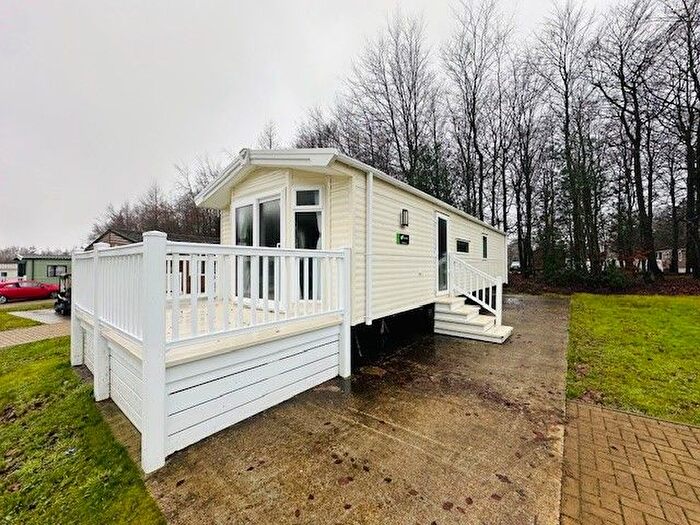
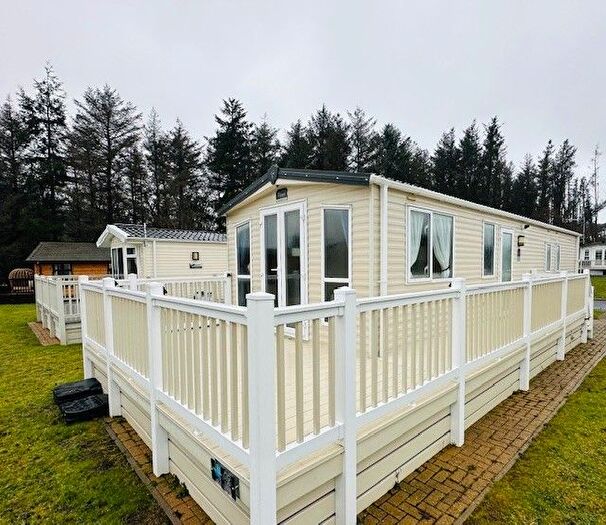
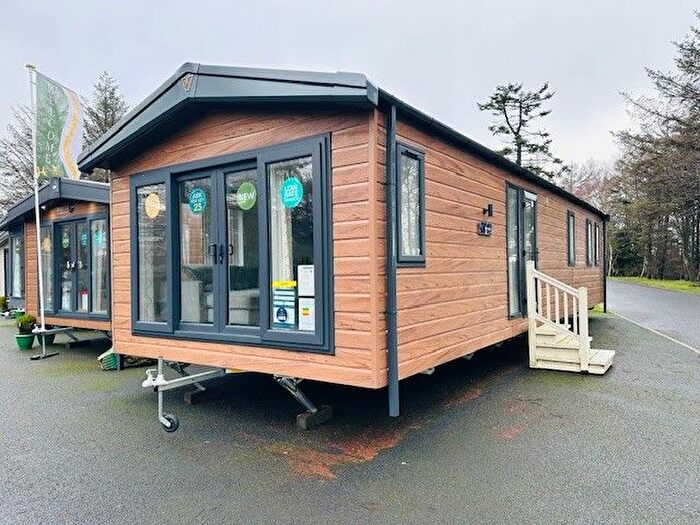
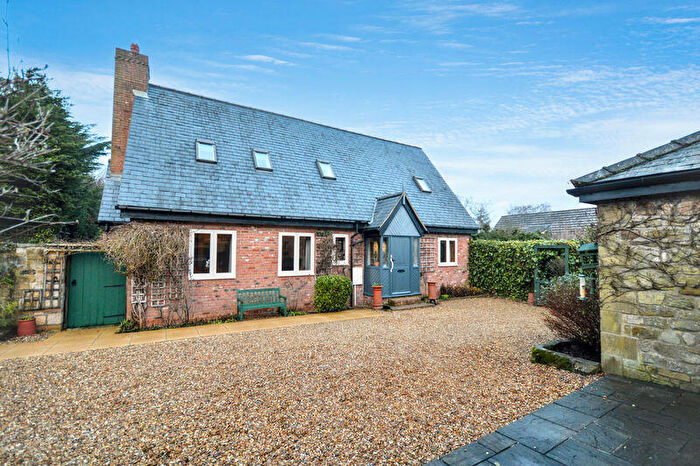
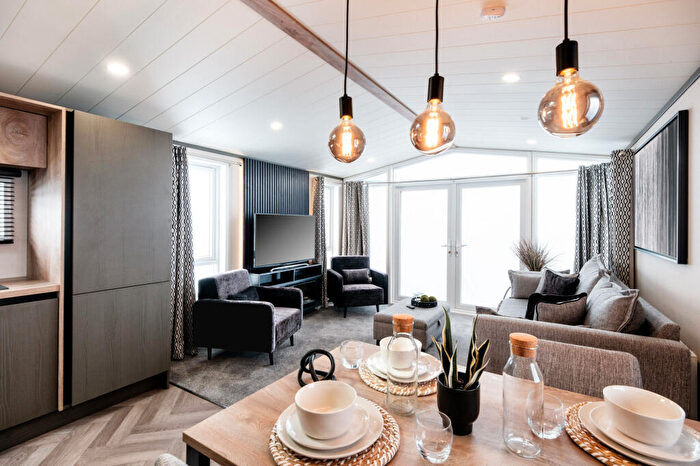
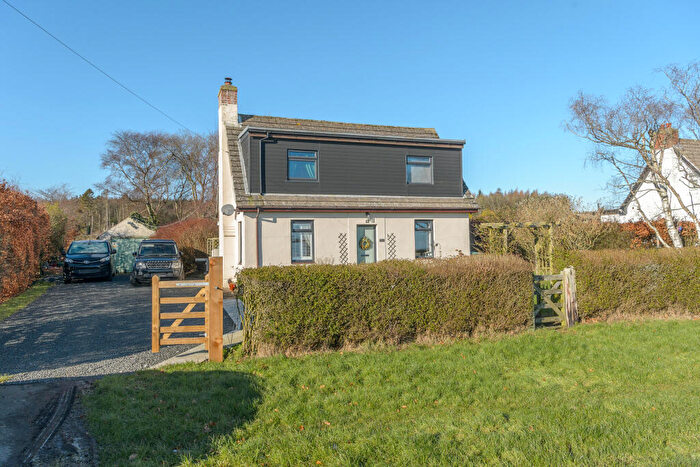
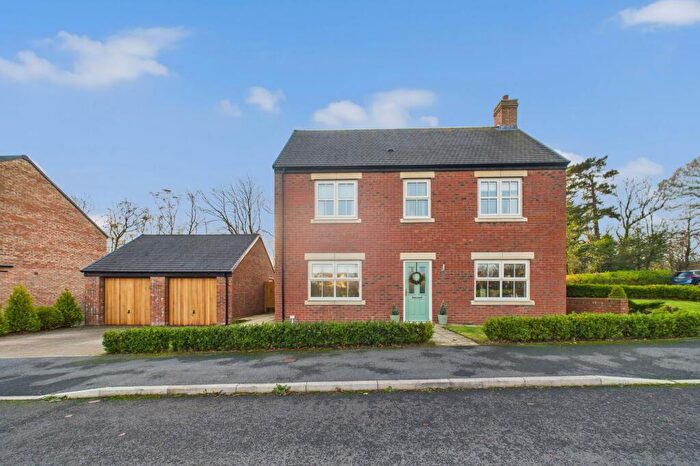
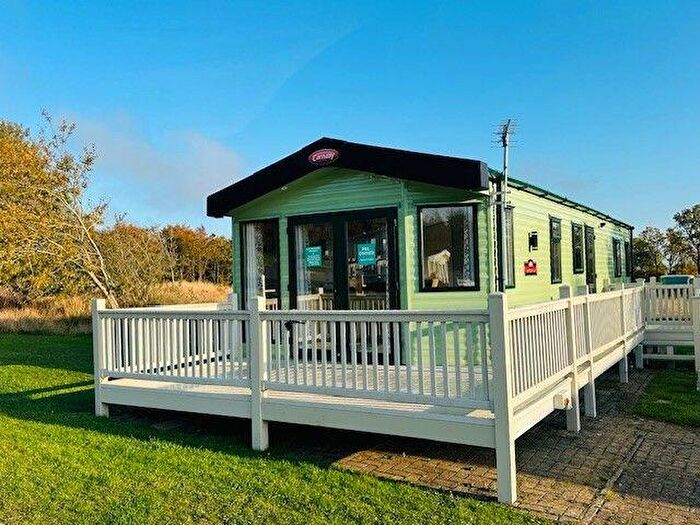
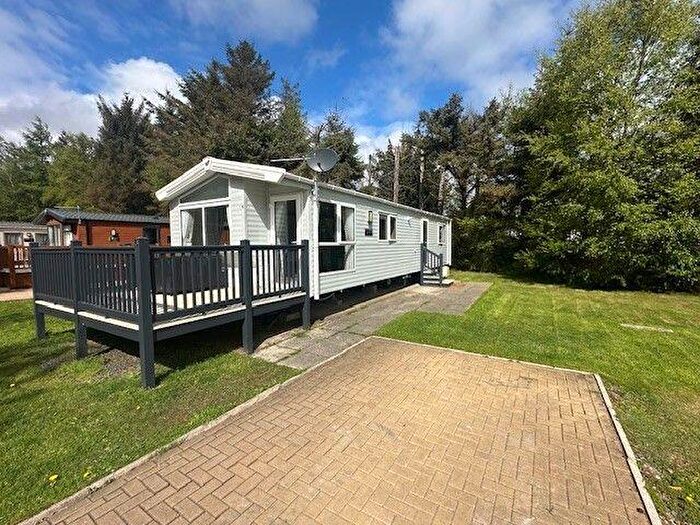
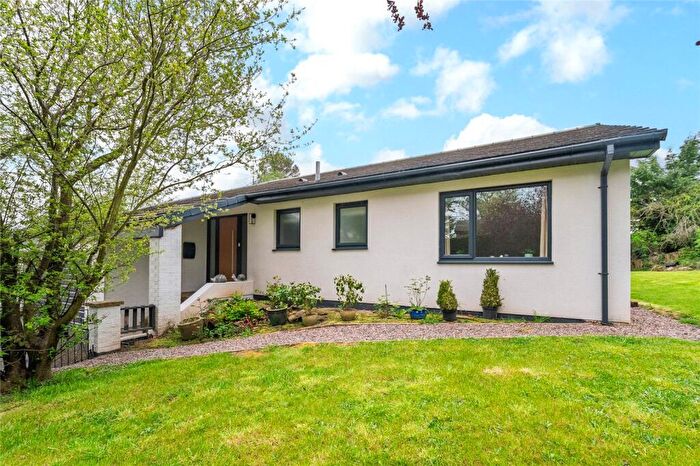
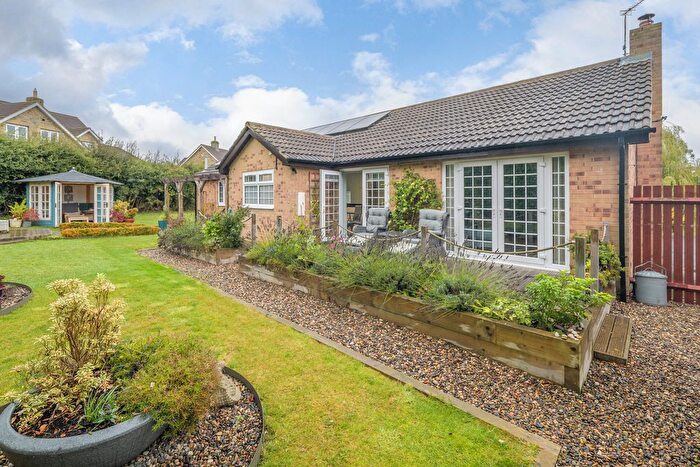
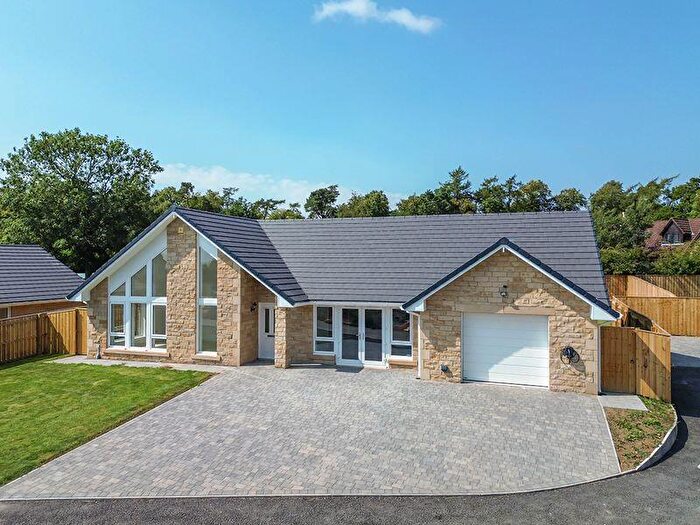
Properties for sale near NE65 9QU, Kenmore Croft
![]()
If you are looking to sell your house, let it out, or receive a property valuation, an expert can help you.
Click the button below to get started.


Price Paid in Kenmore Croft, NE65 9QU, Shilbottle
2 Kenmore Croft, NE65 9QU, Shilbottle Morpeth
Property 2 has been sold 1 time. The last time it was sold was in 24/07/2024 and the sold price was £400,000.00.
This detached house, sold as a freehold on 24/07/2024, is a 73 sqm detached bungalow with an EPC rating of D.
| Date | Price | Property Type | Tenure | Classification |
|---|---|---|---|---|
| 24/07/2024 | £400,000.00 | Detached House | freehold | Established Building |
4 Kenmore Croft, NE65 9QU, Shilbottle Morpeth
Property 4 has been sold 1 time. The last time it was sold was in 03/12/2020 and the sold price was £330,000.00.
This detached house, sold as a freehold on 03/12/2020, is a 153 sqm detached bungalow with an EPC rating of E.
| Date | Price | Property Type | Tenure | Classification |
|---|---|---|---|---|
| 03/12/2020 | £330,000.00 | Detached House | freehold | Established Building |
3 Kenmore Croft, NE65 9QU, Shilbottle Morpeth
Property 3 has been sold 1 time. The last time it was sold was in 17/11/2000 and the sold price was £144,950.00.
This detached house, sold as a freehold on 17/11/2000, is a 154 sqm detached bungalow with an EPC rating of C.
| Date | Price | Property Type | Tenure | Classification |
|---|---|---|---|---|
| 17/11/2000 | £144,950.00 | Detached House | freehold | Established Building |
Transport near NE65 9QU, Kenmore Croft

House price paid reports for NE65 9QU, Kenmore Croft
Click on the buttons below to see price paid reports by year or property price:
- Price Paid By Year
- Property Type Price
Property Price Paid in NE65 9QU, Kenmore Croft by Year
The average sold property price by year was:
| Year | Average Sold Price | Price Change |
Sold Properties
|
|---|---|---|---|
| 2024 | £400,000 | 18% |
1 Property |
| 2020 | £330,000 | 56% |
1 Property |
| 2000 | £144,950 | - |
1 Property |
Property Price per Property Type in NE65 9QU, Kenmore Croft
Here you can find historic sold price data in order to help with your property search.
The average Property Paid Price for specific property types in the last three years are:
| Property Type | Average Sold Price | Sold Properties |
|---|---|---|
| Detached House | £400,000.00 | 1 Detached House |