
Houses for sale & to rent in NE20 9HF, Kingsway, Ponteland North, Newcastle Upon Tyne
House Prices in NE20 9HF, Kingsway, Ponteland North
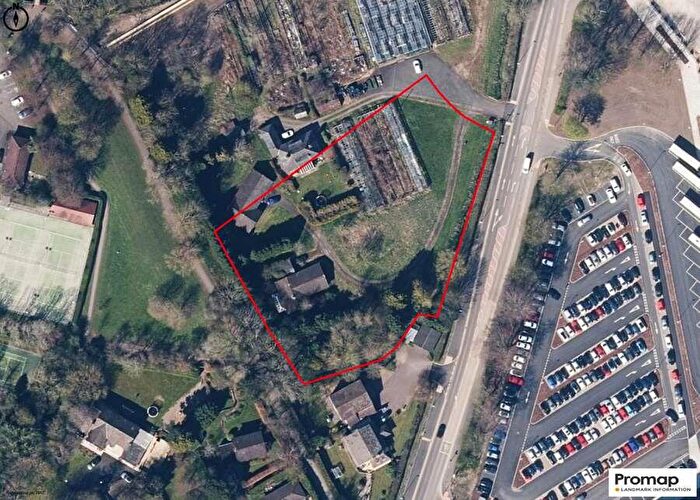
Properties in NE20 9HF have no sales history available within the last 3 years. NE20 9HF is a postcode in Kingsway located in Ponteland North, an area in Newcastle Upon Tyne, Northumberland, with 3 households².
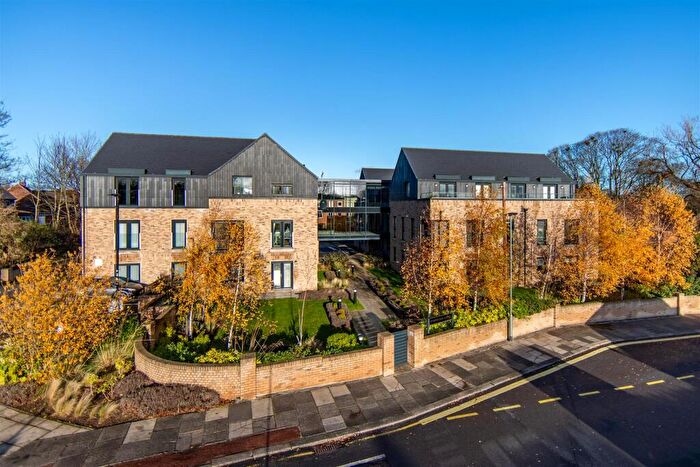
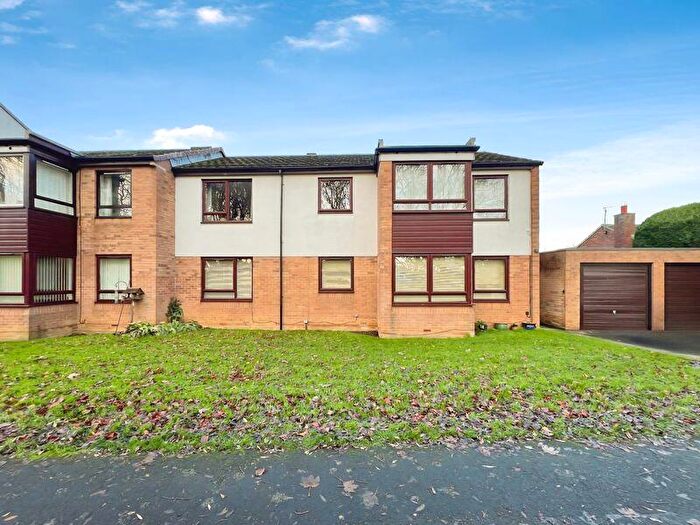
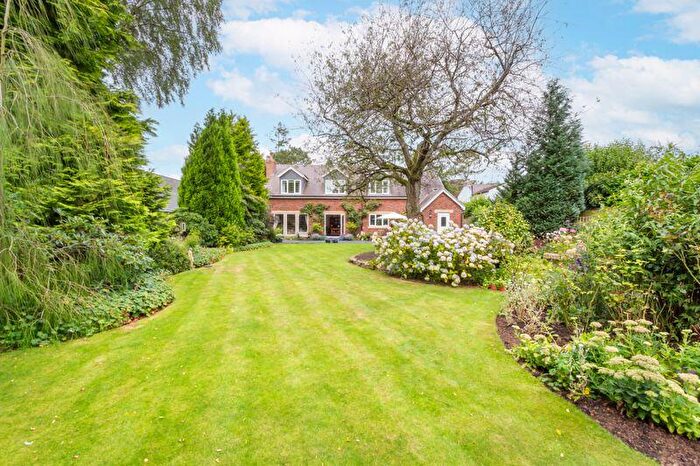
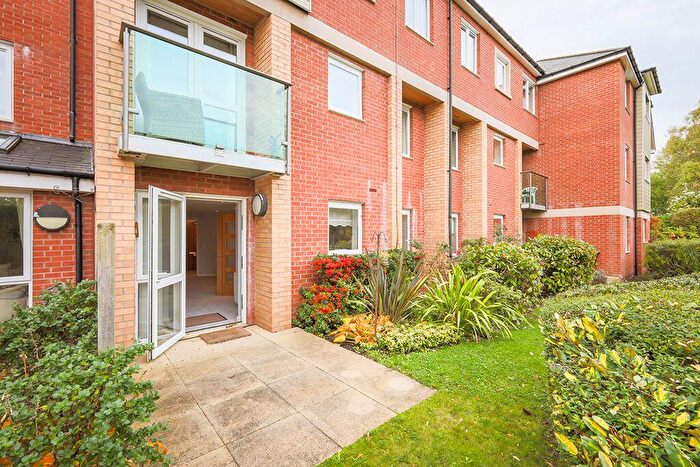
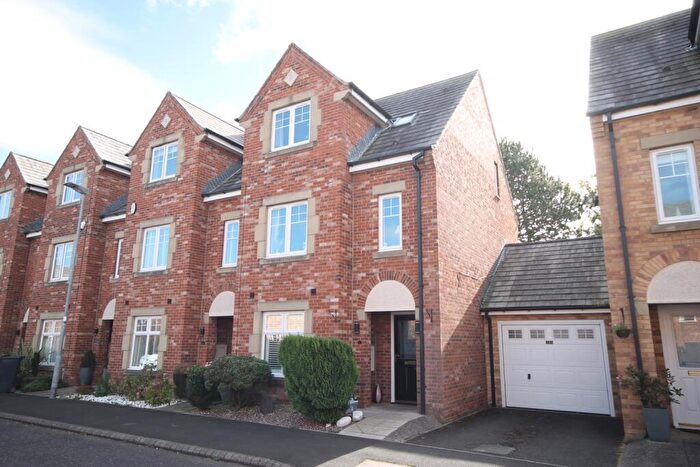
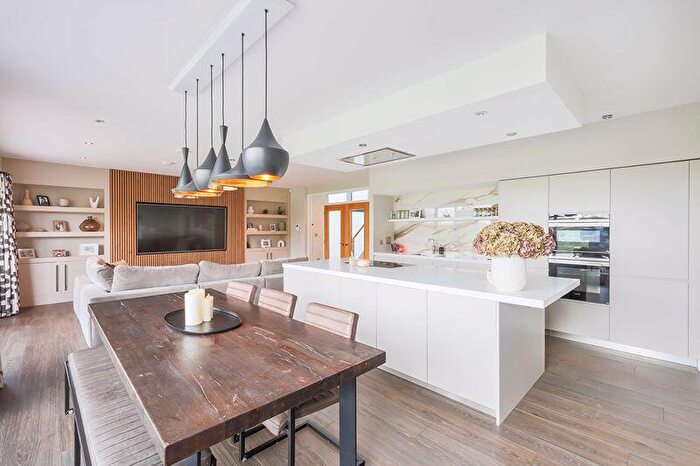
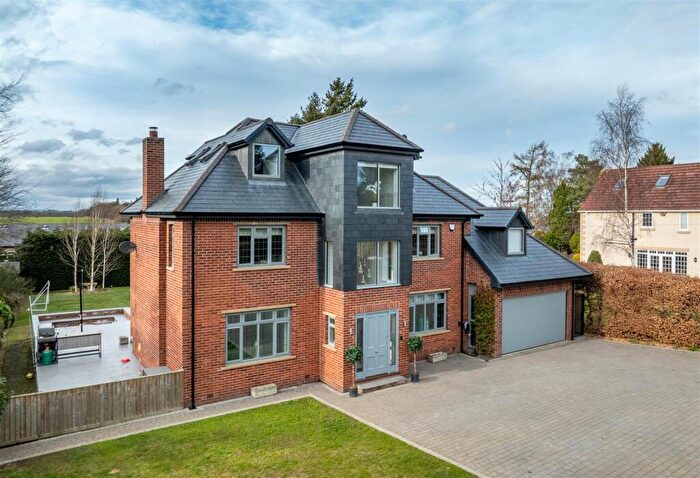
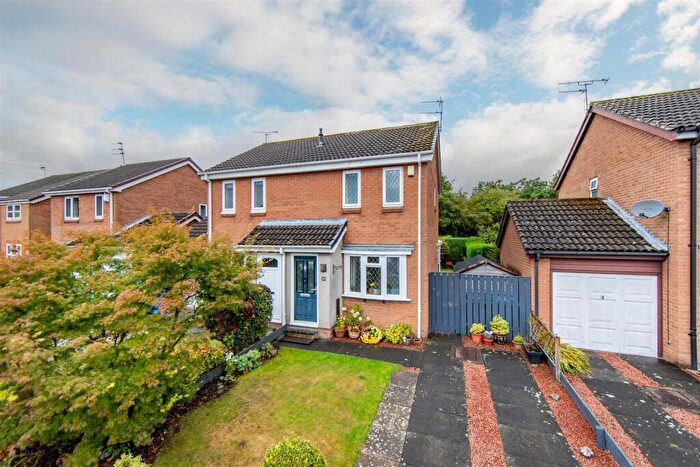
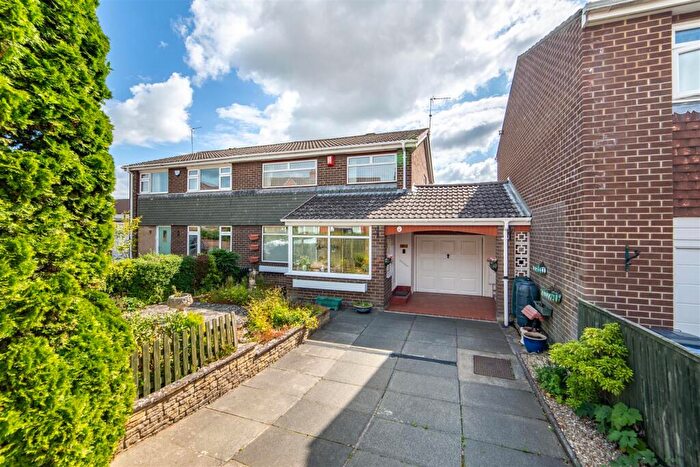
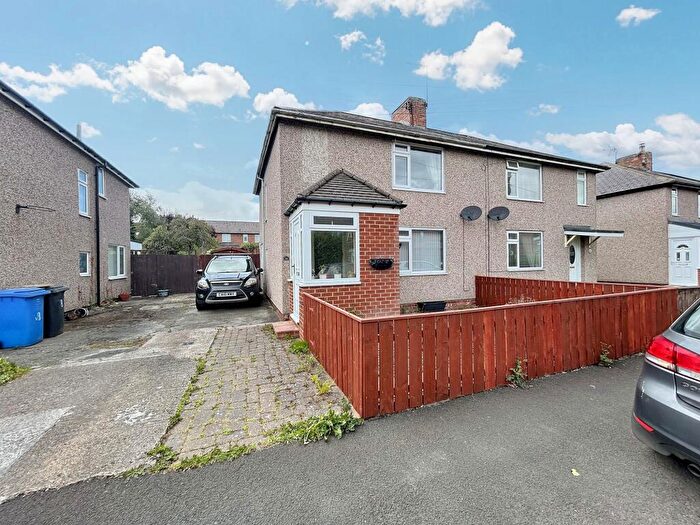
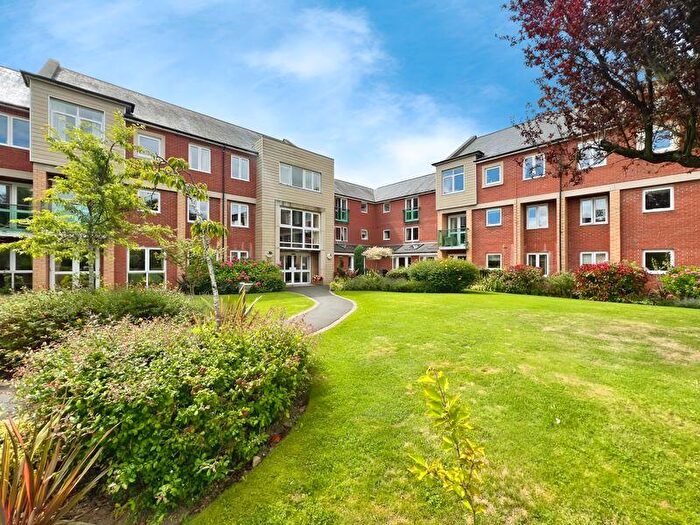
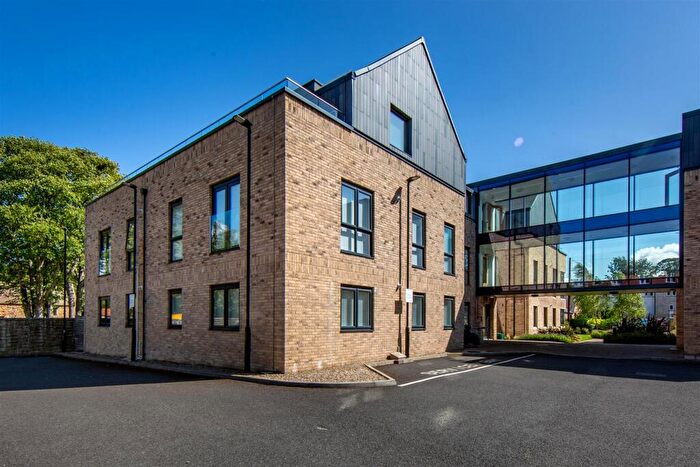
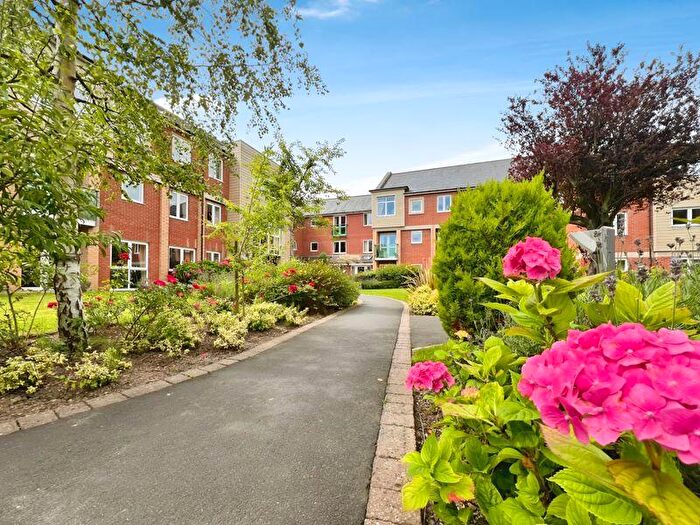
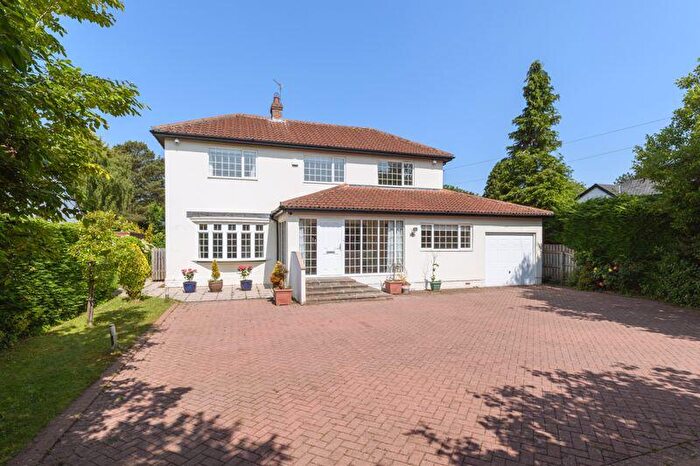
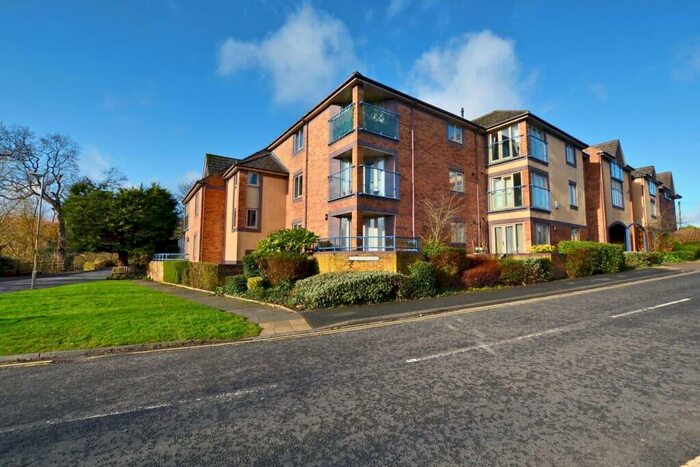
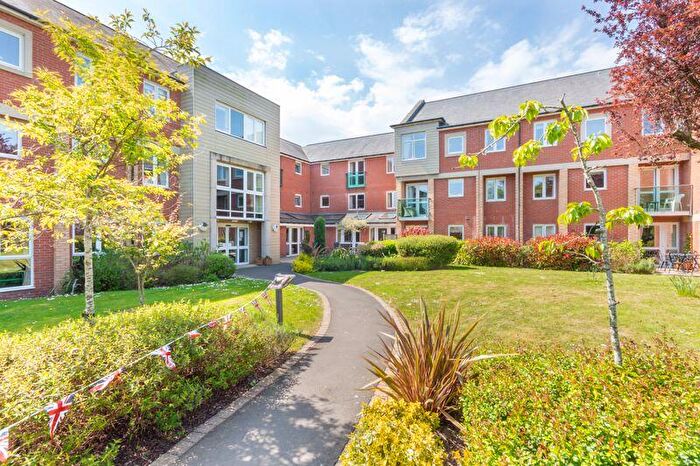
Properties for sale near NE20 9HF, Kingsway
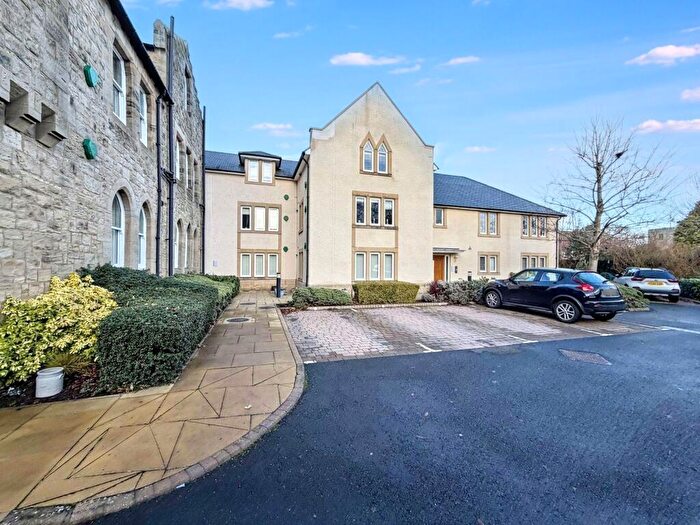
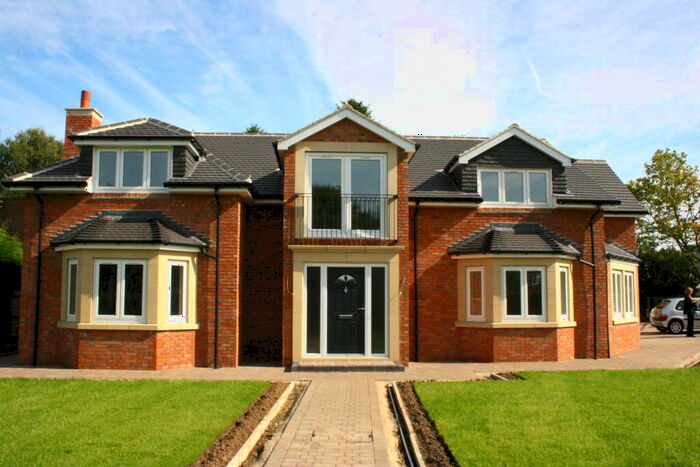
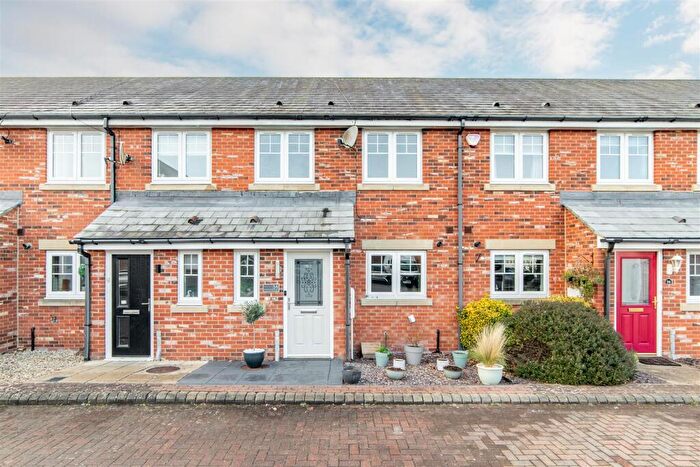
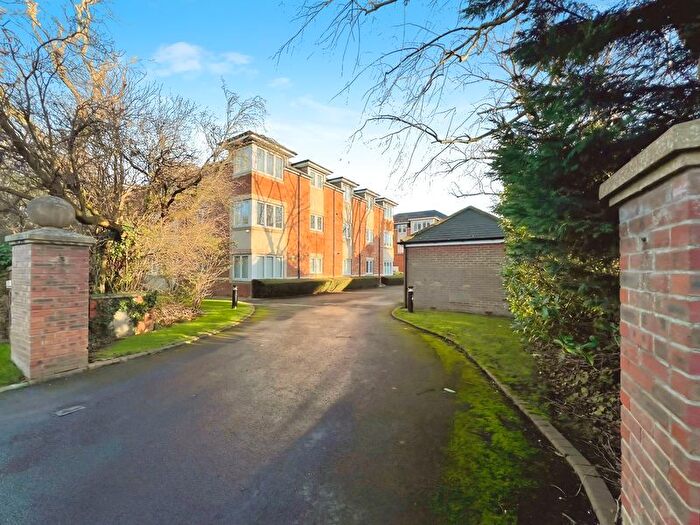

![]()
If you are looking to sell your house, let it out, or receive a property valuation, an expert can help you.
Click the button below to get started.
Price Paid in Kingsway, NE20 9HF, Ponteland North
1 Kingsway, NE20 9HF, Ponteland North Newcastle Upon Tyne
Property 1 has been sold 4 times. The last time it was sold was in 29/06/2021 and the sold price was £1,600,000.00.
This detached house, sold as a freehold on 29/06/2021, is a 471 sqm detached house with an EPC rating of C.
| Date | Price | Property Type | Tenure | Classification |
|---|---|---|---|---|
| 29/06/2021 | £1,600,000.00 | Detached House | freehold | Established Building |
| 27/04/2004 | £900,000.00 | Detached House | freehold | Established Building |
| 15/01/2004 | £700,000.00 | Detached House | freehold | Established Building |
| 17/06/2003 | £650,000.00 | Detached House | freehold | Established Building |
2 Kingsway, NE20 9HF, Ponteland North Newcastle Upon Tyne
Property 2 has been sold 1 time. The last time it was sold was in 16/01/2015 and the sold price was £650,000.00.
This detached house, sold as a freehold on 16/01/2015, is a 197 sqm detached house with an EPC rating of D.
| Date | Price | Property Type | Tenure | Classification |
|---|---|---|---|---|
| 16/01/2015 | £650,000.00 | Detached House | freehold | Established Building |
Transport near NE20 9HF, Kingsway
-
 Wylam Station
 -
Blaydon Station
-
Cramlington Station
-
MetroCentre Station
-
Prudhoe Station
-
Newcastle Station
-
Manors Station
-
Dunston Station
-
Morpeth Station
-
Stocksfield Station
House price paid reports for NE20 9HF, Kingsway
Click on the buttons below to see price paid reports by year or property price:
- Price Paid By Year
Property Price Paid in NE20 9HF, Kingsway by Year
The average sold property price by year was:
| Year | Average Sold Price | Price Change |
Sold Properties
|
|---|---|---|---|
| 2021 | £1,600,000 | 59% |
1 Property |
| 2015 | £650,000 | -23% |
1 Property |
| 2004 | £800,000 | 19% |
2 Properties |
| 2003 | £650,000 | - |
1 Property |