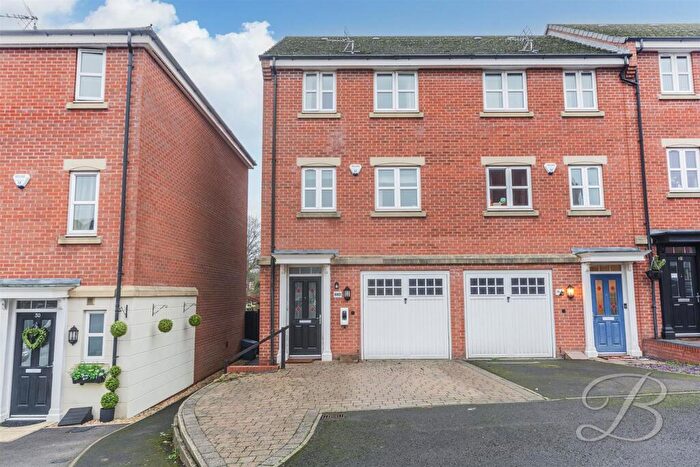
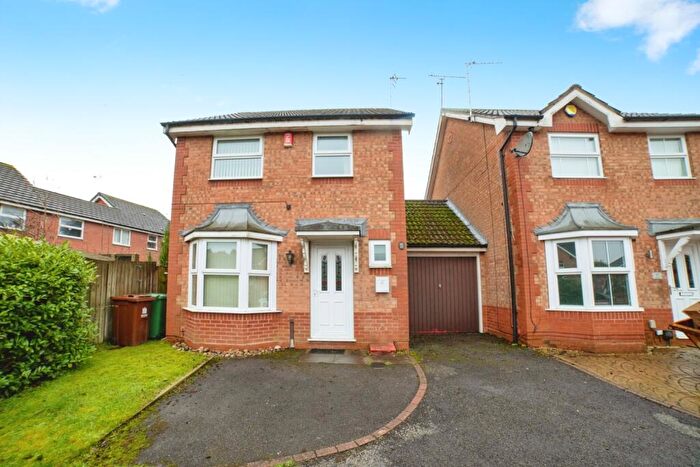
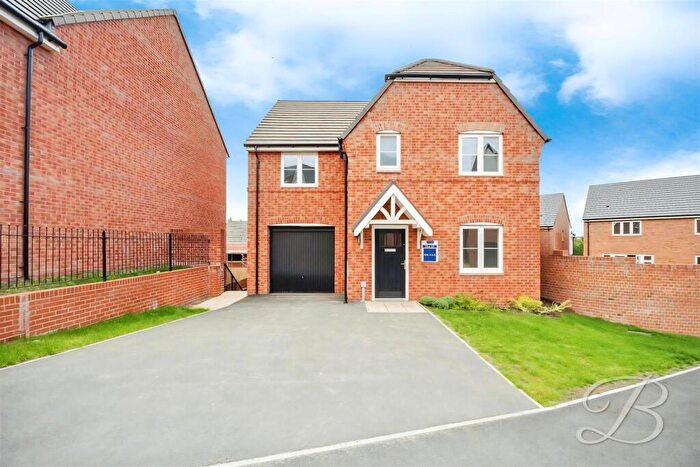
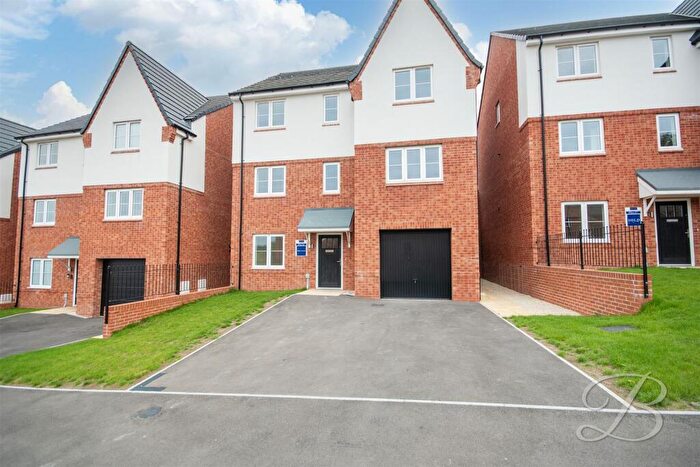
Houses for sale & to rent in Oakham, Mansfield
House Prices in Oakham
Properties in Oakham have an average house price of £313,867.00 and had 128 Property Transactions within the last 3 years¹.
Oakham is an area in Mansfield, Nottinghamshire with 1,002 households², where the most expensive property was sold for £1,300,000.00.
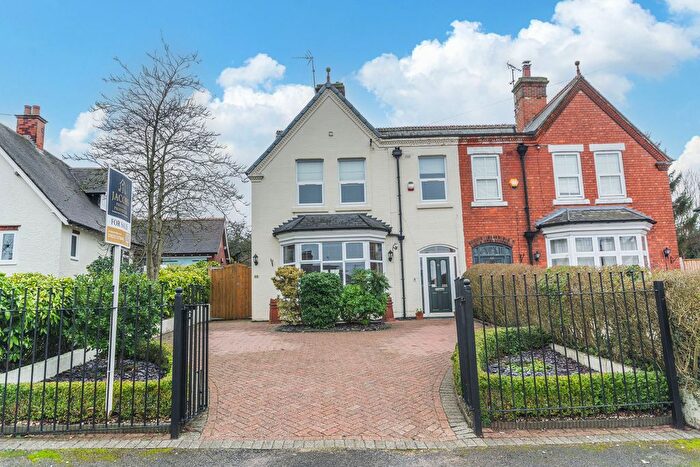
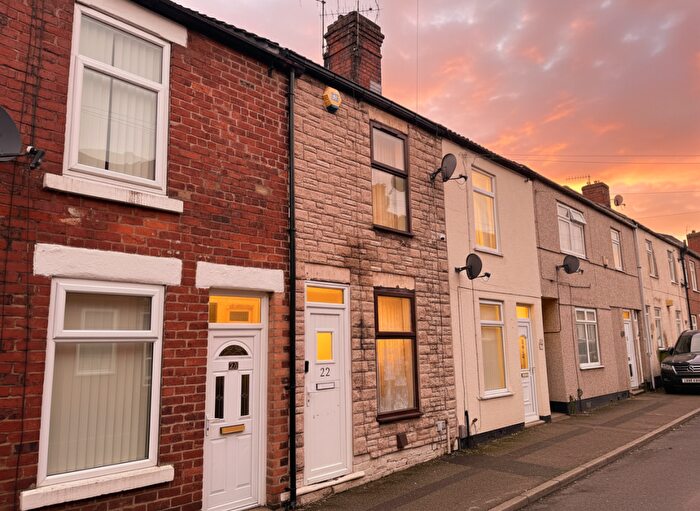
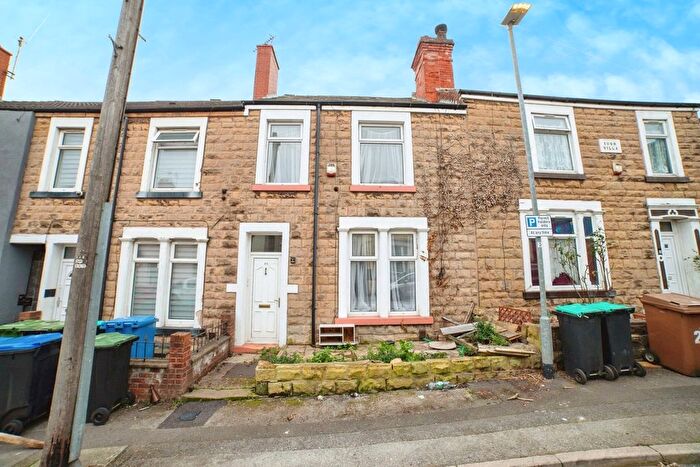
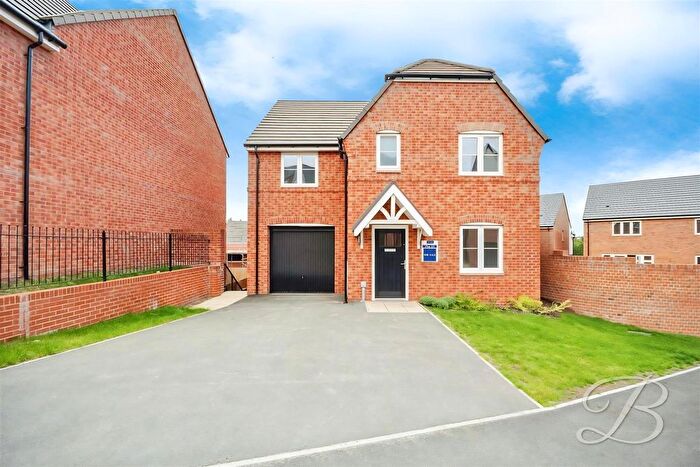
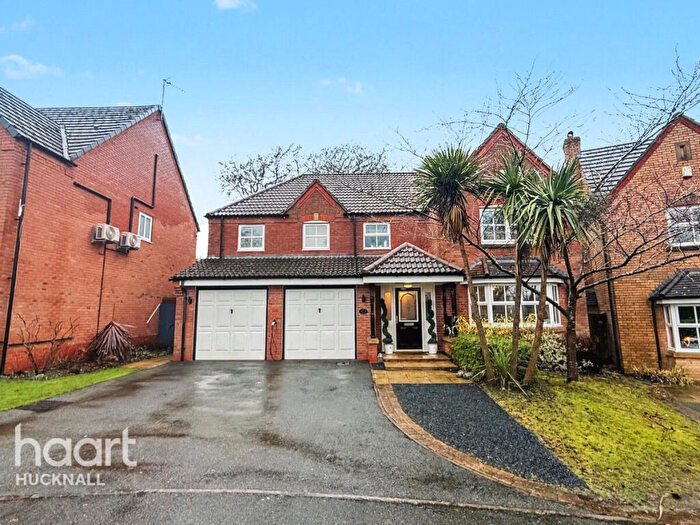
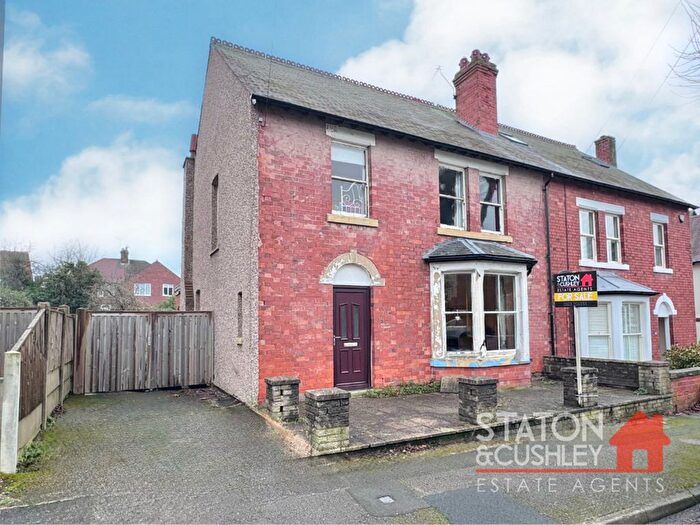
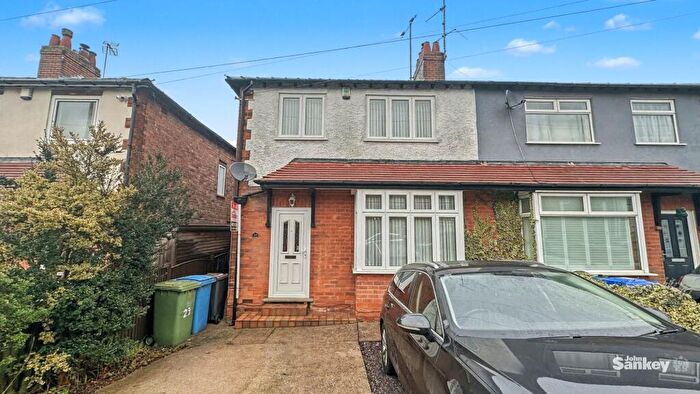
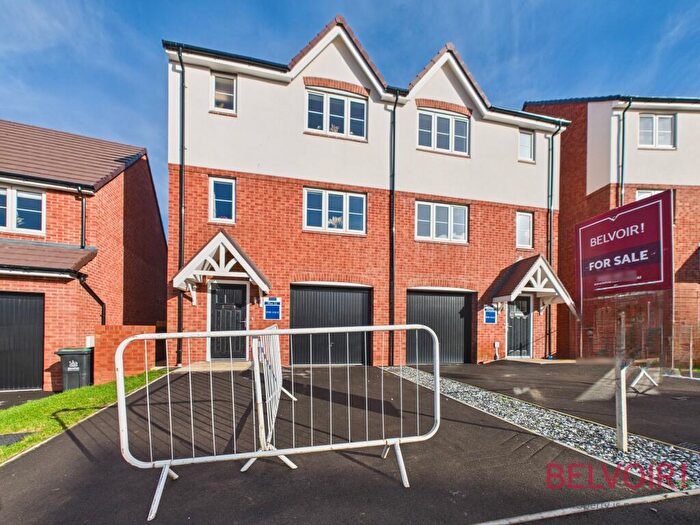
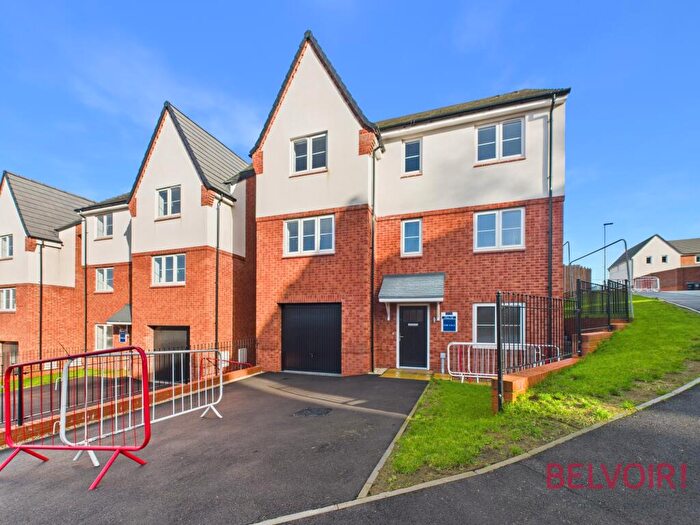
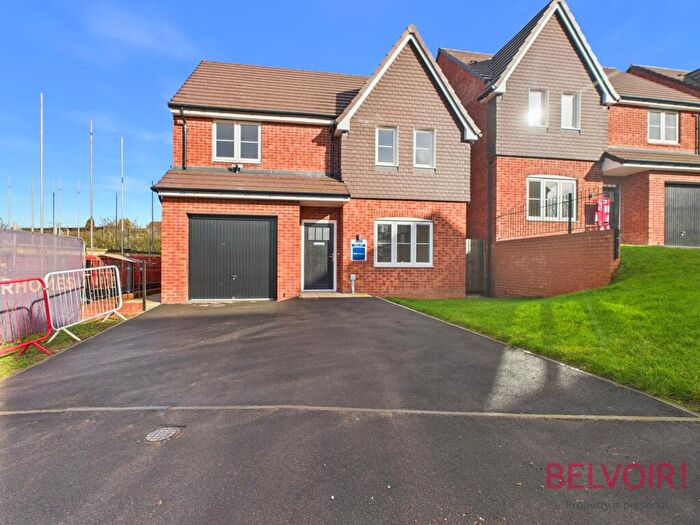
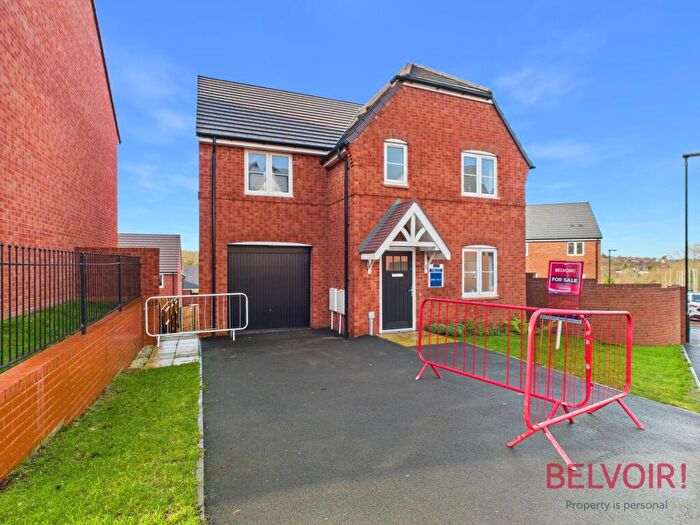
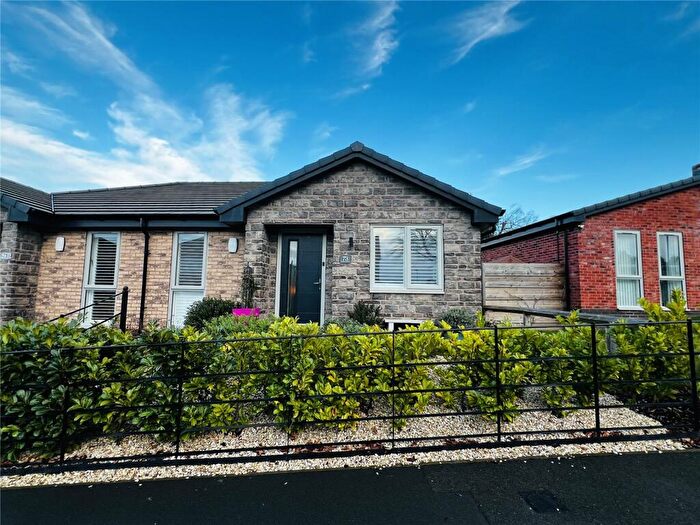
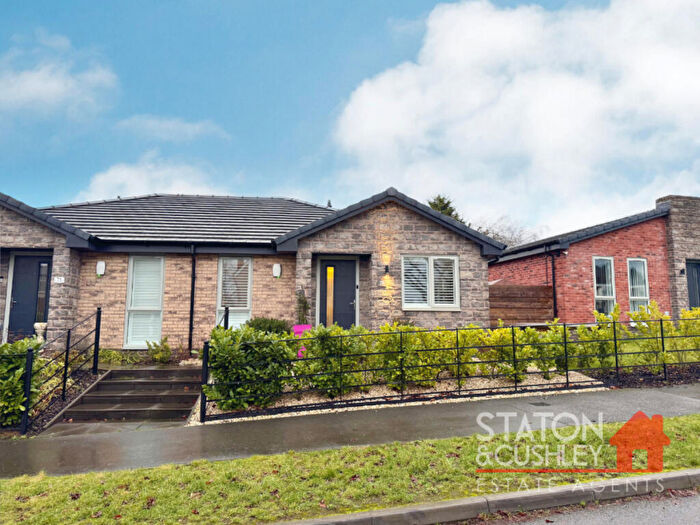
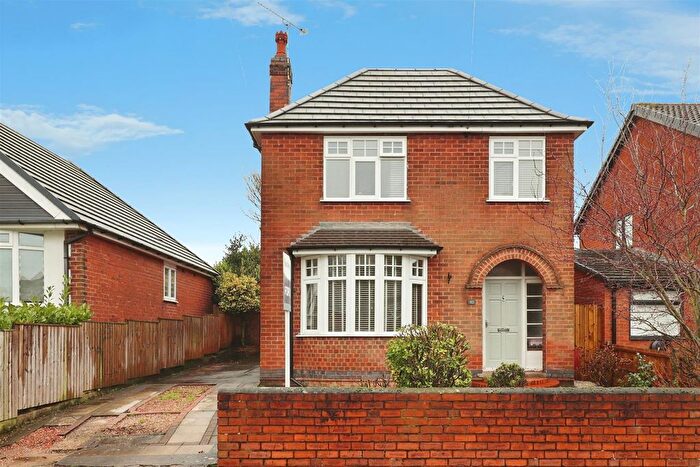
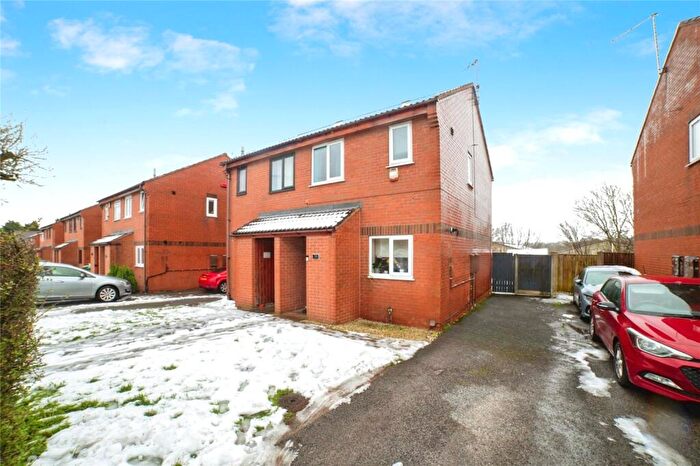
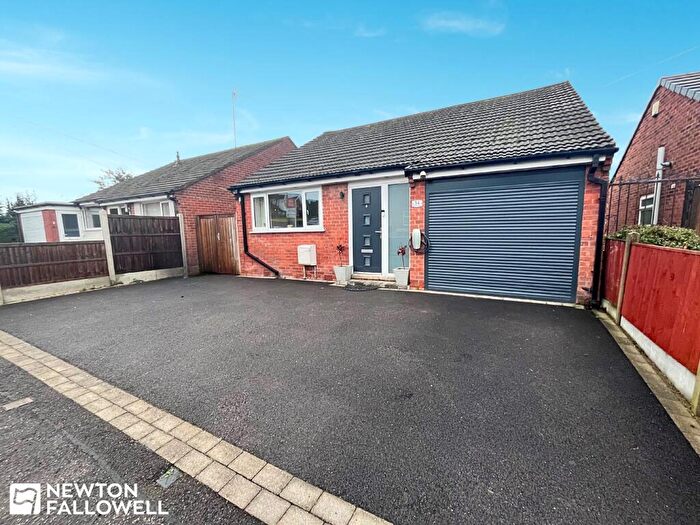
Properties for sale in Oakham
Roads and Postcodes in Oakham
Navigate through our locations to find the location of your next house in Oakham, Mansfield for sale or to rent.
| Streets | Postcodes |
|---|---|
| Alexandra Avenue | NG18 5AB NG18 5AD |
| Atkin Lane | NG18 5AN |
| Berry Hill Lane | NG18 4BH NG18 4BQ NG18 4BW |
| Bird Close | NG18 4AZ |
| Bleak Hill Sidings | NG18 5EP |
| Bleak Hill Way | NG18 5EZ |
| Bleak Hills Lane | NG18 5BS |
| Boswell Close | NG18 4BZ |
| Caudwell Drive | NG18 4SL |
| Cinder Lane | NG18 5FS |
| Cromford Avenue | NG18 5DP |
| Darwin Close | NG18 4BD |
| Derby Road | NG18 5BH NG18 5EF |
| Forest Hill | NG18 5BQ |
| Fuller Close | NG18 5AT |
| Garth Road | NG18 5AQ |
| Green Lane | NG18 4BJ |
| Hamilton Court | NG18 5FB |
| Hamilton Place | NG18 5FA |
| Hamilton Way | NG18 5BR NG18 5BU |
| Hampton View | NG18 5AU |
| Harlow Avenue | NG18 4SJ |
| Hermitage Lane | NG18 5DN NG18 5GH NG18 5HF |
| Hermitage Way | NG18 5ES NG18 5GJ |
| High Oakham Drive | NG18 5AL |
| High Oakham Grange | NG18 5AR |
| High Oakham Hill | NG18 5AH |
| High Oakham Park | NG18 5FH |
| High Oakham Road | NG18 5AJ |
| High Tor | NG18 5BT |
| Hillsway Crescent | NG18 5DR NG18 5DS |
| Johnson Drive | NG18 4BB |
| Kestral Road | NG18 5FT |
| King Edward Avenue | NG18 5AE NG18 5AF |
| Kings Mill Way | NG18 5ER NG18 5GE |
| Lower Oakham Way | NG18 5BY NG18 5BZ |
| Matlock Avenue | NG18 5DW |
| Maun Close | NG18 5GY |
| Maun Way | NG18 5GX |
| Maunside | NG18 5GU |
| Mayflower Court | NG18 5AY |
| Melton Way | NG18 5FU |
| Nottingham Road | NG18 4AA NG18 4AB NG18 4AF NG18 4SE NG18 4SF NG18 4SH NG18 4SN |
| Oakham Close | NG18 4AD |
| Paddock Close | NG18 5AS |
| Roebuck Drive | NG18 5AW |
| Sandhurst Avenue | NG18 4BG NG18 4BS NG18 4BE |
| Sheepbridge Lane | NG18 5DT NG18 5DL NG18 5DU NG18 5EW |
| St Chads Close | NG18 4DS |
| Stanley Road | NG18 5AA |
| Sunny Bank | NG18 4BN |
| Swinfen Broun | NG18 4DT |
| The Crescent | NG18 4BL |
| The Grange | NG18 4BA |
| Torminster Trade Park | NG18 5GQ |
| Wade Close | NG18 4DR |
| Waverley Road | NG18 5AG |
| Woodland Park View | NG18 5FD |
Transport near Oakham
-
Mansfield Town Station
-
Sutton Parkway Station
-
Mansfield Woodhouse Station
-
Kirkby in Ashfield Station
- FAQ
- Price Paid By Year
- Property Type Price
Frequently asked questions about Oakham
What is the average price for a property for sale in Oakham?
The average price for a property for sale in Oakham is £313,867. This amount is 62% higher than the average price in Mansfield. There are 722 property listings for sale in Oakham.
What streets have the most expensive properties for sale in Oakham?
The streets with the most expensive properties for sale in Oakham are High Oakham Grange at an average of £930,000, High Oakham Drive at an average of £818,500 and Mayflower Court at an average of £600,000.
What streets have the most affordable properties for sale in Oakham?
The streets with the most affordable properties for sale in Oakham are Stanley Road at an average of £145,062, Fuller Close at an average of £150,000 and Green Lane at an average of £165,785.
Which train stations are available in or near Oakham?
Some of the train stations available in or near Oakham are Mansfield Town, Sutton Parkway and Mansfield Woodhouse.
Property Price Paid in Oakham by Year
The average sold property price by year was:
| Year | Average Sold Price | Price Change |
Sold Properties
|
|---|---|---|---|
| 2025 | £314,229 | -5% |
37 Properties |
| 2024 | £329,653 | 10% |
49 Properties |
| 2023 | £295,130 | 2% |
42 Properties |
| 2022 | £290,449 | 10% |
55 Properties |
| 2021 | £260,582 | -1% |
57 Properties |
| 2020 | £263,192 | 7% |
56 Properties |
| 2019 | £245,031 | -11% |
71 Properties |
| 2018 | £272,027 | 9% |
36 Properties |
| 2017 | £247,573 | 16% |
46 Properties |
| 2016 | £207,292 | -7% |
61 Properties |
| 2015 | £221,638 | 9% |
38 Properties |
| 2014 | £200,587 | 10% |
60 Properties |
| 2013 | £181,529 | 2% |
44 Properties |
| 2012 | £178,329 | -11% |
34 Properties |
| 2011 | £197,693 | 15% |
22 Properties |
| 2010 | £168,472 | 13% |
34 Properties |
| 2009 | £146,075 | -27% |
26 Properties |
| 2008 | £185,130 | -9% |
35 Properties |
| 2007 | £200,980 | 3% |
76 Properties |
| 2006 | £195,514 | 8% |
63 Properties |
| 2005 | £179,481 | 5% |
53 Properties |
| 2004 | £170,146 | 19% |
49 Properties |
| 2003 | £137,124 | 13% |
47 Properties |
| 2002 | £119,559 | 26% |
64 Properties |
| 2001 | £88,770 | 15% |
57 Properties |
| 2000 | £75,767 | 7% |
50 Properties |
| 1999 | £70,126 | 5% |
67 Properties |
| 1998 | £66,732 | 2% |
48 Properties |
| 1997 | £65,595 | -5% |
57 Properties |
| 1996 | £68,950 | 15% |
39 Properties |
| 1995 | £58,440 | - |
33 Properties |
Property Price per Property Type in Oakham
Here you can find historic sold price data in order to help with your property search.
The average Property Paid Price for specific property types in the last three years are:
| Property Type | Average Sold Price | Sold Properties |
|---|---|---|
| Semi Detached House | £256,119.00 | 46 Semi Detached Houses |
| Detached House | £417,175.00 | 60 Detached Houses |
| Terraced House | £146,066.00 | 15 Terraced Houses |
| Flat | £167,428.00 | 7 Flats |

