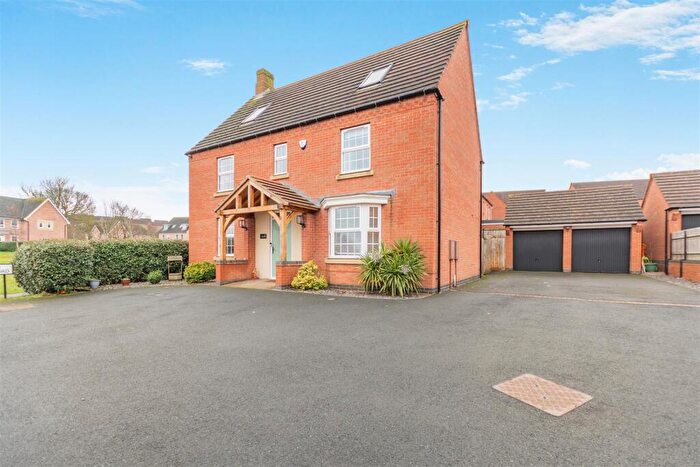
Houses for sale & to rent in Holly, Mansfield
House Prices in Holly
Properties in Holly have an average house price of £227,581.00 and had 135 Property Transactions within the last 3 years¹.
Holly is an area in Mansfield, Nottinghamshire with 1,263 households², where the most expensive property was sold for £415,000.00.
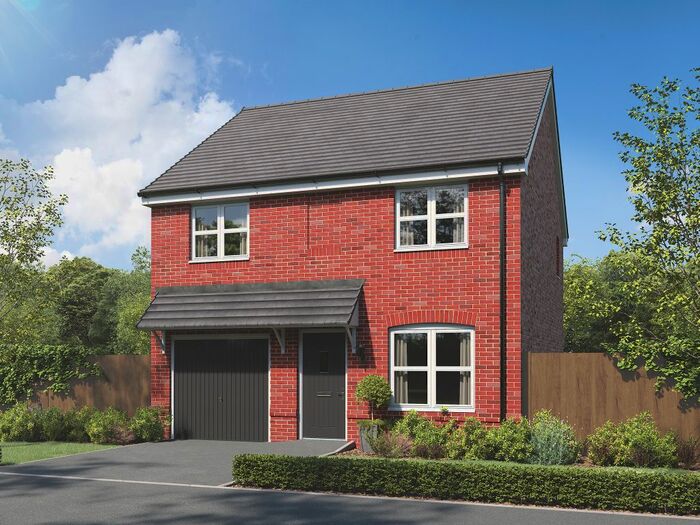
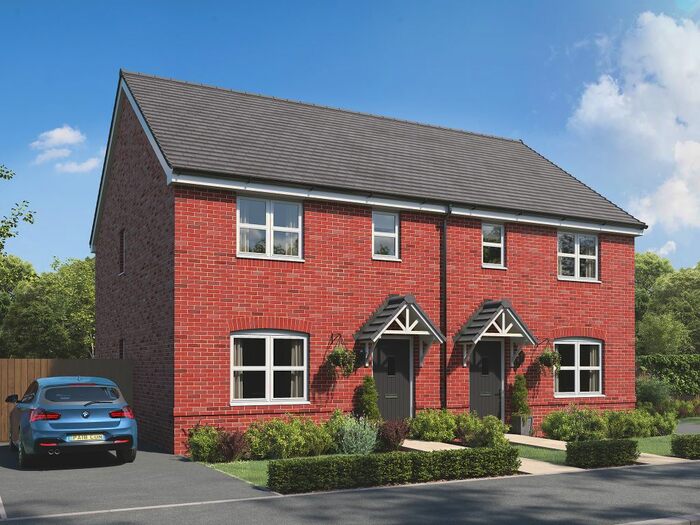
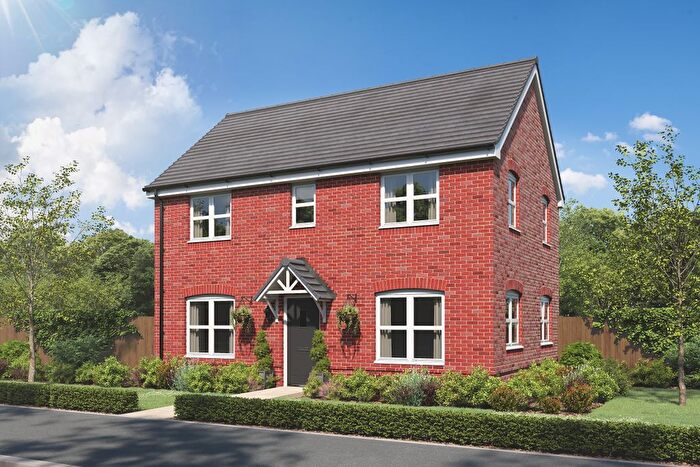
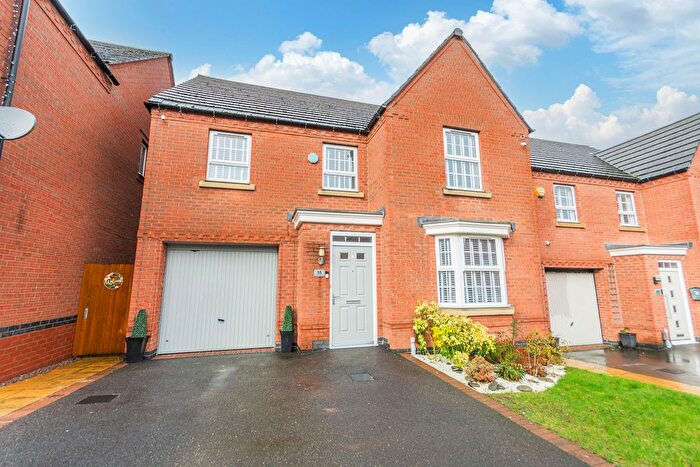
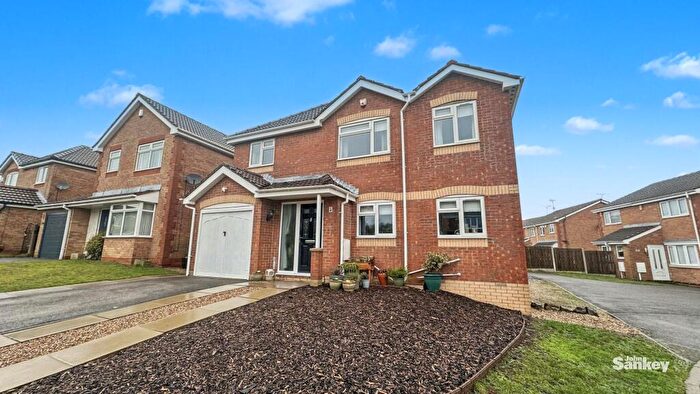
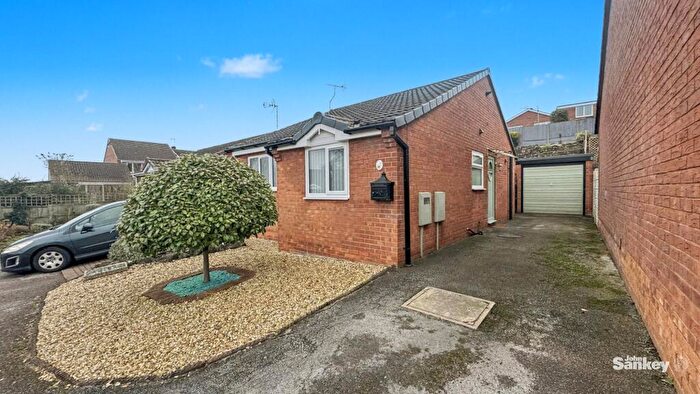
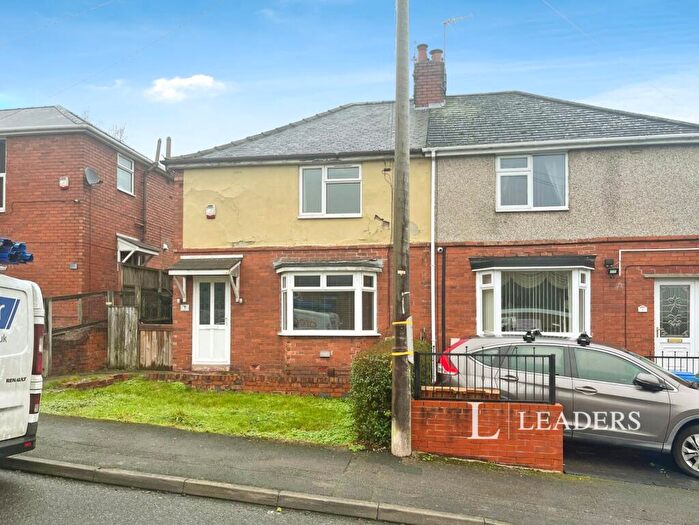
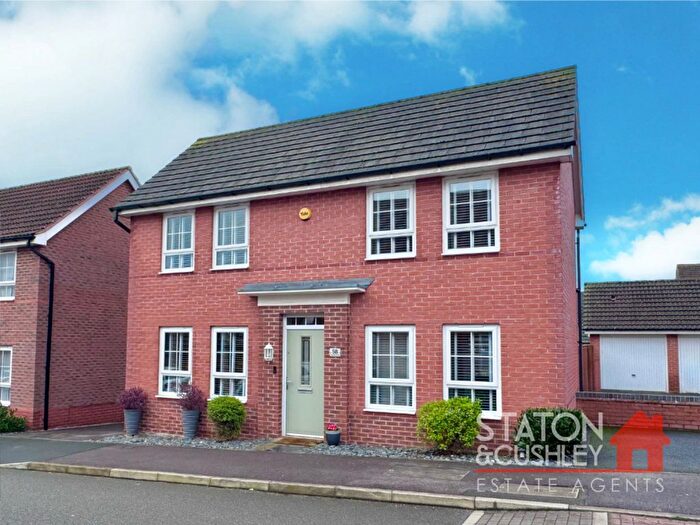
Properties for sale in Holly
Roads and Postcodes in Holly
Navigate through our locations to find the location of your next house in Holly, Mansfield for sale or to rent.
| Streets | Postcodes |
|---|---|
| Ashleigh Way | NG19 9GG |
| Baldwin Close | NG19 0LR |
| Beechdale Road | NG19 9GQ |
| Beechwood Close | NG19 0NU |
| Belmont Close | NG19 9GD |
| Birchcroft Drive | NG19 9GA |
| Brackenwood Close | NG19 0NZ |
| Briarwood Close | NG19 0NJ |
| Cardle Close | NG19 0PU |
| Clipstone Road West | NG19 0BT NG19 0HJ |
| Colby Close | NG19 0LS |
| Cranswick Close | NG19 9GB |
| Crosby Close | NG19 0PW |
| Dewberry Gardens | NG19 0RG |
| Douglas Road | NG19 0LT |
| Elder Court | NG19 0RP |
| Fair View | NG19 9GF |
| Fernwood Close | NG19 0NX |
| Fitzwilliam Drive | NG19 0RH |
| Fuchsia Way | NG19 0RD |
| Garwick Close | NG19 0LU |
| Glen Mooar Close | NG19 0NN |
| Halstead Close | NG19 0RR |
| Hazelwood Close | NG19 0NL |
| High Ridge | NG19 0QB |
| Holly Drive | NG19 0NT |
| Holly Road | NG19 0RB |
| Lemont Road | NG19 9GE |
| Little Hollies | NG19 0EB |
| Lonan Close | NG19 0PS |
| Longbourne Court | NG19 0RL |
| Minton Pastures | NG19 0RF |
| New Mill Lane | NG19 0HH NG19 0HQ |
| Pinfold Gardens | NG19 0QU |
| Quines Hill Road | NG19 0NW |
| Ramsey Close | NG19 0NS |
| Rosedale Way | NG19 0QR |
| Rushpool Close | NG19 0LY |
| Ryecroft | NG19 0GE |
| Saffron Street | NG19 0RE |
| Santon Close | NG19 0PT |
| Santon Road | NG19 0PR |
| Sartfield Road | NG19 0LX |
| Shearsby Drive | NG19 0RN |
| Siena Gardens | NG19 0RT |
| Snaefell Avenue | NG19 0NR |
| Sulby Close | NG19 0NP |
| Summerdowns | NG19 0RA |
| Welburn Close | NG19 0QS |
| Wentworth Close | NG19 0QT |
| Whitney Close | NG19 0BD |
| Willow Avenue | NG19 0NY |
| Wycombe Grange | NG19 0RJ |
Transport near Holly
-
Mansfield Woodhouse Station
-
Mansfield Town Station
-
Shirebrook (Derbys) Station
-
Sutton Parkway Station
- FAQ
- Price Paid By Year
- Property Type Price
Frequently asked questions about Holly
What is the average price for a property for sale in Holly?
The average price for a property for sale in Holly is £227,581. This amount is 17% higher than the average price in Mansfield. There are 629 property listings for sale in Holly.
What streets have the most expensive properties for sale in Holly?
The streets with the most expensive properties for sale in Holly are New Mill Lane at an average of £388,750, Ryecroft at an average of £380,000 and High Ridge at an average of £350,000.
What streets have the most affordable properties for sale in Holly?
The streets with the most affordable properties for sale in Holly are Whitney Close at an average of £152,500, Welburn Close at an average of £158,166 and Garwick Close at an average of £173,333.
Which train stations are available in or near Holly?
Some of the train stations available in or near Holly are Mansfield Woodhouse, Mansfield Town and Shirebrook (Derbys).
Property Price Paid in Holly by Year
The average sold property price by year was:
| Year | Average Sold Price | Price Change |
Sold Properties
|
|---|---|---|---|
| 2025 | £242,246 | 9% |
44 Properties |
| 2024 | £221,527 | 1% |
44 Properties |
| 2023 | £219,521 | 3% |
47 Properties |
| 2022 | £213,950 | 15% |
61 Properties |
| 2021 | £182,345 | 5% |
42 Properties |
| 2020 | £172,978 | -1% |
45 Properties |
| 2019 | £173,889 | -4% |
55 Properties |
| 2018 | £180,335 | 14% |
63 Properties |
| 2017 | £154,458 | 8% |
75 Properties |
| 2016 | £141,904 | 0,5% |
65 Properties |
| 2015 | £141,242 | 2% |
64 Properties |
| 2014 | £138,438 | 1% |
58 Properties |
| 2013 | £136,388 | 11% |
49 Properties |
| 2012 | £121,328 | -9% |
39 Properties |
| 2011 | £132,552 | 1% |
39 Properties |
| 2010 | £130,653 | -2% |
39 Properties |
| 2009 | £133,155 | -12% |
29 Properties |
| 2008 | £149,432 | -2% |
55 Properties |
| 2007 | £151,725 | 8% |
135 Properties |
| 2006 | £139,360 | 7% |
126 Properties |
| 2005 | £129,182 | 1% |
108 Properties |
| 2004 | £128,424 | 16% |
98 Properties |
| 2003 | £107,488 | 15% |
74 Properties |
| 2002 | £91,659 | 14% |
153 Properties |
| 2001 | £78,457 | 15% |
139 Properties |
| 2000 | £66,964 | 9% |
102 Properties |
| 1999 | £61,190 | 13% |
95 Properties |
| 1998 | £53,377 | 8% |
72 Properties |
| 1997 | £49,123 | 3% |
82 Properties |
| 1996 | £47,793 | 2% |
64 Properties |
| 1995 | £46,613 | - |
66 Properties |
Property Price per Property Type in Holly
Here you can find historic sold price data in order to help with your property search.
The average Property Paid Price for specific property types in the last three years are:
| Property Type | Average Sold Price | Sold Properties |
|---|---|---|
| Semi Detached House | £178,741.00 | 28 Semi Detached Houses |
| Detached House | £246,977.00 | 99 Detached Houses |
| Terraced House | £158,500.00 | 8 Terraced Houses |

