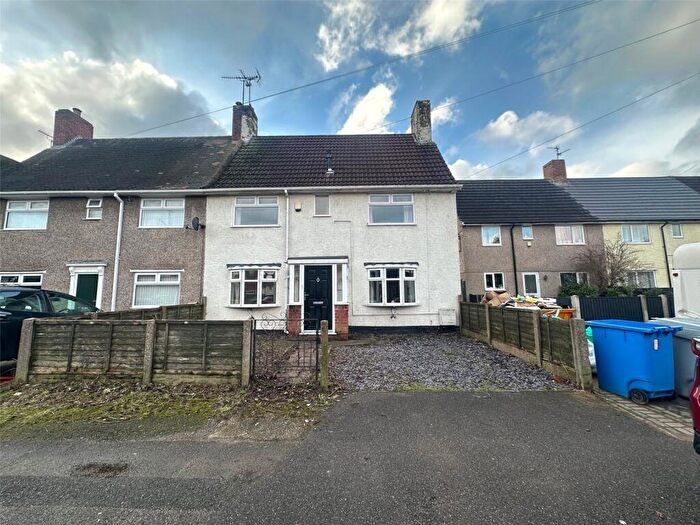
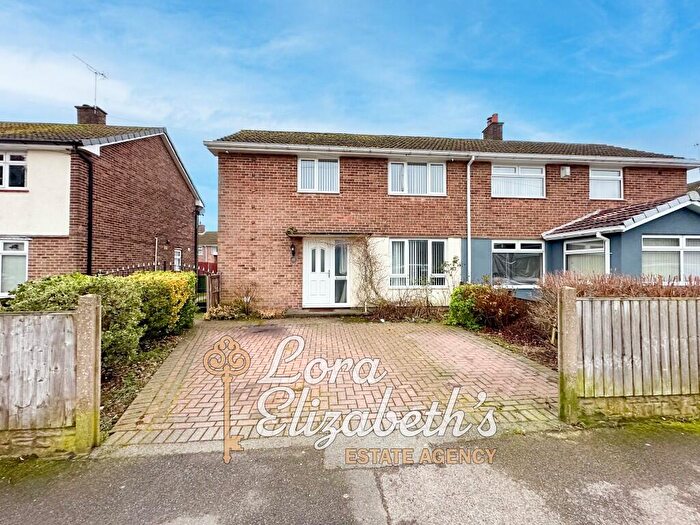
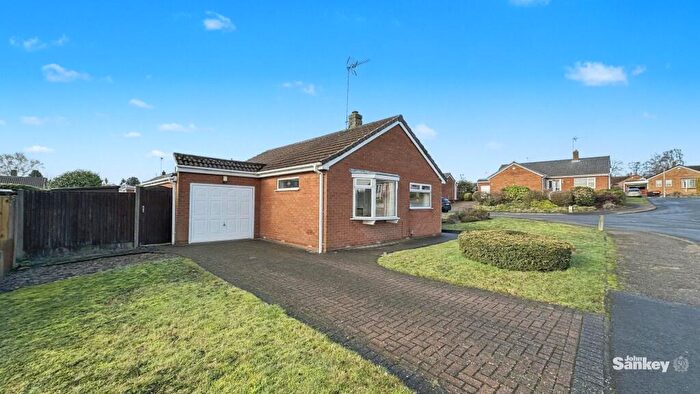
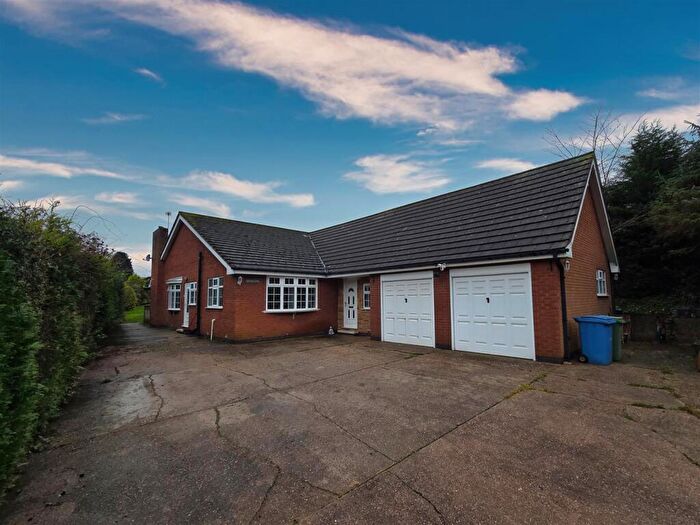
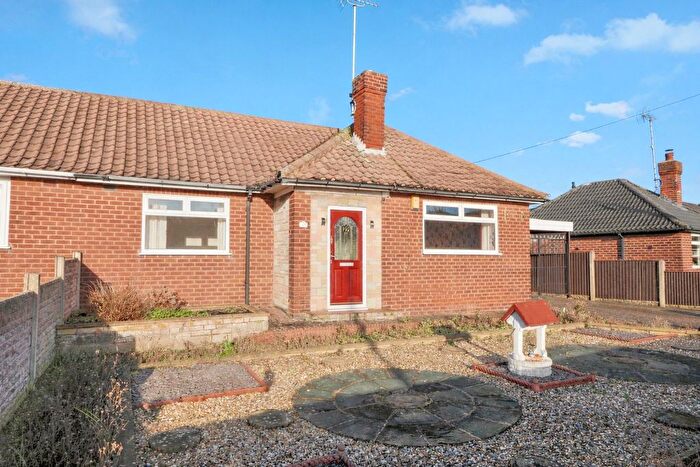
Houses for sale & to rent in Newlands, Mansfield
House Prices in Newlands
Properties in Newlands have an average house price of £199,412.00 and had 91 Property Transactions within the last 3 years¹.
Newlands is an area in Mansfield, Nottinghamshire with 1,262 households², where the most expensive property was sold for £525,000.00.
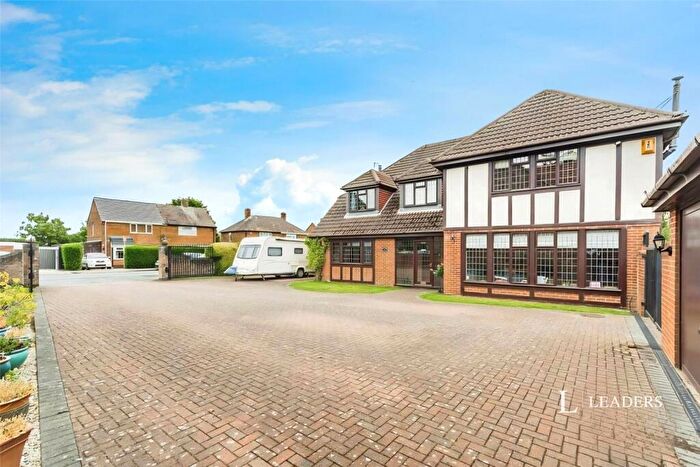
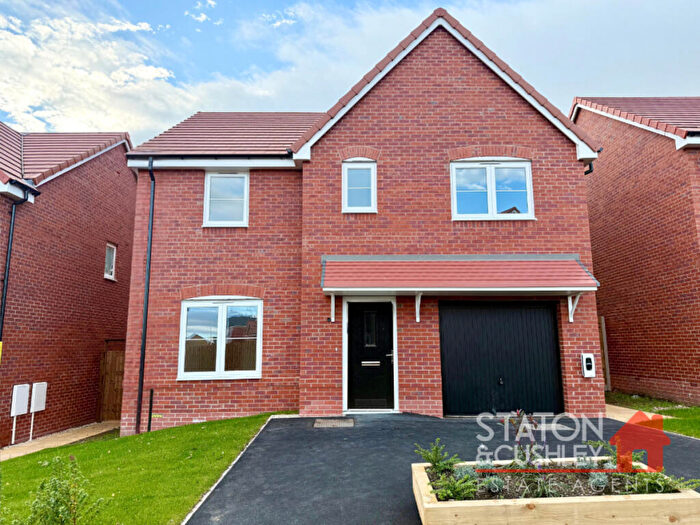
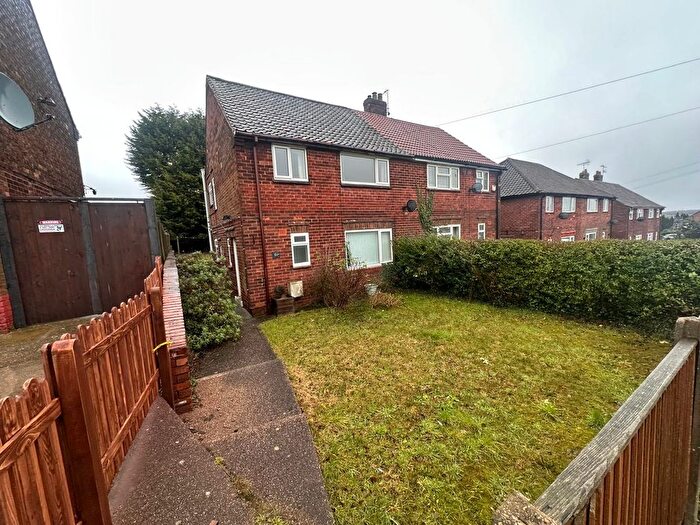
Properties for sale in Newlands
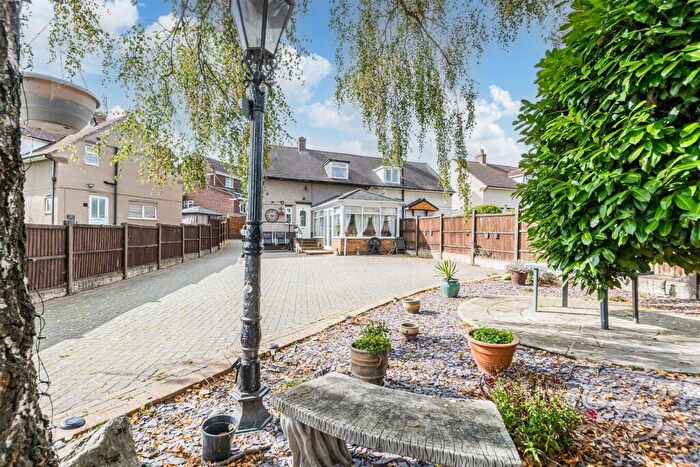
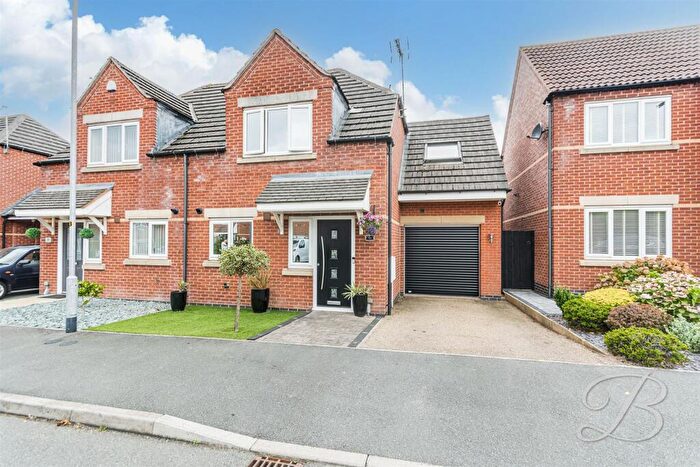
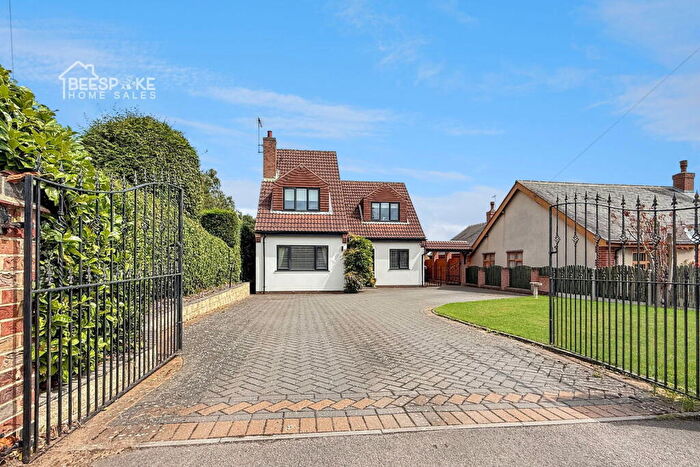
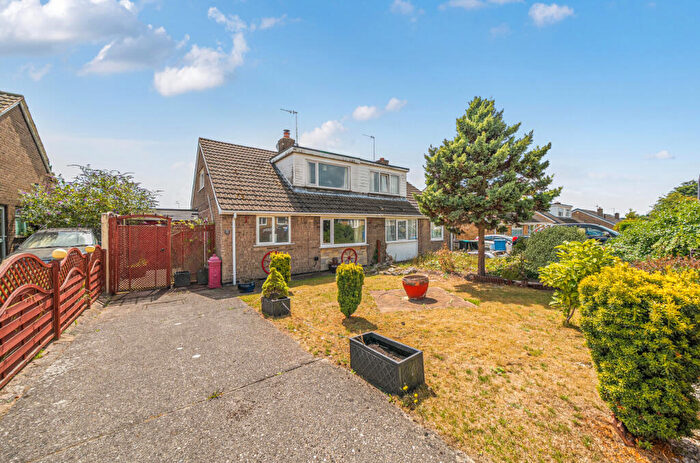
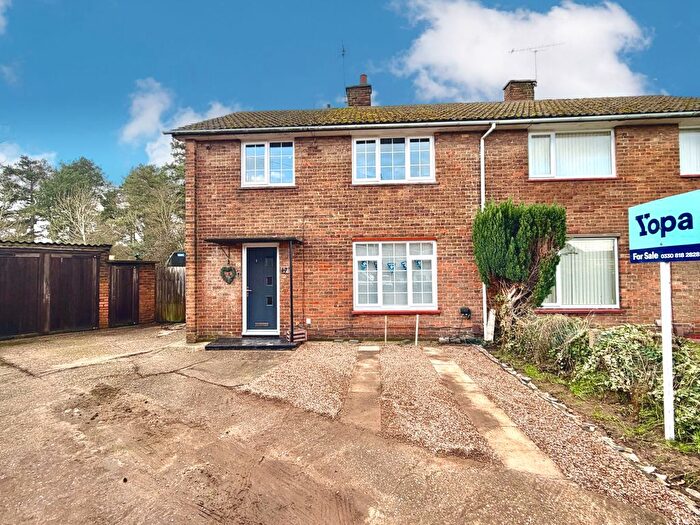
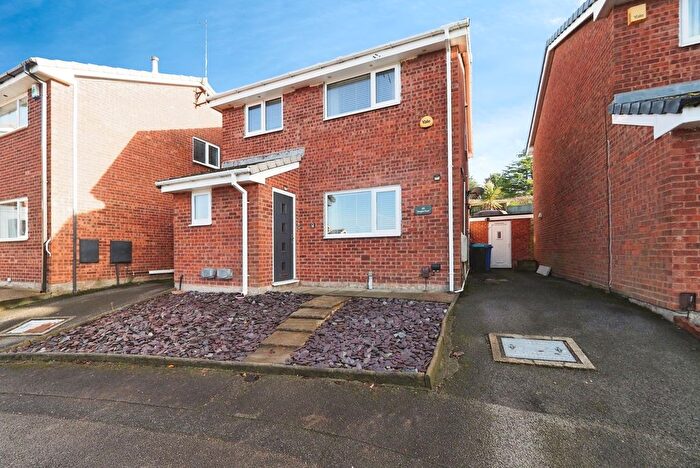
Previously listed properties in Newlands
Roads and Postcodes in Newlands
Navigate through our locations to find the location of your next house in Newlands, Mansfield for sale or to rent.
| Streets | Postcodes |
|---|---|
| Albans Court | NG19 0GD |
| Amber Grove | NG19 0RQ |
| Amberley Court | NG19 0JW |
| Birch Tree Close | NG19 0LF |
| Birchwood Park | NG19 0JN |
| Braemar Road | NG19 0LL |
| Carlton Close | NG19 0LE |
| Clipstone Drive | NG19 0JH NG19 0JJ |
| Clipstone Road East | NG19 0HS NG19 0HT |
| Clipstone Road West | NG19 0HL |
| Coppice Road | NG19 0JY NG19 0JZ |
| Crown Farm Way | NG19 0FT NG19 0FW |
| Edmonton Road | NG21 9AH NG21 9AJ |
| Fir Tree Close | NG19 0JE |
| Garibaldi Road | NG19 0JT NG19 0JU NG19 0JX NG19 0JA |
| Greenfield Close | NG19 0DX |
| Greenway | NG19 0LG NG19 0LQ |
| Hawksworth Avenue | NG19 0DG |
| Kelvin Close | NG19 0LW |
| Keyworth Drive | NG19 0DE |
| Langar Place | NG19 0DF |
| Langwell Drive | NG19 0JG |
| Lilac Grove | NG19 0JQ |
| Lime Grove | NG19 0HP NG19 0HR |
| Mansfield Road | NG21 9AB |
| Newlands Drive | NG19 0HY NG19 0HZ |
| Newlands Road | NG19 0HU |
| Parkway | NG19 0LH NG19 0LJ |
| Pelham Way | NG19 0LD |
| Plum Tree Avenue | NG19 0DH |
| Poplar Grove | NG19 0HN NG19 0HW |
| Queens Court | NG19 0LB |
| Stanley Road | NG19 0BZ |
| The Mount | NG19 0LA |
| Walkers Close | NG19 0DQ |
| Walnut Tree Crescent | NG19 0JB |
| Willow Tree Close | NG19 0JD |
| Windsor Road | NG19 0LP |
| Woodview Gardens | NG19 0JL |
| Yew Tree Avenue | NG19 0JF |
Transport near Newlands
- FAQ
- Price Paid By Year
- Property Type Price
Frequently asked questions about Newlands
What is the average price for a property for sale in Newlands?
The average price for a property for sale in Newlands is £199,412. This amount is 3% higher than the average price in Mansfield. There are 225 property listings for sale in Newlands.
What streets have the most expensive properties for sale in Newlands?
The streets with the most expensive properties for sale in Newlands are Poplar Grove at an average of £387,500, Woodview Gardens at an average of £380,000 and Stanley Road at an average of £351,250.
What streets have the most affordable properties for sale in Newlands?
The streets with the most affordable properties for sale in Newlands are Fir Tree Close at an average of £103,666, Garibaldi Road at an average of £122,125 and Walnut Tree Crescent at an average of £128,000.
Which train stations are available in or near Newlands?
Some of the train stations available in or near Newlands are Mansfield Woodhouse, Mansfield Town and Shirebrook (Derbys).
Property Price Paid in Newlands by Year
The average sold property price by year was:
| Year | Average Sold Price | Price Change |
Sold Properties
|
|---|---|---|---|
| 2025 | £220,314 | 9% |
27 Properties |
| 2024 | £201,467 | 10% |
31 Properties |
| 2023 | £180,378 | -8% |
33 Properties |
| 2022 | £194,665 | 0,3% |
51 Properties |
| 2021 | £194,137 | 12% |
58 Properties |
| 2020 | £170,071 | -9% |
35 Properties |
| 2019 | £185,734 | 24% |
32 Properties |
| 2018 | £141,106 | 4% |
53 Properties |
| 2017 | £135,119 | -12% |
33 Properties |
| 2016 | £150,674 | 6% |
54 Properties |
| 2015 | £141,964 | 17% |
47 Properties |
| 2014 | £117,671 | 1% |
44 Properties |
| 2013 | £116,486 | 13% |
40 Properties |
| 2012 | £101,164 | -14% |
35 Properties |
| 2011 | £115,530 | -22% |
26 Properties |
| 2010 | £141,263 | 12% |
34 Properties |
| 2009 | £123,750 | -25% |
12 Properties |
| 2008 | £154,343 | 23% |
23 Properties |
| 2007 | £118,970 | 9% |
42 Properties |
| 2006 | £108,717 | 2% |
54 Properties |
| 2005 | £106,811 | -0,2% |
38 Properties |
| 2004 | £107,013 | 33% |
61 Properties |
| 2003 | £71,577 | -1% |
44 Properties |
| 2002 | £72,187 | 23% |
43 Properties |
| 2001 | £55,236 | 9% |
43 Properties |
| 2000 | £50,011 | -4% |
27 Properties |
| 1999 | £51,773 | -16% |
42 Properties |
| 1998 | £59,846 | 37% |
32 Properties |
| 1997 | £37,483 | -24% |
30 Properties |
| 1996 | £46,476 | 18% |
30 Properties |
| 1995 | £37,980 | - |
30 Properties |
Property Price per Property Type in Newlands
Here you can find historic sold price data in order to help with your property search.
The average Property Paid Price for specific property types in the last three years are:
| Property Type | Average Sold Price | Sold Properties |
|---|---|---|
| Semi Detached House | £157,142.00 | 70 Semi Detached Houses |
| Detached House | £356,394.00 | 19 Detached Houses |
| Terraced House | £187,500.00 | 2 Terraced Houses |

