Houses for sale & to rent in Kingsway, Mansfield
House Prices in Kingsway
Properties in Kingsway have an average house price of £191,404.00 and had 125 Property Transactions within the last 3 years¹.
Kingsway is an area in Mansfield, Nottinghamshire with 1,201 households², where the most expensive property was sold for £550,000.00.
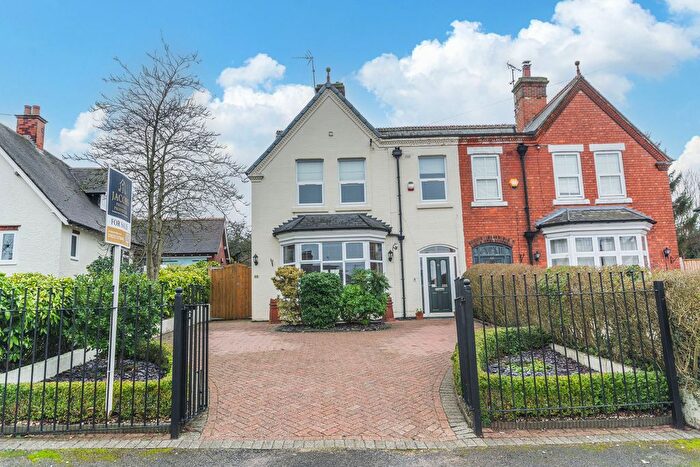
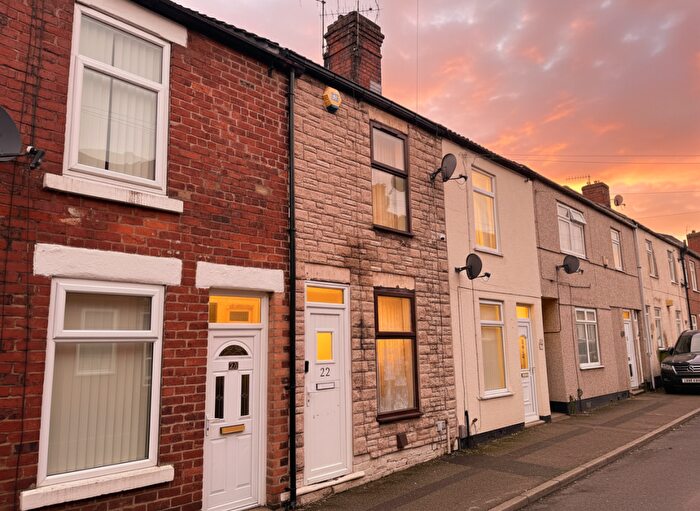
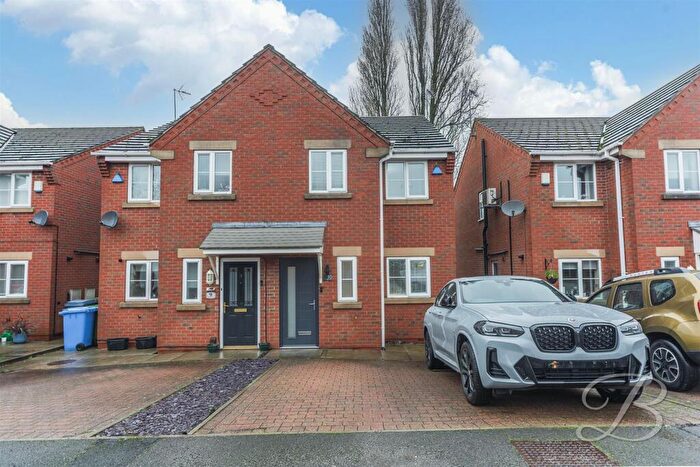
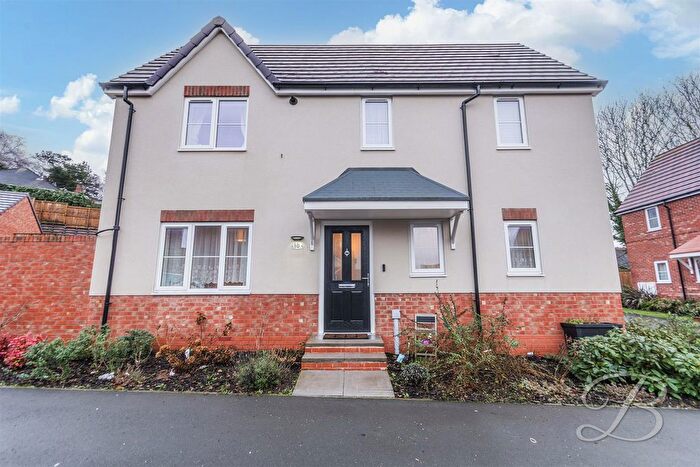
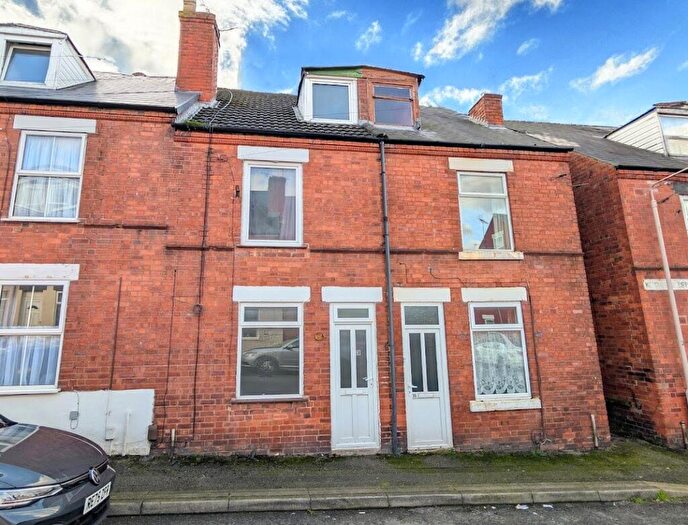
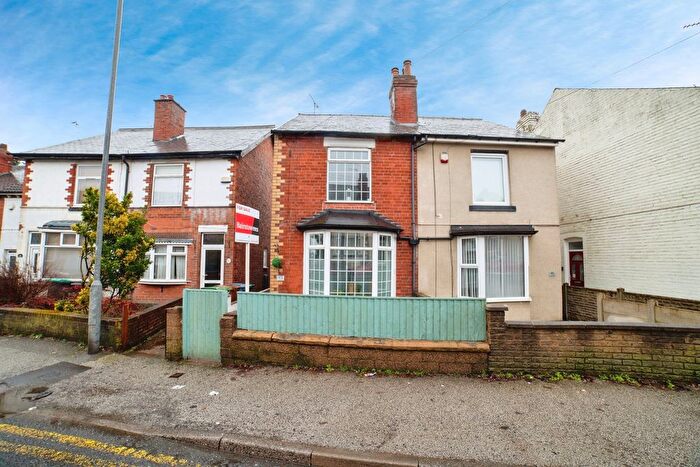
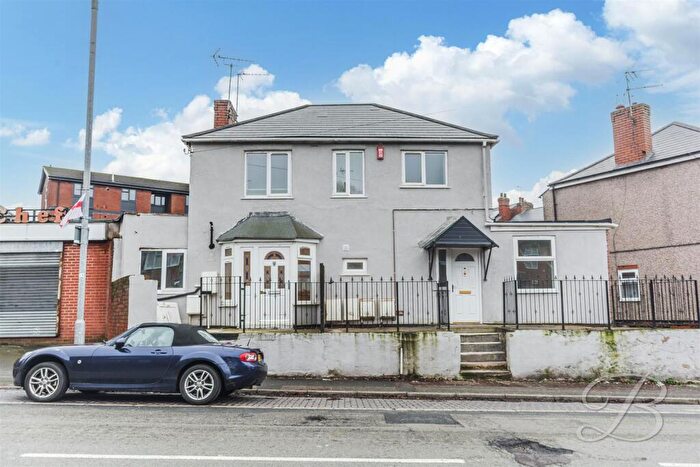
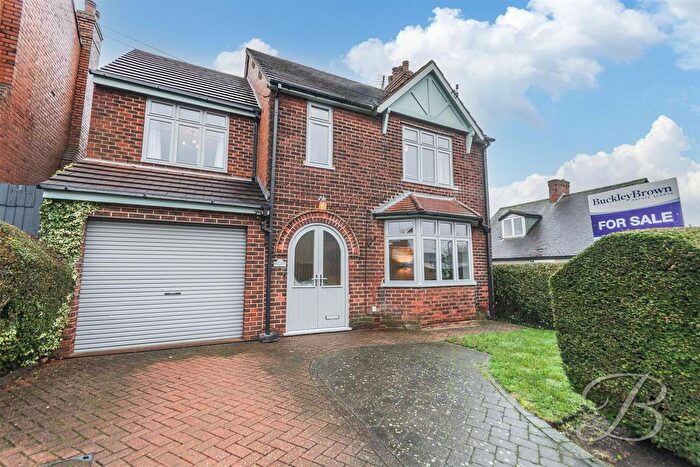
Properties for sale in Kingsway
Roads and Postcodes in Kingsway
Navigate through our locations to find the location of your next house in Kingsway, Mansfield for sale or to rent.
| Streets | Postcodes |
|---|---|
| Balls Lane | NG17 7BS |
| Barton Close | NG19 0DD |
| Clipstone Road West | NG19 0AA NG19 0BU NG19 0EF NG19 0EE |
| Coronation Drive | NG19 0AJ |
| Crown Avenue | NG19 0AQ |
| Derby Road | NG17 7QR |
| Diamond Avenue | NG17 7LT |
| Eighth Avenue | NG19 0BW |
| Ellesmere Road | NG19 0EG NG19 0EQ |
| Elmhurst Road | NG19 0EU |
| Epping Way | NG19 0GW |
| Fifth Avenue | NG19 0BJ |
| First Avenue | NG19 0BE |
| Fourth Avenue | NG19 0BH |
| Gisburn Grove | NG19 0GZ |
| Greenview Close | NG19 0DZ |
| Grives Lane | NG17 7FP |
| Grizedale Close | NG19 0GY |
| Grizedale Rise | NG19 0GA |
| Hanover Close | NG19 0AF |
| Kingsway | NG17 7BB NG19 0DU |
| Liber Close | NG19 0AW |
| Linden Road | NG19 0EL |
| Little Haven | NG19 0FA |
| Main Avenue | NG19 0BS |
| Morley Street | NG17 7AZ |
| Newlands Road | NG19 0HX |
| Ninth Avenue | NG19 0BP |
| Oakland Road | NG19 0EJ |
| Oakridge Close | NG19 0EY |
| Old Mill Lane | NG19 0EW |
| Olive Grove | NG19 0AP NG19 0AR |
| Potters Corner | NG19 0FG |
| Prestwold Avenue | NG19 0DB |
| Princess Avenue | NG19 0AG |
| Pump Hollow Lane | NG19 0AS |
| Pump Hollow Road | NG19 0AX |
| Queensway | NG19 0BX |
| Robey Close | NG19 0DY |
| Sandycliffe Close | NG19 0EX |
| Second Avenue | NG19 0BG |
| Seventh Avenue | NG19 0BN |
| Sherwood Grange | NG18 2EJ |
| Sherwood Hall Gardens | NG18 2EG |
| Sixth Avenue | NG19 0BL |
| St Leonards Way | NG19 0GX |
| Stanley Road | NG19 0BY |
| Stuart Avenue | NG19 0AB NG19 0AE |
| Tennyson Street | NG17 7DH NG17 7DS |
| Third Avenue | NG19 0BQ |
| Tudor Avenue | NG19 0AL |
| Vesper Court | NG19 0AN |
| Violet Hill | NG19 0AT |
| Walton Close | NG19 0DA |
| Wood Close | NG19 0EH |
| Woodhall Close | NG18 2EB |
| Woodhall Gardens | NG18 2EA |
| Woodland Road | NG19 0EN |
Transport near Kingsway
-
Mansfield Town Station
-
Mansfield Woodhouse Station
-
Sutton Parkway Station
-
Shirebrook (Derbys) Station
-
Kirkby in Ashfield Station
- FAQ
- Price Paid By Year
- Property Type Price
Frequently asked questions about Kingsway
What is the average price for a property for sale in Kingsway?
The average price for a property for sale in Kingsway is £191,404. This amount is 2% lower than the average price in Mansfield. There are 6,503 property listings for sale in Kingsway.
What streets have the most expensive properties for sale in Kingsway?
The streets with the most expensive properties for sale in Kingsway are Newlands Road at an average of £330,000, Woodland Road at an average of £296,250 and Potters Corner at an average of £295,375.
What streets have the most affordable properties for sale in Kingsway?
The streets with the most affordable properties for sale in Kingsway are Fourth Avenue at an average of £94,666, Ninth Avenue at an average of £101,666 and Third Avenue at an average of £104,200.
Which train stations are available in or near Kingsway?
Some of the train stations available in or near Kingsway are Mansfield Town, Mansfield Woodhouse and Sutton Parkway.
Property Price Paid in Kingsway by Year
The average sold property price by year was:
| Year | Average Sold Price | Price Change |
Sold Properties
|
|---|---|---|---|
| 2025 | £219,555 | 14% |
36 Properties |
| 2024 | £189,302 | 10% |
44 Properties |
| 2023 | £170,938 | 3% |
45 Properties |
| 2022 | £165,272 | -17% |
68 Properties |
| 2021 | £193,571 | 9% |
82 Properties |
| 2020 | £176,184 | 16% |
63 Properties |
| 2019 | £147,623 | 8% |
54 Properties |
| 2018 | £135,488 | 12% |
57 Properties |
| 2017 | £119,246 | -3% |
59 Properties |
| 2016 | £122,539 | 2% |
55 Properties |
| 2015 | £120,432 | 2% |
59 Properties |
| 2014 | £118,206 | 3% |
40 Properties |
| 2013 | £114,774 | -1% |
43 Properties |
| 2012 | £115,577 | 7% |
34 Properties |
| 2011 | £107,872 | -14% |
34 Properties |
| 2010 | £123,200 | -2% |
29 Properties |
| 2009 | £125,736 | 19% |
19 Properties |
| 2008 | £102,429 | -7% |
22 Properties |
| 2007 | £109,403 | 2% |
67 Properties |
| 2006 | £107,726 | -6% |
58 Properties |
| 2005 | £114,105 | 20% |
51 Properties |
| 2004 | £91,583 | 0,4% |
77 Properties |
| 2003 | £91,206 | 32% |
123 Properties |
| 2002 | £62,428 | 7% |
56 Properties |
| 2001 | £58,147 | 13% |
72 Properties |
| 2000 | £50,540 | -3% |
35 Properties |
| 1999 | £52,031 | 16% |
62 Properties |
| 1998 | £43,849 | 3% |
69 Properties |
| 1997 | £42,647 | -13% |
63 Properties |
| 1996 | £48,091 | 17% |
54 Properties |
| 1995 | £39,842 | - |
35 Properties |
Property Price per Property Type in Kingsway
Here you can find historic sold price data in order to help with your property search.
The average Property Paid Price for specific property types in the last three years are:
| Property Type | Average Sold Price | Sold Properties |
|---|---|---|
| Semi Detached House | £189,283.00 | 46 Semi Detached Houses |
| Detached House | £274,197.00 | 38 Detached Houses |
| Terraced House | £117,048.00 | 41 Terraced Houses |

