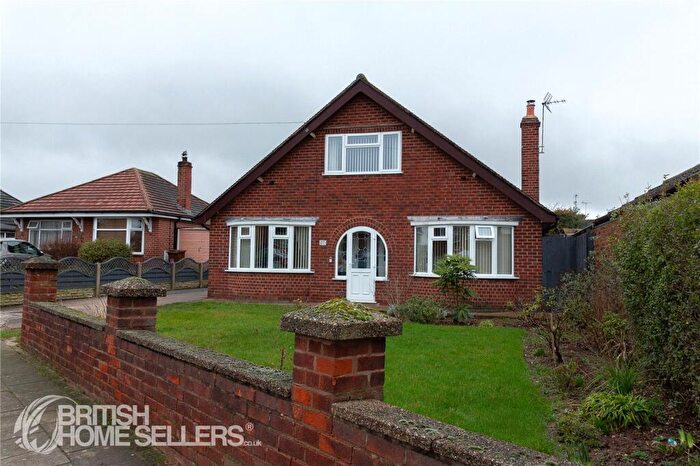
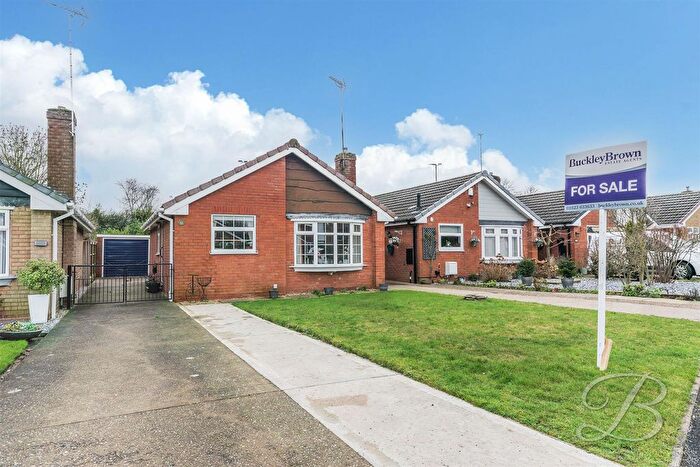
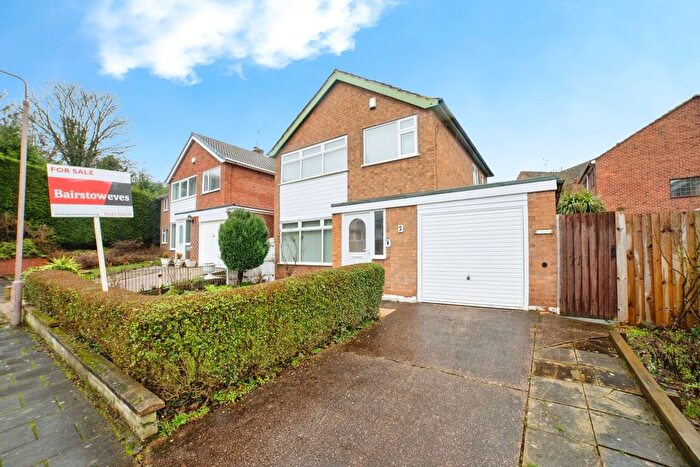
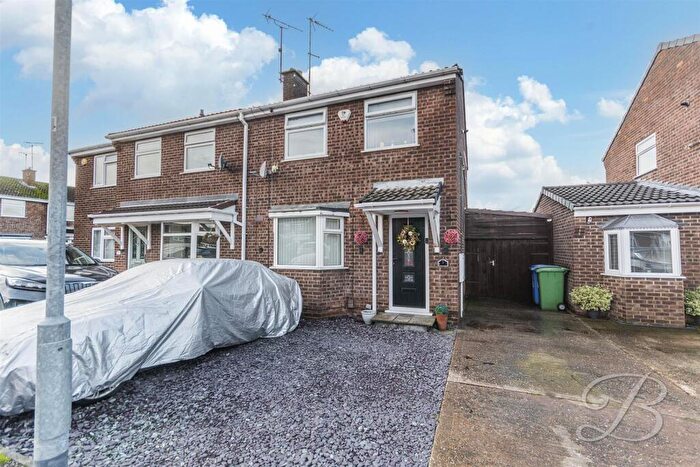
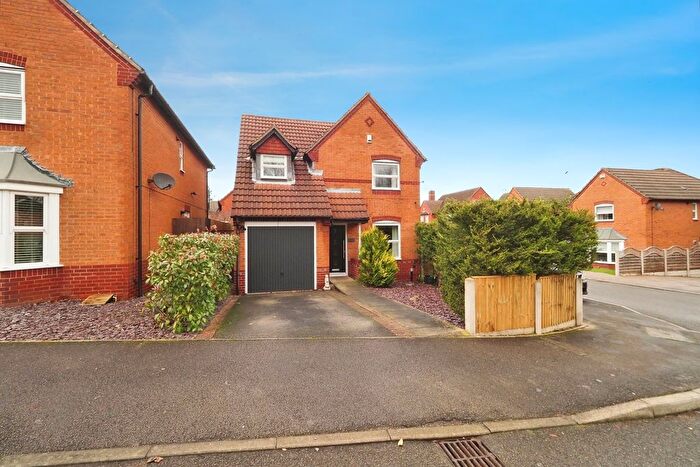
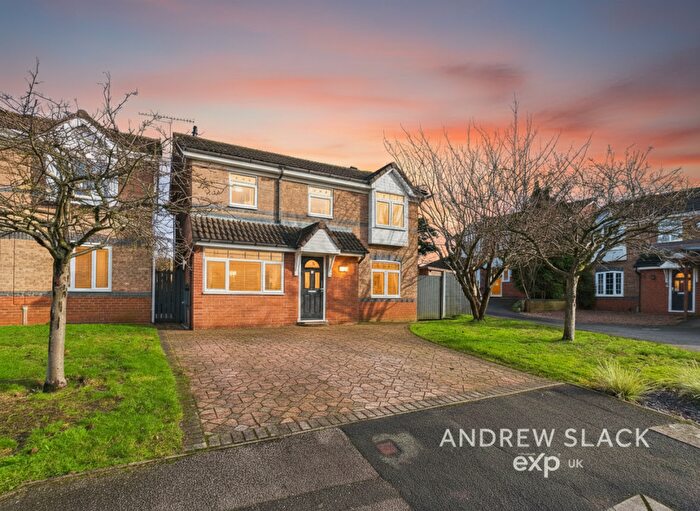
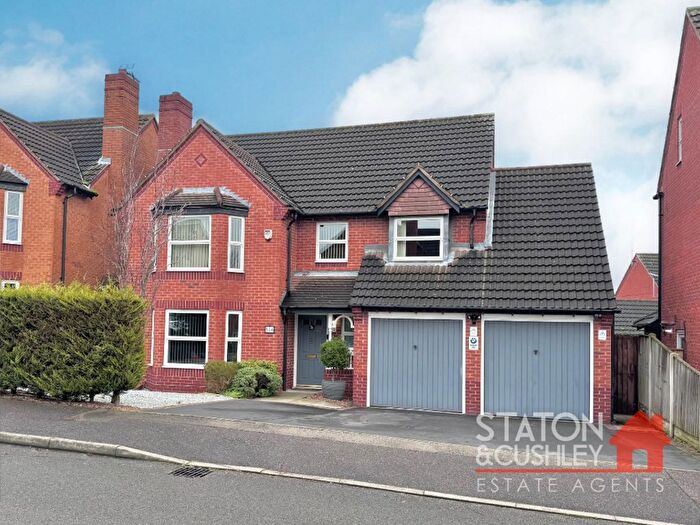
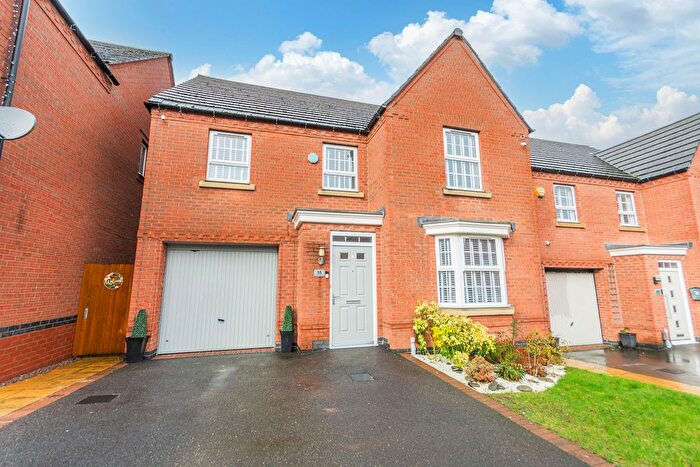
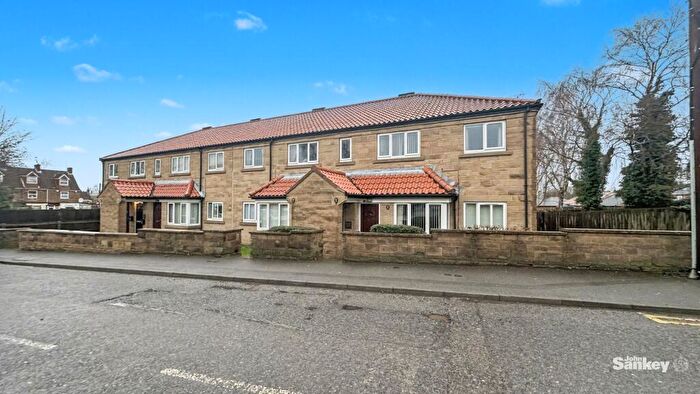
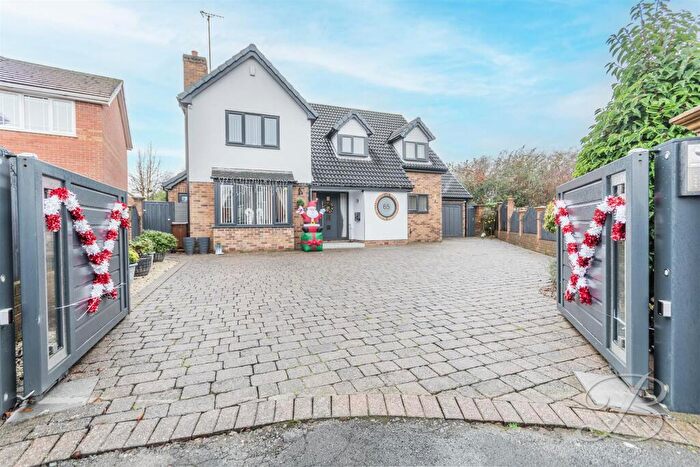
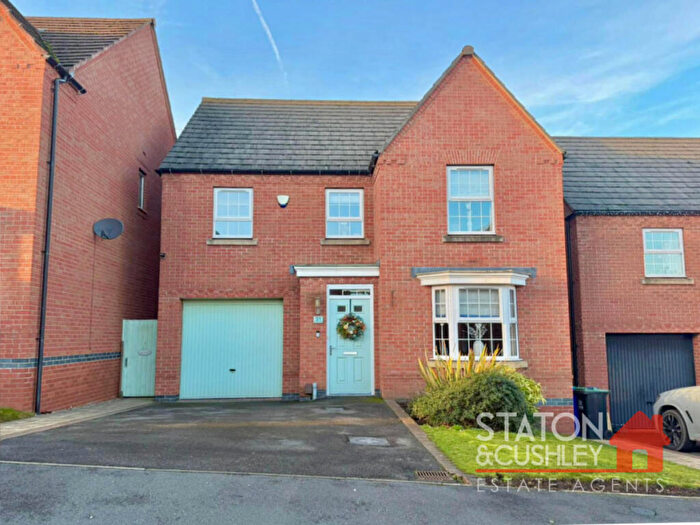
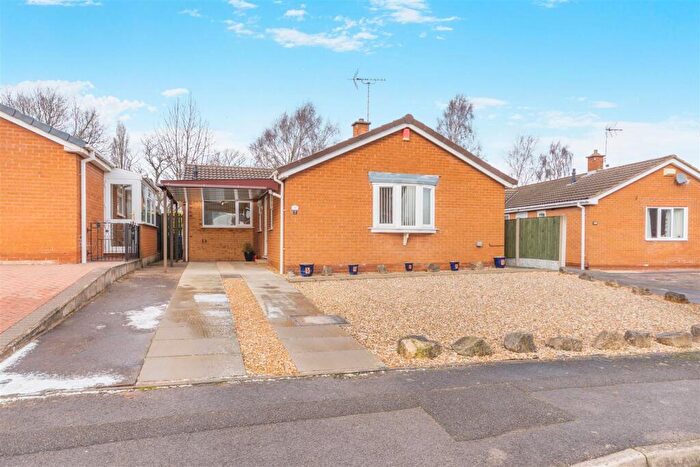
Houses for sale & to rent in Hornby, Mansfield
House Prices in Hornby
Properties in Hornby have an average house price of £225,559.00 and had 101 Property Transactions within the last 3 years¹.
Hornby is an area in Mansfield, Nottinghamshire with 1,076 households², where the most expensive property was sold for £405,000.00.
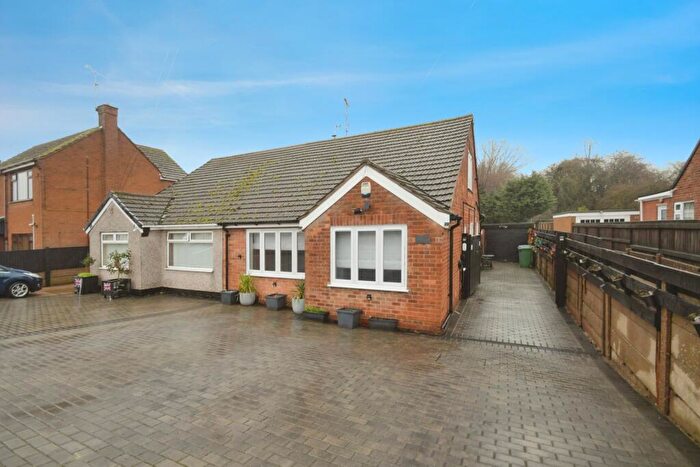
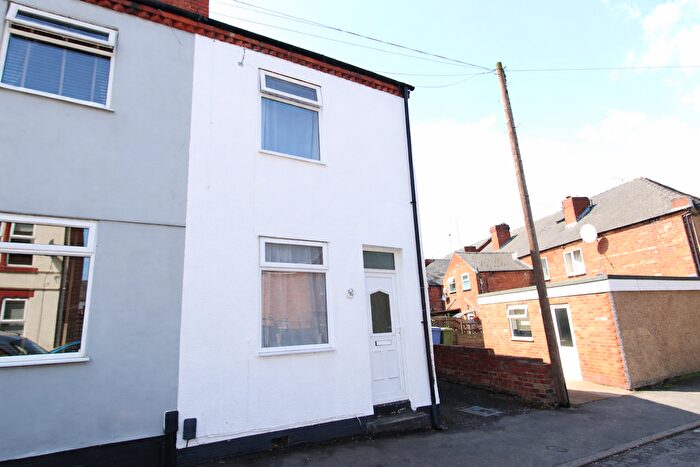
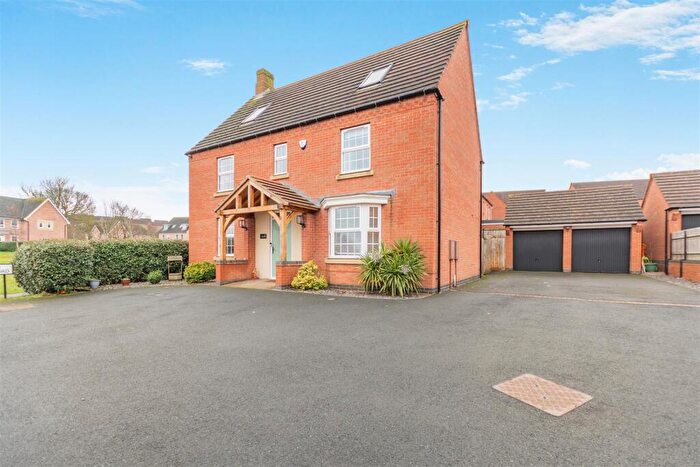
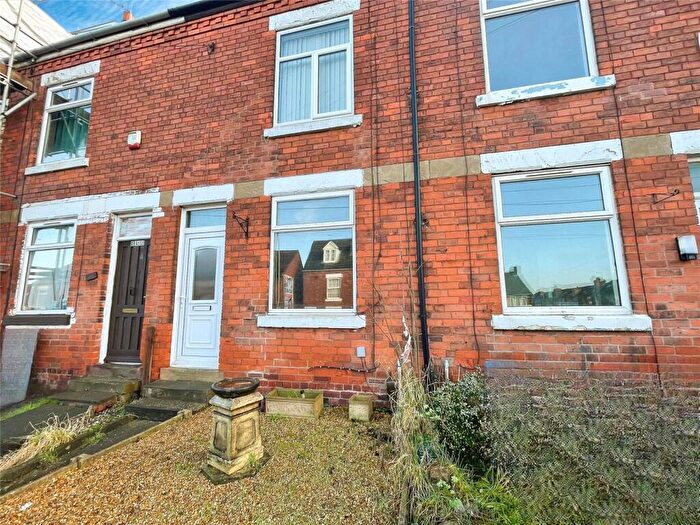
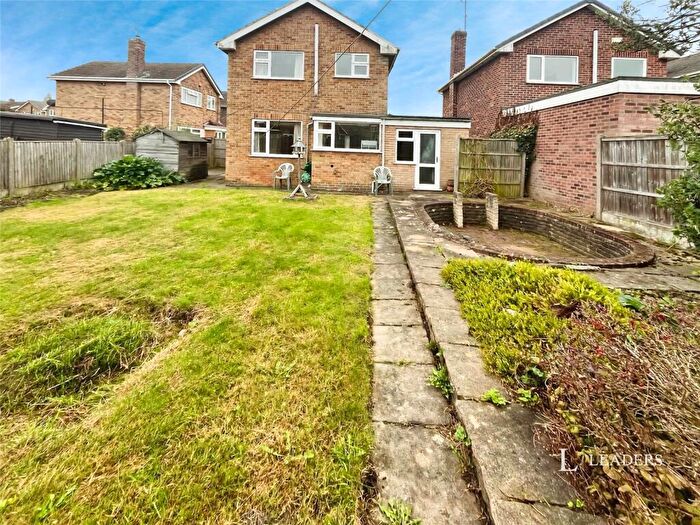
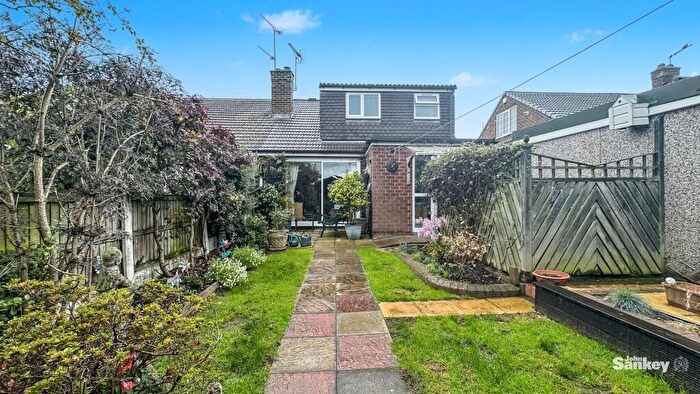
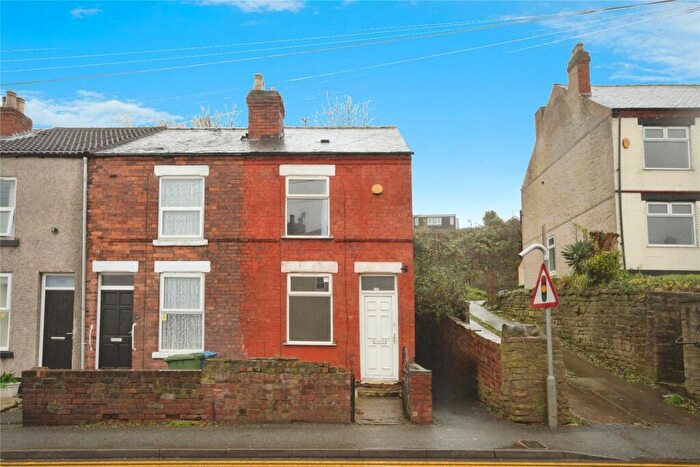
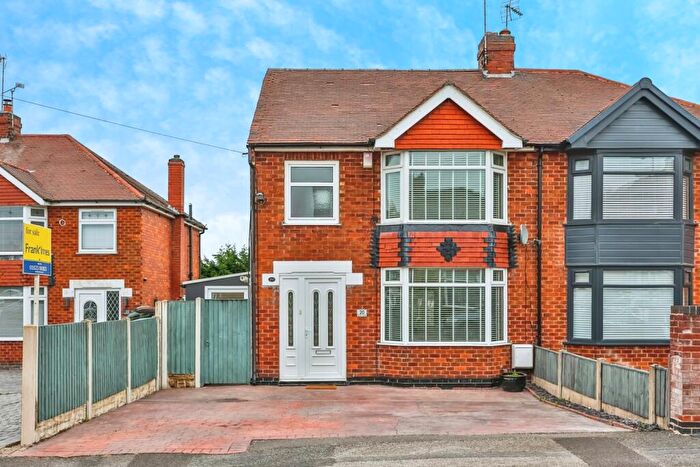
Properties for sale in Hornby
Roads and Postcodes in Hornby
Navigate through our locations to find the location of your next house in Hornby, Mansfield for sale or to rent.
| Streets | Postcodes |
|---|---|
| Ashby Avenue | NG19 9HT |
| Ashwell Avenue | NG19 9ER |
| Ashwood Close | NG19 9HD |
| Balmoral Close | NG19 9GX |
| Barley Mews | NG19 9DZ |
| Buckingham Close | NG19 9GY |
| Dennor Drive | NG19 9HE |
| Dingley Close | NG19 9HF |
| Dormy Close | NG19 9DP |
| Field Close | NG19 9QP |
| Freeby Avenue | NG19 9HS |
| Greenholme Park | NG19 9EA |
| Harby Avenue | NG19 9HU |
| Hawthorn Close | NG19 9EQ |
| Haycroft Close | NG19 9SJ |
| Hoylake Close | NG19 9EJ |
| Kensington Close | NG19 9GZ |
| Leabrooks Avenue | NG19 9HX |
| Leadale Crescent | NG19 9HJ NG19 9HL |
| Leeming Lane North | NG19 9EF NG19 9EP NG19 9ET NG19 9EU NG19 9EX NG19 9HP NG19 9HR |
| Lindrick Close | NG19 9EL |
| Little Acre | NG19 9QR |
| Long Meadow | NG19 9QW |
| Louwil Avenue | NG19 9ES |
| Marples Avenue | NG19 9DN NG19 9DW NG19 9EY NG19 9EZ NG19 9HA NG19 9HB |
| Meadow Bank | NG19 9QX |
| Muirfield Way | NG19 9EH |
| Norfolk Court | NG19 9HW |
| Peafield Lane | NG19 9DS NG19 9HG |
| Peafield Lane Woodhouse | NG19 9EG |
| Sandringham Road | NG19 9HN |
| Small Gate | NG19 9QZ |
| Spinney Close | NG19 9QY |
| St James Gardens | NG19 9FE |
| The Fairways | NG19 9EW |
| The Mynd | NG19 9QU |
| The Paddocks | NG19 9QT |
| The Pastures | NG19 9QS |
| The Rushes | NG19 9RG |
| Welwyn Avenue | NG19 9DR |
| West Leigh | NG19 9QN |
| Wheatfield Crescent | NG19 9HH NG19 9HQ |
Transport near Hornby
- FAQ
- Price Paid By Year
- Property Type Price
Frequently asked questions about Hornby
What is the average price for a property for sale in Hornby?
The average price for a property for sale in Hornby is £225,559. This amount is 16% higher than the average price in Mansfield. There are 457 property listings for sale in Hornby.
What streets have the most expensive properties for sale in Hornby?
The streets with the most expensive properties for sale in Hornby are Buckingham Close at an average of £322,500, The Paddocks at an average of £314,166 and Peafield Lane at an average of £297,000.
What streets have the most affordable properties for sale in Hornby?
The streets with the most affordable properties for sale in Hornby are Hoylake Close at an average of £171,000, The Pastures at an average of £174,700 and Ashwood Close at an average of £177,500.
Which train stations are available in or near Hornby?
Some of the train stations available in or near Hornby are Mansfield Woodhouse, Mansfield Town and Shirebrook (Derbys).
Property Price Paid in Hornby by Year
The average sold property price by year was:
| Year | Average Sold Price | Price Change |
Sold Properties
|
|---|---|---|---|
| 2025 | £235,318 | 9% |
22 Properties |
| 2024 | £214,533 | -9% |
45 Properties |
| 2023 | £233,838 | 13% |
34 Properties |
| 2022 | £203,371 | 0,1% |
45 Properties |
| 2021 | £203,158 | 8% |
47 Properties |
| 2020 | £186,955 | 7% |
34 Properties |
| 2019 | £174,102 | 8% |
36 Properties |
| 2018 | £159,666 | 3% |
36 Properties |
| 2017 | £154,311 | - |
43 Properties |
| 2016 | £154,362 | -2% |
48 Properties |
| 2015 | £157,360 | 13% |
38 Properties |
| 2014 | £137,548 | 5% |
44 Properties |
| 2013 | £131,236 | 1% |
41 Properties |
| 2012 | £129,360 | 2% |
33 Properties |
| 2011 | £126,742 | -8% |
35 Properties |
| 2010 | £137,336 | -8% |
29 Properties |
| 2009 | £148,253 | -11% |
32 Properties |
| 2008 | £164,208 | 10% |
28 Properties |
| 2007 | £147,509 | -5% |
35 Properties |
| 2006 | £154,956 | 12% |
49 Properties |
| 2005 | £136,730 | 8% |
43 Properties |
| 2004 | £125,841 | 14% |
66 Properties |
| 2003 | £108,357 | 18% |
55 Properties |
| 2002 | £89,189 | 26% |
66 Properties |
| 2001 | £65,869 | 5% |
51 Properties |
| 2000 | £62,352 | 7% |
58 Properties |
| 1999 | £57,755 | -1% |
62 Properties |
| 1998 | £58,243 | 4% |
48 Properties |
| 1997 | £55,993 | 7% |
41 Properties |
| 1996 | £51,848 | -2% |
51 Properties |
| 1995 | £52,837 | - |
36 Properties |
Property Price per Property Type in Hornby
Here you can find historic sold price data in order to help with your property search.
The average Property Paid Price for specific property types in the last three years are:
| Property Type | Average Sold Price | Sold Properties |
|---|---|---|
| Semi Detached House | £188,979.00 | 48 Semi Detached Houses |
| Detached House | £262,235.00 | 51 Detached Houses |
| Terraced House | £168,250.00 | 2 Terraced Houses |

